AI Generated Quiz
Secondary 4 Geography Resources Sustainability Quiz
Free Sec 4 Geography Resources Sustainability quiz, HY3 AI version, with questions, answers, and O Level-style practice for Singapore students.
These static practice materials are generated from the site's syllabus and paper-generation workflow, with source and model context shown so students and parents can evaluate the material before use.
Questions
Secondary 4 Geography Quiz - Resources Sustainability
Name: ___________________________
Class: ______________
Date: ______________
Score: _______ / 40
Duration: 50 minutes
Total Marks: 40
Instructions: Answer all 20 questions. Section A is short answer. Section B is data and source interpretation. Section C is structured response. Use the spaces provided. Write clearly and use geographical terms.
Section A: Short Answer (Questions 1–5, 1 mark each)
1. Define "sustainable development" in your own words.
2. Name one type of ecosystem service provided by urban forests.
3. State one reason why Singapore faces food security challenges.
4. Give one example of a renewable resource.
5. What does "water catchment" mean?
Section B: Data and Source Interpretation (Questions 6–15)
6. Study Table 1 which shows Singapore's water usage by sector in 2023.
| Sector | Usage (million gallons per day) |
|---|---|
| Households | 320 |
| Industry | 210 |
| Commercial | 130 |
With reference to Table 1, calculate the total water used per day and state which sector uses the most. [2]
Total: ____________
Most: ____________
7. Study Table 2 showing renewable energy share in Country X.
| Year | Solar (%) | Wind (%) | Hydro (%) |
|---|---|---|---|
| 2018 | 5 | 10 | 40 |
| 2023 | 15 | 12 | 38 |
Describe the trend in solar energy use from 2018 to 2023. [2]
8. Study the extract below.
"Country Y imports 90% of its food. Rising global prices and extreme weather have reduced exports from its main suppliers. The government plans to grow more food locally using vertical farms."
Suggest one risk to food security in Country Y. [1]
9. Using the same extract in Q8, explain how vertical farming can improve sustainability. [2]
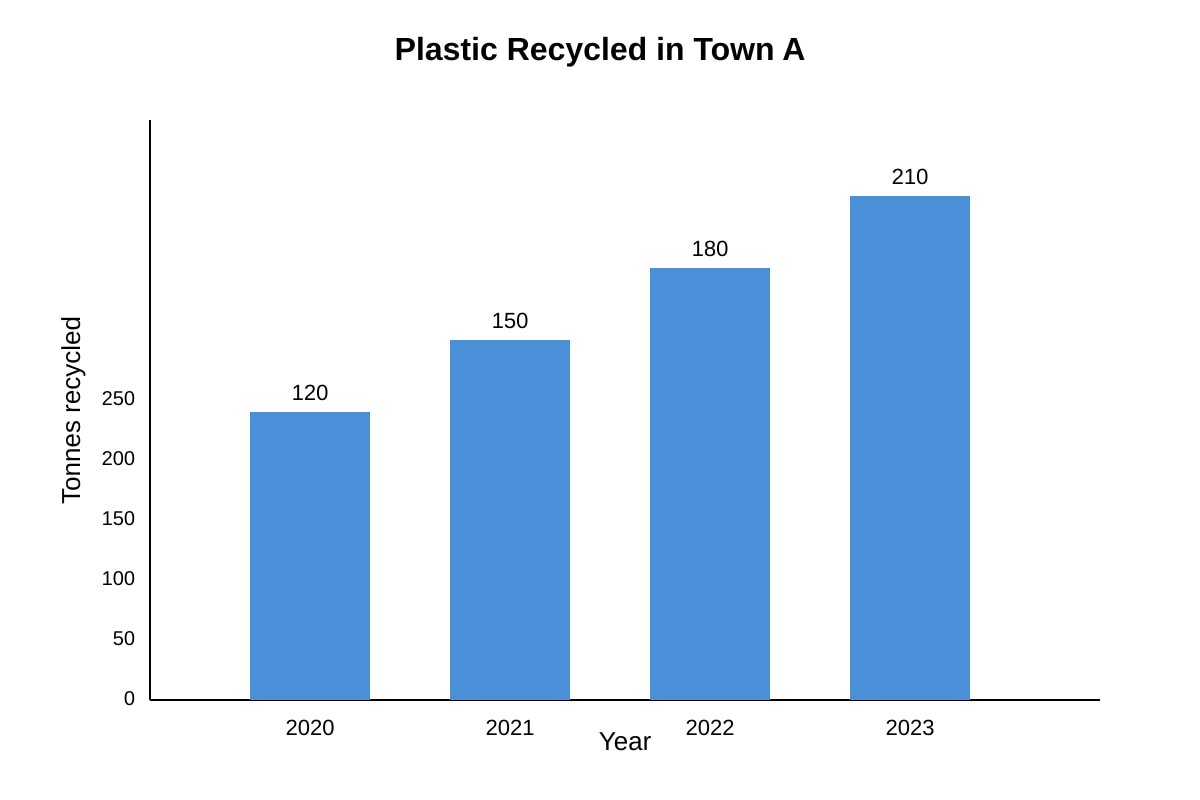
10. Study Figure 1 which shows a bar graph of plastic waste recycled in Town A from 2020–2023.
Image pending generation: graph for Q10.
With reference to Figure 1, describe the trend in plastic recycling. [2]
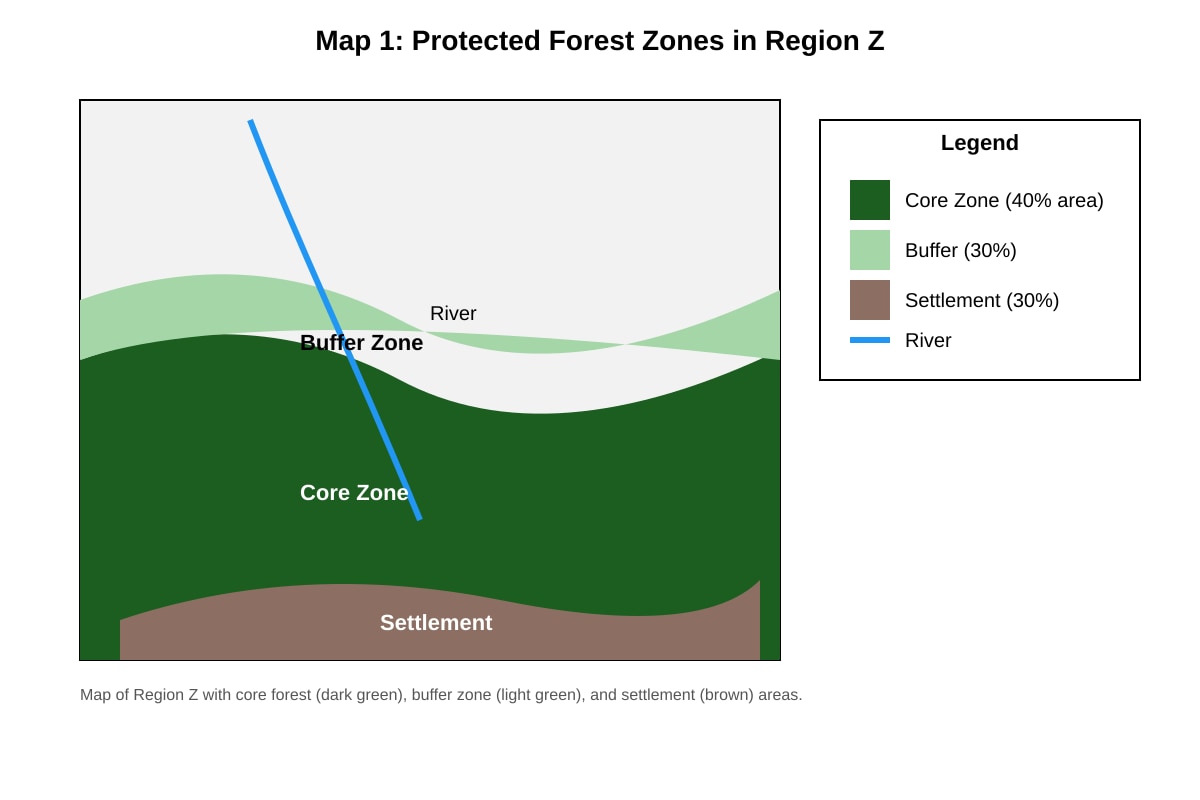
11. Study Map 1 showing protected forest zones in Region Z.
Image pending generation: map for Q11.
Explain how the buffer zone helps sustainability. [2]
12. Table 3 shows carbon emissions per capita (tonnes) for 3 countries.
| Country | 2010 | 2020 |
|---|---|---|
| A | 8.0 | 6.5 |
| B | 2.0 | 2.2 |
| C | 12.0 | 10.0 |
Which country reduced emissions the most in absolute terms? [1]
13. Using Table 3 above, calculate the percentage decrease for Country A. [2]
Show working: __________________________________________________
Answer: ____________%
14. Study the source: "A city uses treated wastewater for industrial cooling, reducing demand on freshwater by 20%."
State one way this supports water sustainability. [1]
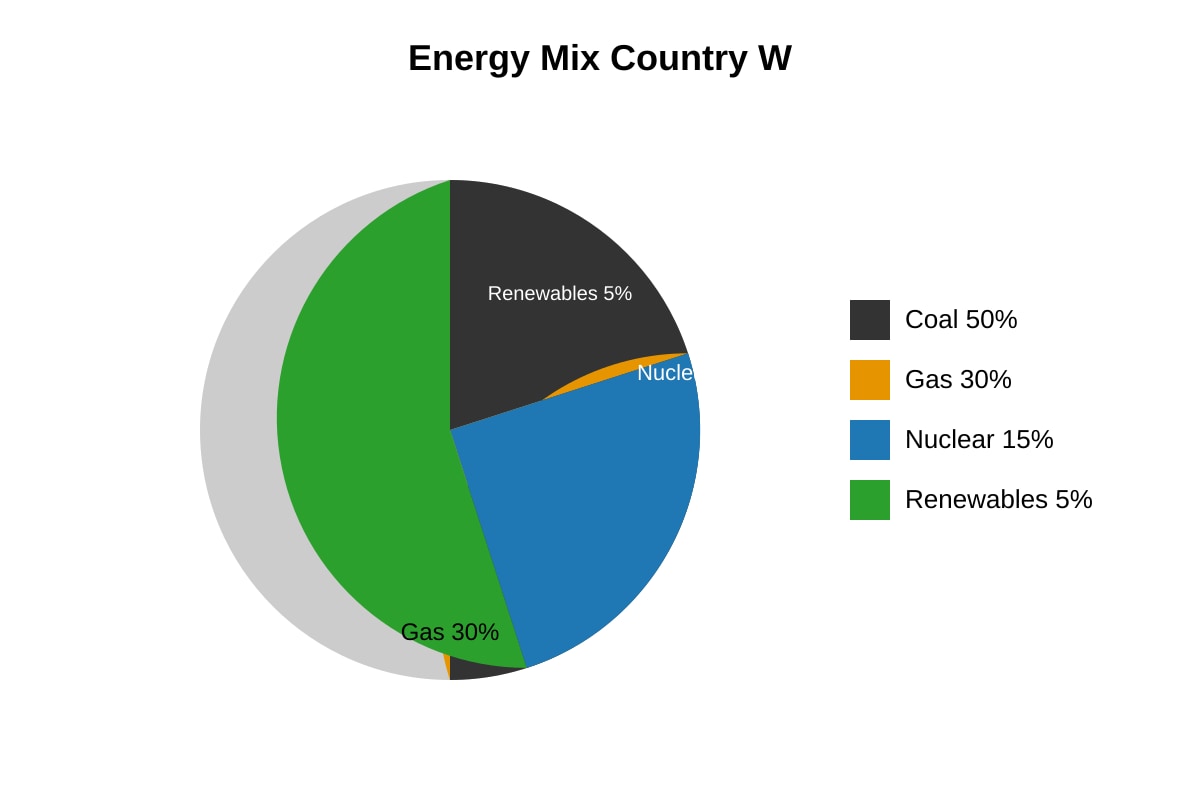
15. Figure 2 is a pie chart of energy sources in Country W.
Image pending generation: chart for Q15.
With reference to Figure 2, give one reason this energy mix is unsustainable. [1]
Section C: Structured Response (Questions 16–20)
16. Explain two strategies Singapore uses to ensure water sustainability. [4]
(a) _______________________________________________________
(b) _______________________________________________________
17. Describe how ecosystem services support urban sustainability. Use one example. [3]
18. A school plans a fieldwork study on recycling habits. Describe a suitable sampling method and data collection technique. [3]
19. "Economic growth always harms the environment." Do you agree? Explain with a sustainability perspective. [3]
20. Study Table 4 on food sources for City M.
| Source | % of supply |
|---|---|
| Local farms | 25 |
| Imports | 75 |
Suggest two ways City M can improve food security. [3]
(a) _______________________________________________________
(b) _______________________________________________________
Answers
Secondary 4 Geography Quiz - Resources Sustainability (Answer Key)
Total Marks: 40
Topic: Resources Sustainability
Level: Secondary 4
Section A: Short Answer (1 mark each)
1. Define "sustainable development".
Answer: Development that meets the needs of the present without compromising the ability of future generations to meet their own needs.
Teaching note: This is the Brundtland definition. Key idea: balance present and future. Mark: 1 for correct meaning.
2. Name one ecosystem service from urban forests.
Answer: Any one – provisioning (e.g., timber), regulating (e.g., air purification), cultural (e.g., recreation), supporting (e.g., soil formation).
Mark: 1 for valid type.
3. State one reason Singapore faces food security challenges.
Answer: Limited land for agriculture / high dependence on imports (over 90%).
Mark: 1.
4. Give one renewable resource example.
Answer: Solar energy, wind, hydro, biomass.
Mark: 1.
5. What does "water catchment" mean?
Answer: An area where rainwater is collected and stored for use (e.g., reservoirs).
Mark: 1.
Section B: Data and Source Interpretation
6. [2]
Total = 320 + 210 + 130 = 660 million gallons/day. Most: Households.
Working: Addition of table values. Mark: 1 for total, 1 for sector.
7. [2]
Solar increased from 5% to 15% (tripled). Wind slight rise 10→12, hydro slight drop.
Mark: 2 for describing solar trend with values.
8. [1]
Risk: Supply disruption from weather/price shocks due to 90% import reliance.
Mark: 1.
9. [2]
Vertical farming uses less land, local production cuts transport emissions, year-round yield.
Mark: 2 for two points linking to sustainability.
10. [2]
Trend: Recycling rose from 120 to 210 tonnes (75% increase) over 4 years, steady growth.
Based on placeholder: Bars show linear increase. Mark: 2 for trend with values.
11. [2]
Buffer absorbs human impact, protects core from settlement, allows controlled use.
Based on map: Light green surrounds dark core. Mark: 2 for explanation.
12. [1]
Country C: 12.0 → 10.0 = 2.0 tonnes cut (most absolute).
Mark: 1.
13. [2]
Decrease = (8.0 - 6.5)/8.0 × 100 = 1.5/8.0 × 100 = 18.75%.
Mark: 1 working, 1 answer.
14. [1]
Reuses water, conserves freshwater supply.
Mark: 1.
15. [1]
80% from fossil fuels (coal+gas), high emissions, non-renewable.
Based on chart: Coal 50 + Gas 30. Mark: 1.
Section C: Structured Response
16. [4]
(a) NEWater – recycled wastewater for non-domestic use.
(b) Catchment management – all land as catchment, rainwater collection.
Mark: 2 each, descriptors: names strategy + explains.
17. [3]
Ecosystem services: regulating (e.g., trees cool air, absorb CO2). Example: urban park reduces heat island.
Mark: 1 concept, 2 example/application.
18. [3]
Method: Stratified sampling by housing type. Technique: Questionnaire on recycling habits + bin audit.
Mark: 1 sampling, 2 technique.
19. [3]
Disagree: Green tech, circular economy can grow with less harm. Sustainability needs balance.
Mark: 1 stance, 2 reasoning.
20. [3]
(a) Increase local farm yield (vertical farms).
(b) Diversify import sources to reduce risk.
Mark: 1.5 each.
Free quiz and exam paper access
Enter your details to view this paper
Your access is remembered on this device.