AI Generated Quiz
Secondary 4 Geography Physical Geography Quiz
Free Sec 4 Geography Physical Geography quiz, HY3 AI version, with questions, answers, and O Level-style practice for Singapore students.
These static practice materials are generated from the site's syllabus and paper-generation workflow, with source and model context shown so students and parents can evaluate the material before use.
Questions

Free quiz and exam paper access
Enter your details to view this paper
Your access is remembered on this device.
Answers
Secondary 4 Geography Quiz - Physical Geography (Answer Key)
Total Marks: 40
Topic: Physical Geography (Climate & Tectonics)
Section A: Short Structured Questions (1–8)
1. [1] One cause: Burning of fossil fuels releases CO₂ which traps heat.
Teaching note: Greenhouse effect is when gases (CO₂, methane) absorb outgoing infrared radiation. Fossil fuel combustion is a key anthropogenic source.
2. [1] Adiabatic cooling (or uplift and cooling).
Teaching note: As air rises, pressure drops, it expands and cools without heat loss; condensation occurs when dew point reached.
3. [1] The focus is the point inside the Earth where the earthquake rupture starts.
Teaching note: Contrast with epicentre (point on surface above focus).
4. [1] Primary effect: Lava flow / ash fall / pyroclastic flow (any one).
Teaching note: Primary = direct physical outbreak; secondary = e.g., famine, disease.
5. [1] Constructive (or divergent) boundary.
Teaching note: Plates move apart; new crust forms (e.g., Mid-Atlantic Ridge).
6. [1] Deforestation / burning coal / driving petrol cars (any one).
Teaching note: Removes sinks or adds CO₂.
7. [1] Solar power / wind power / hydroelectric (any one).
Teaching note: Renewable = naturally replenished, low carbon.
8. [1] Epicentral distance.
Teaching note: Derived from time lag between P and S waves.
Section B: Data and Diagram Interpretation (9–14)
9. [3]
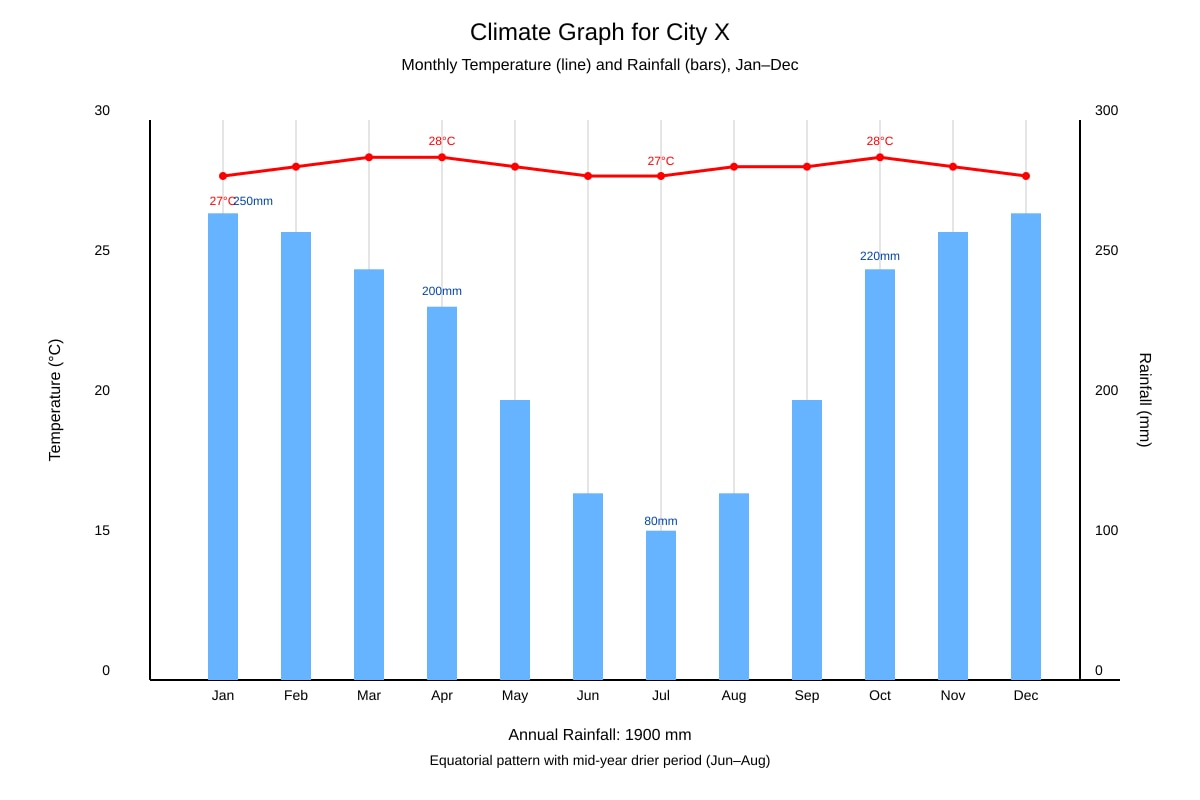
(a) [2] Temperature high year-round (27–28°C), variation <2°C.
(b) [1] Rainfall high (1900mm total), lower in mid-year (Jul 80mm), peaks Apr & Oct.
Marking: 2 marks for quantified temp description, 1 for rainfall pattern.
Teaching: Equatorial climate shows low annual temp range; convectional rain peaks at equinoxes.
10. [2] Characteristics: (1) High wave height (~3m); (2) Backwash stronger than swash; (3) Frequent (12/min). Any two = 2 marks.
Teaching: Destructive waves erode coast, steep profile.
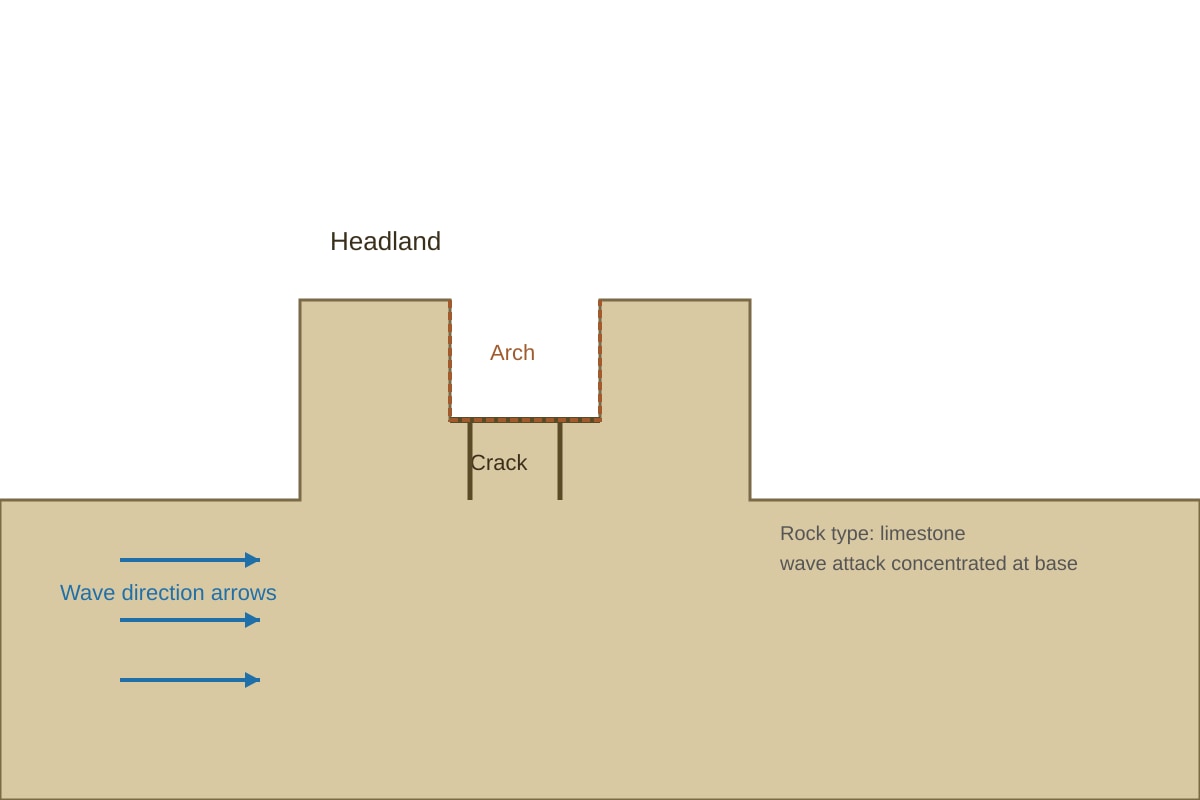
11. [3] Explanation: Waves attack headland base (hydraulic action) → cracks widen → arch forms when crack penetrates. 1 mark location, 2 marks process.
Teaching: Limestone weak at joints; wave concentration exploits lines of weakness.
12. [2] Mean = (5.2+6.1+4.8+6.5+5.9)/5 = 28.5/5 = 5.7.
Working: Sum = 28.5, ÷5 = 5.7 Richter.
Marking: 1 for sum, 1 for division/answer.
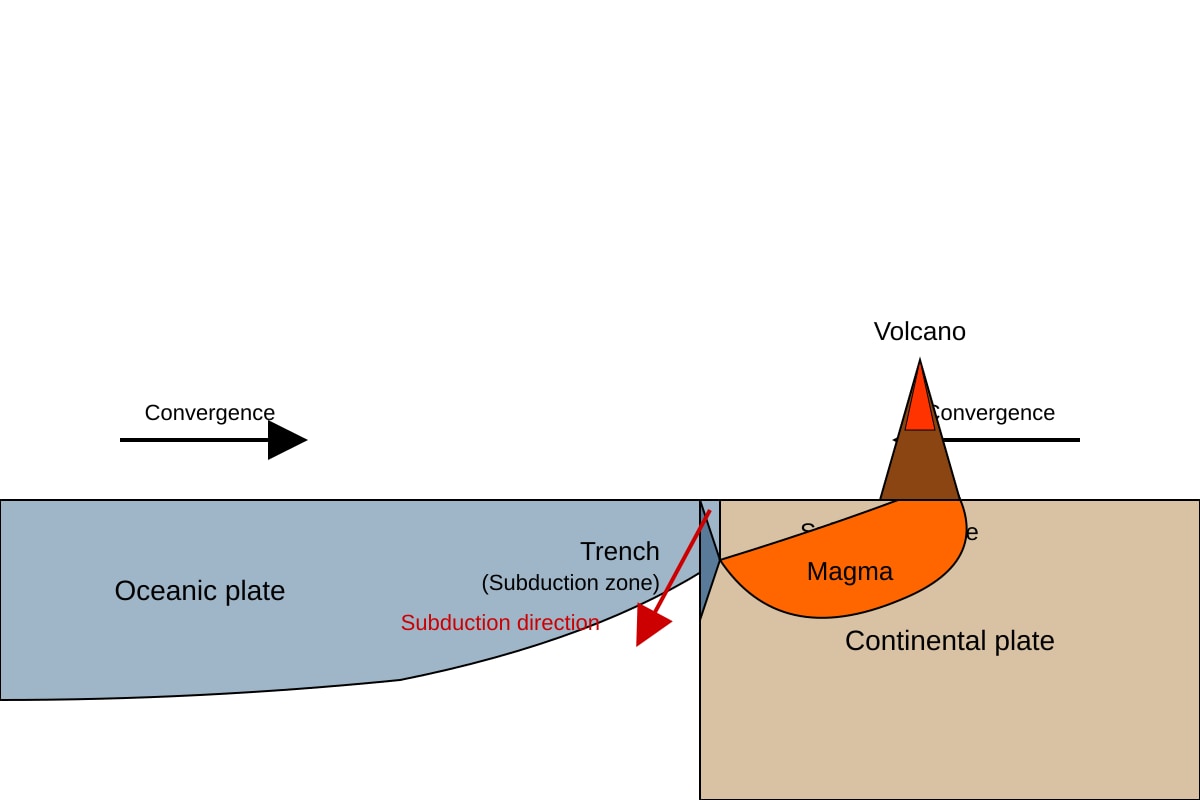
13. [2] Convergent (destructive) boundary; landform: volcano / trench.
Teaching: Subduction melts plate → magma rises → volcano.
14. [2] Temperate (e.g., temperate continental); reason: large annual range (2→18°C = 16°C).
Teaching: Equatorial <5°C range; temperate shows seasonality.
Section C: Extended Structured Response (15–20)
15. [4] Convectional rainfall: (1) Intense solar heating of ground [1]; (2) Warm air rises, expands, cools adiabatically [1]; (3) At condensation level clouds form [1]; (4) Heavy afternoon convectional storms common [1].
Teaching: Equatorial latitudes receive high insolation; unstable air.
16. [4] Factors: (1) Greenhouse gas emissions from fossil fuels [2: example + link]; (2) Deforestation reduces CO₂ sink [2].
Marking descriptors: 2 marks each with mechanism stated.
17. [4] Process: (1) Hydraulic action compresses air in cracks, breaking rock [2]; (2) Abrasion by load scrapes cliff, enlarges arch [1]; (3) Continued erosion isolates stack [1].
Teaching: Stack = remnant after arch collapse.
18. [4] Named volcano (e.g., Mt Pinatubo 1991): Primary – ash, lava, pyroclastic flows [2]; Secondary – lahars, crop loss, climate cooling [2].
Marking: 2+2 for correct classification with example.
19. [4] Developed: better building codes → fewer deaths [2]; Developing: poor infrastructure → more casualties, slower aid [2].
Teaching: Capacity links to GDP, governance.
20. [4] Impacts: (1) Sea level rise → flooding of low islands [1+1]; (2) Stronger storms → erosion [1]; (3) Saltwater intrusion → agriculture loss [1].
Marking: 4 points with SEA context (e.g., Jakarta, Mekong Delta).