AI Generated Quiz
Secondary 4 Geography Map Graph Data Skills Quiz
Free Sec 4 Geography Map Graph Data Skills quiz, HY3 AI version, with questions, answers, and O Level-style practice for Singapore students.
These static practice materials are generated from the site's syllabus and paper-generation workflow, with source and model context shown so students and parents can evaluate the material before use.
Questions
Secondary 4 Geography Quiz - Map Graph Data Skills
Name: ___________________________
Class: ______________
Date: ______________
Score: _______ / 40
Duration: 50 minutes
Total Marks: 40
Instructions:
- This quiz tests your map, graph, and data skills based on the Secondary 4 Geography syllabus.
- Answer all 20 questions. Section A: 1–7 (short data/map tasks). Section B: 8–14 (graph and chart work). Section C: 15–20 (interpretation and application).
- Use the provided tables, figures, and image placeholders to answer. Show workings where required.
- Marks for each question are shown in brackets.
Section A: Map and Table Basics (Questions 1–7)
1. Study the table below showing visitor arrivals to a local nature park by region.
| Region | Visitors (000) |
|---|---|
| North | 12 |
| East | 8 |
| South | 15 |
| West | 5 |
What is the total number of visitors in thousands? [1]
2. Using the table in Q1, which region had the highest number of visitors? [1]
3. A student drew a bar chart but forgot the title. What title should be written on the chart? [1]
4. Study the map description: A map shows a coastal town with a national park shaded in green on the eastern side and a built-up area in grey on the west. With reference to the description, name one land-use zone shown. [1]
5. The table below shows temperature (°C) for five months.
| Month | Jan | Feb | Mar | Apr | May |
|---|---|---|---|---|---|
| Temp | 27 | 28 | 29 | 30 | 29 |
What is the mean temperature? [2]
6. A proportional symbol map uses circle size to show tourist spending. If Country A has spending 20billionandCountryB10 billion, which circle is larger and why? [1]
7. Study the extract: "The river flows from north to south and joins the sea at Point X." On a map, which direction arrow would you draw for the river? [1]
Section B: Graphs and Charts (Questions 8–14)
8. Study the data below for types of tourist transport.
| Transport | % |
|---|---|
| Air | 50 |
| Rail | 30 |
| Road | 20 |
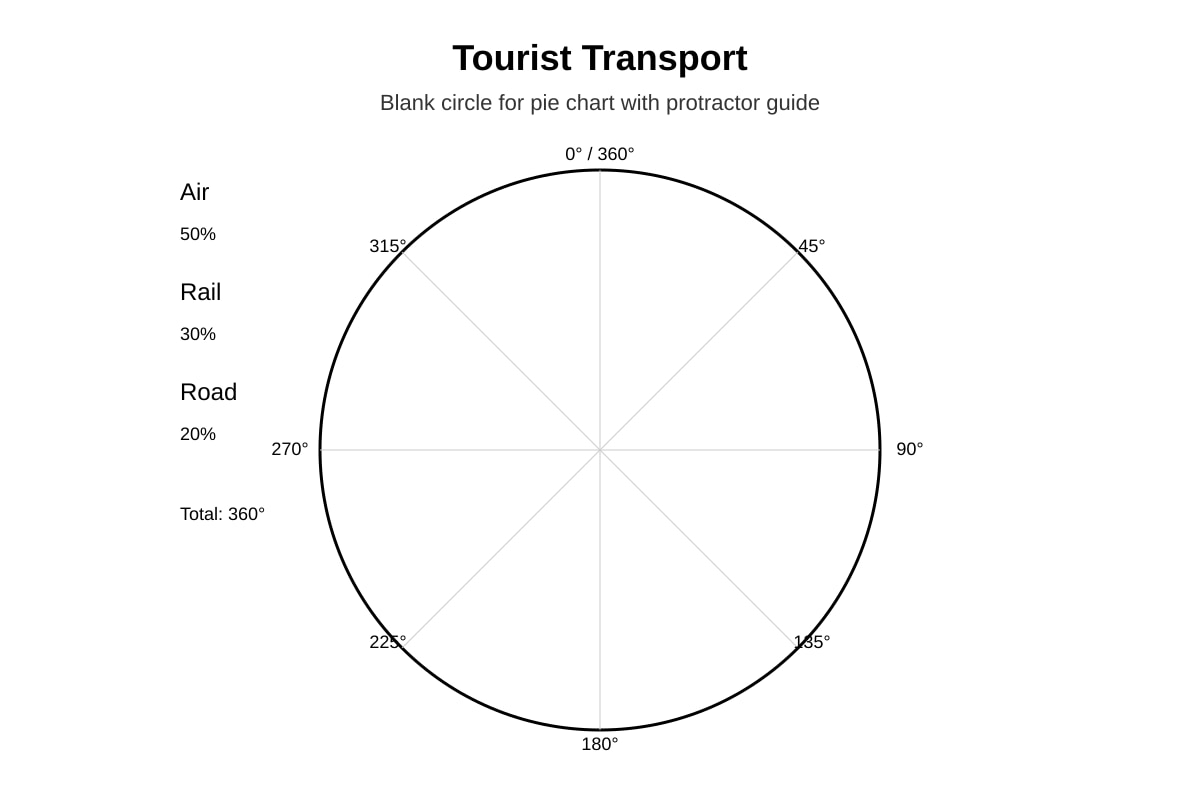
Plot a pie chart to represent the data. Calculate the angle for Air. [3]
Image pending generation: chart for Q8.
Angle for Air = ________ °
Pie chart: [attach drawn chart]
9. Using the pie chart data in Q8, what is the angle for Rail? [1]
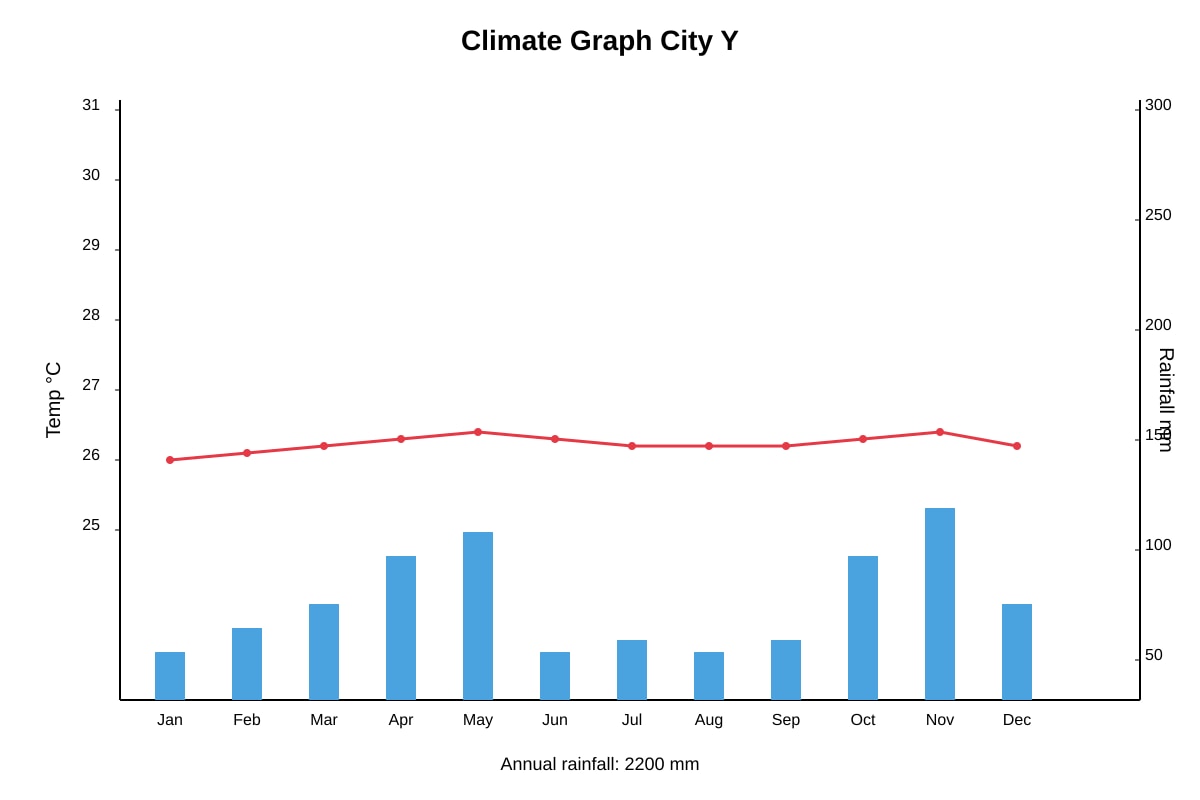
10. Study Figure 1, a climate graph for City Y.
Image pending generation: graph for Q10.
Describe the temperature pattern shown. [2]
11. With reference to Figure 1 (Q10), describe the rainfall pattern. [2]
12. Study the table of coastal wave data.
| Wave type | Height (m) | Swash vs Backwash |
|---|---|---|
| A | 3.0 | Backwash stronger |
| B | 1.0 | Swash stronger |
Classify Wave A as destructive or constructive. [1]
13. Explain your answer to Q12 using evidence from the table. [2]
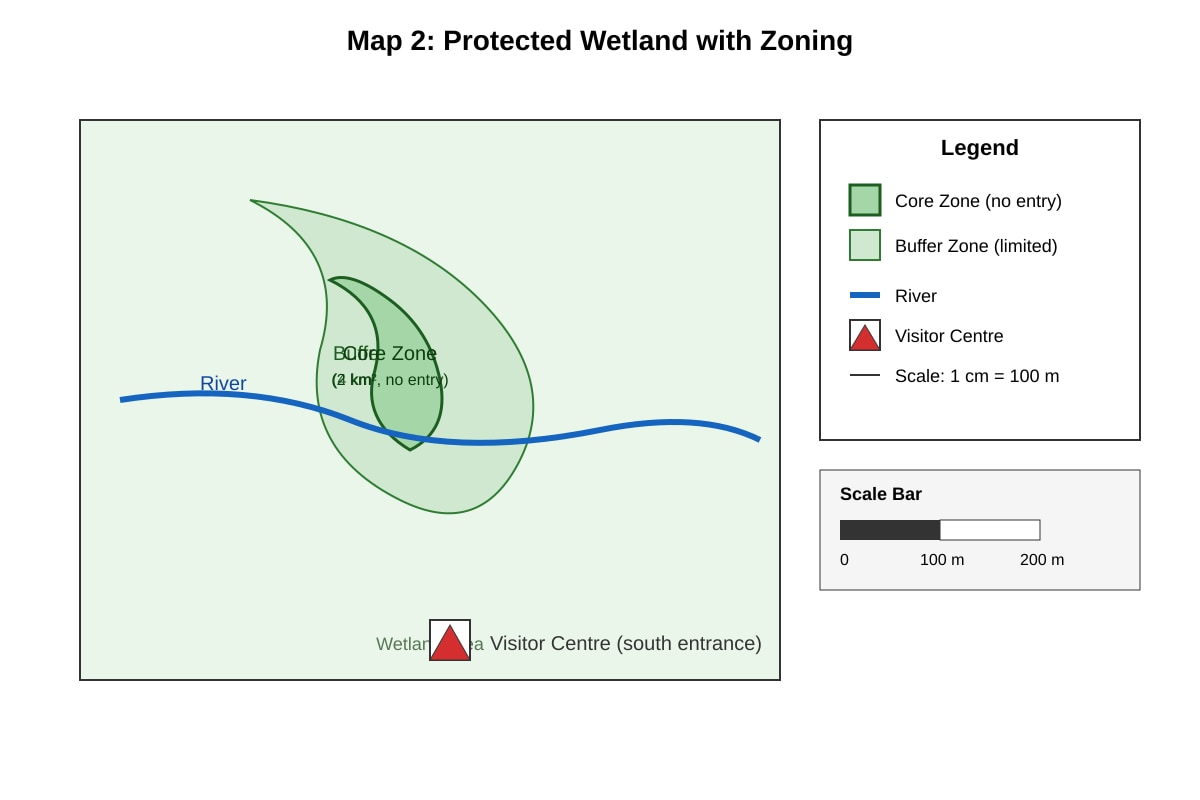
14. Study Map 2 showing a protected wetland with zoning.
Image pending generation: map for Q14.
With reference to Map 2, name one feature that helps conserve the wetland. [1]
Section C: Interpretation and Application (Questions 15–20)
15. Study Table 3 showing tourist arrivals to Singapore (millions).
| Year | 2015 | 2016 | 2017 | 2018 | 2019 |
|---|---|---|---|---|---|
| Arrivals | 15.2 | 16.4 | 17.4 | 18.5 | 19.1 |
With reference to the table, explain the trend in tourist arrivals. [2]
16. Suggest one reason for the trend in Q15. [1]
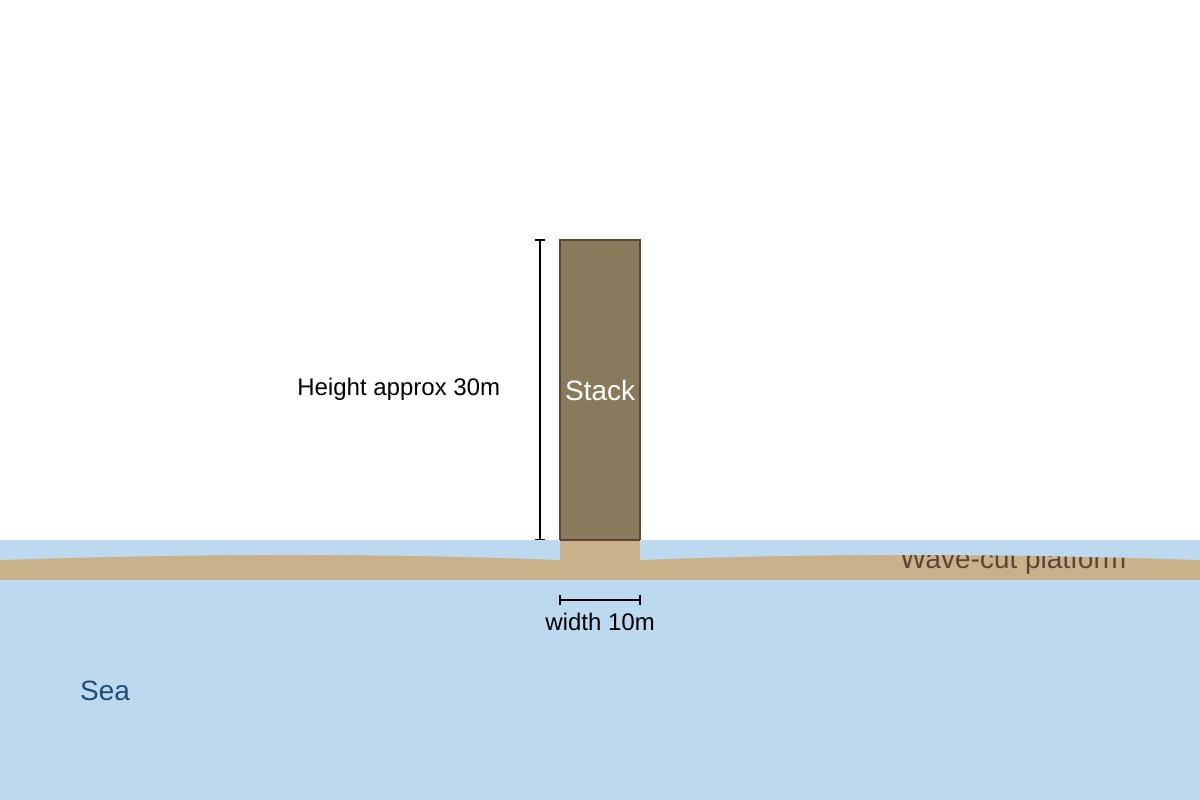
17. Study Photograph A of a coastal stack.
Image pending generation: figure for Q17.
Describe two features of the stack visible in Photograph A. [2]
18. Account for the formation of the stack in Q17. [3]
19. A student investigated litter at East Coast Park using systematic sampling every 50m. Describe one advantage of this sampling method. [2]
20. Study the incomplete choropleth map description: Regions rated 1 (low) to 5 (high) for tourism impact. Complete the key by stating what shade density 5 represents. [1]
Answers
Secondary 4 Geography Quiz - Answer Key
Topic: Map Graph Data Skills
Level: Secondary 4
Total Marks: 40
Section A Answers (1–7)
Q1 [1 mark]
Total = 12 + 8 + 15 + 5 = 40 (thousand).
Teaching note: Add all column values. Answer: 40.
Q2 [1 mark]
South (15 thousand).
Teaching note: Highest bar/value in table.
Q3 [1 mark]
"Visitor Arrivals to Nature Park by Region" (or similar).
Teaching note: Title must state what data shows.
Q4 [1 mark]
National park (green eastern side) OR built-up area (grey west).
Teaching note: Land-use zones from description.
Q5 [2 marks]
Mean = (27+28+29+30+29) ÷ 5 = 143 ÷ 5 = 28.6°C.
Marking: 1 for sum, 1 for division/answer.
Teaching note: Mean = total ÷ count.
Q6 [1 mark]
Country A (larger) because 20bn>10bn; proportional symbols scale with value.
Teaching note: Bigger symbol = bigger value.
Q7 [1 mark]
Arrow pointing south (from north to south).
Teaching note: River flows N→S, arrow shows direction.
Section B Answers (8–14)
Q8 [3 marks]
Angle Air = (50/100) × 360° = 180°.
Pie: Air 180°, Rail 108°, Road 72°. Title + sectors.
Marking: 1 calc, 1 plot, 1 title/legend.
Teaching note: % × 3.6 = angle.
Q9 [1 mark]
Rail angle = (30/100) × 360 = 108°.
Teaching note: Same method as Q8.
Q10 [2 marks]
Temp high 26–31°C all year, little variation.
Marking: 1 range, 1 steady.
Teaching note: Read line on graph.
Q11 [2 marks]
Rainfall two peaks (Apr–May, Oct–Nov), low Jun–Sep, annual 2200mm.
Marking: 1 peaks, 1 low/ total.
Teaching note: Read bars.
Q12 [1 mark]
Destructive.
Teaching note: Backwash stronger = destructive.
Q13 [2 marks]
Wave A height 3.0m (high), backwash stronger than swash → erodes coast = destructive.
Marking: 1 height, 1 backwash evidence.
Teaching note: Link table to type.
Q14 [1 mark]
Core Zone (no entry) OR Visitor Centre (managed access).
Teaching note: Map feature aids conservation.
Section C Answers (15–20)
Q15 [2 marks]
Arrivals rose from 15.2m (2015) to 19.1m (2019), steady yearly increase (~25% growth).
Marking: 1 start/end, 1 trend.
Teaching note: Describe with numbers.
Q16 [1 mark]
Better air links / attractions (e.g., Gardens by Bay).
Teaching note: Reason matches trend.
Q17 [2 marks]
Isolated rock column; wave-cut platform at base.
Marking: 1 each.
Teaching note: Photo shows features.
Q18 [3 marks]
Headland eroded by hydraulic action/abrasion → arch forms → roof collapses → stack left.
Marking: 1 erosion, 1 arch, 1 collapse.
Teaching note: Process sequence.
Q19 [2 marks]
Covers area evenly; reduces bias vs random.
Marking: 1 even, 1 bias.
Teaching note: Systematic = fixed interval.
Q20 [1 mark]
Highest impact (5 = darkest shade).
Teaching note: Choropleth: high = dark.
Free quiz and exam paper access
Enter your details to view this paper
Your access is remembered on this device.