AI Generated Quiz
Secondary 4 Geography Map Graph Data Skills Quiz
Free Sec 4 Geography Map Graph Data Skills quiz, Claude AI version, with questions, answers, and O Level-style practice for Singapore students.
These static practice materials are generated from the site's syllabus and paper-generation workflow, with source and model context shown so students and parents can evaluate the material before use.
Questions
Secondary 4 Geography Quiz - Map Graph Data Skills
Name: _________________ Class: _________ Date: _____________
Score: _____ / 50 Duration: 45 minutes
Instructions:
- Answer all questions in the spaces provided
- Use examples where appropriate
- Show your working for calculations
- Refer to figures and data when specified
Section A: Data Interpretation [20 marks]
Question 1 [3 marks]
Study Figure 1, which shows tourist arrivals to Southeast Asian countries in 2019.
| Country | Tourist Arrivals (millions) |
|---|---|
| Thailand | 39.8 |
| Malaysia | 26.1 |
| Singapore | 19.1 |
| Indonesia | 16.1 |
| Philippines | 8.3 |
(a) Calculate the percentage of total tourist arrivals that Singapore received. Show your working.
Working: _________________________________________________
Answer: ________%
(b) Suggest two reasons why Thailand receives the highest number of tourist arrivals in the region. [2 marks]
Reason 1: _______________________________________________
Reason 2: _______________________________________________
Question 2 [4 marks]
Study Figure 2, which shows the climate graph for Kuala Lumpur, Malaysia.
[Climate graph showing temperature line (26-28°C year-round) and rainfall bars with peaks in April-May (250mm) and October-November (280mm), lowest in June-July (120mm)]
(a) Describe the temperature pattern shown in the graph. [1 mark]
(b) Identify the two wettest months and their approximate rainfall amounts. [2 marks]
Month 1: _____________ Rainfall: _________mm
Month 2: _____________ Rainfall: _________mm
(c) Explain why Kuala Lumpur experiences this rainfall pattern. [1 mark]
Question 3 [5 marks]
A student conducted a survey on beach pollution at East Coast Park. The data collected is shown in the table below.
| Litter Type | Count per 100m² |
|---|---|
| Plastic bottles | 12 |
| Food wrappers | 18 |
| Cigarette butts | 25 |
| Glass bottles | 3 |
| Other | 7 |
(a) Complete the pie chart below to represent this data. [3 marks]
[Circle provided for pie chart construction]
(b) State the most common type of litter found. [1 mark]
(c) Suggest one method the student could use to make the data collection more reliable. [1 mark]
Question 4 [8 marks]
Study Figure 3, which shows a photograph of a coastal landform.
[Photograph showing a rocky headland with caves, arches, and offshore stacks]
(a) Name the coastal landform shown in the photograph. [1 mark]
(b) Describe three features visible in the photograph. [3 marks]
Feature 1: ___________________________________________
Feature 2: ___________________________________________
Feature 3: ___________________________________________
(c) Explain how wave erosion has created the features shown in the photograph. [4 marks]
Section B: Map Skills [15 marks]
Question 5 [6 marks]
Study Map 1, which shows part of Singapore's nature reserves and parks.
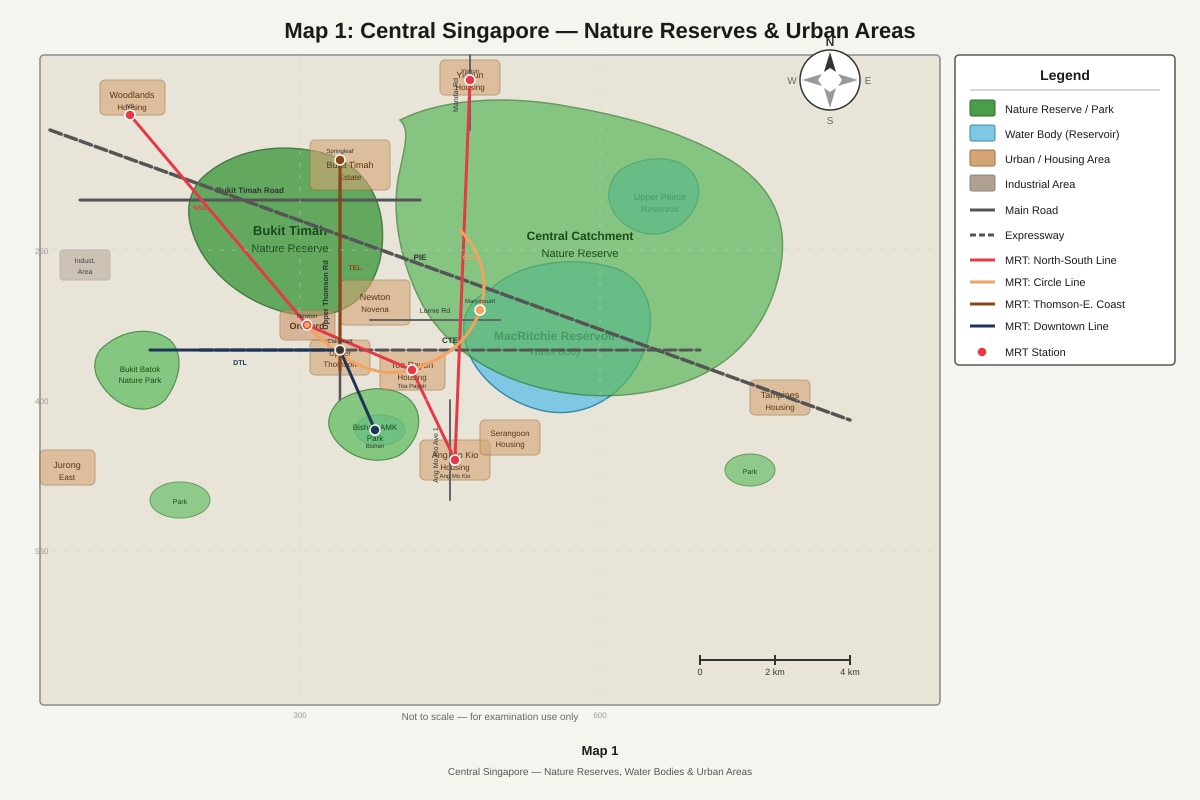
Generated map for this question.
(a) Using the map, identify two ways that urban development might threaten the nature reserves. [2 marks]
Threat 1: ____________________________________________
Threat 2: ____________________________________________
(b) Explain how the location of MacRitchie Reservoir helps Singapore's water security. [2 marks]
(c) Suggest why MRT lines are built around rather than through the nature reserves. [2 marks]
Question 6 [9 marks]
Study Map 2, which shows earthquake epicenters and plate boundaries in Southeast Asia.
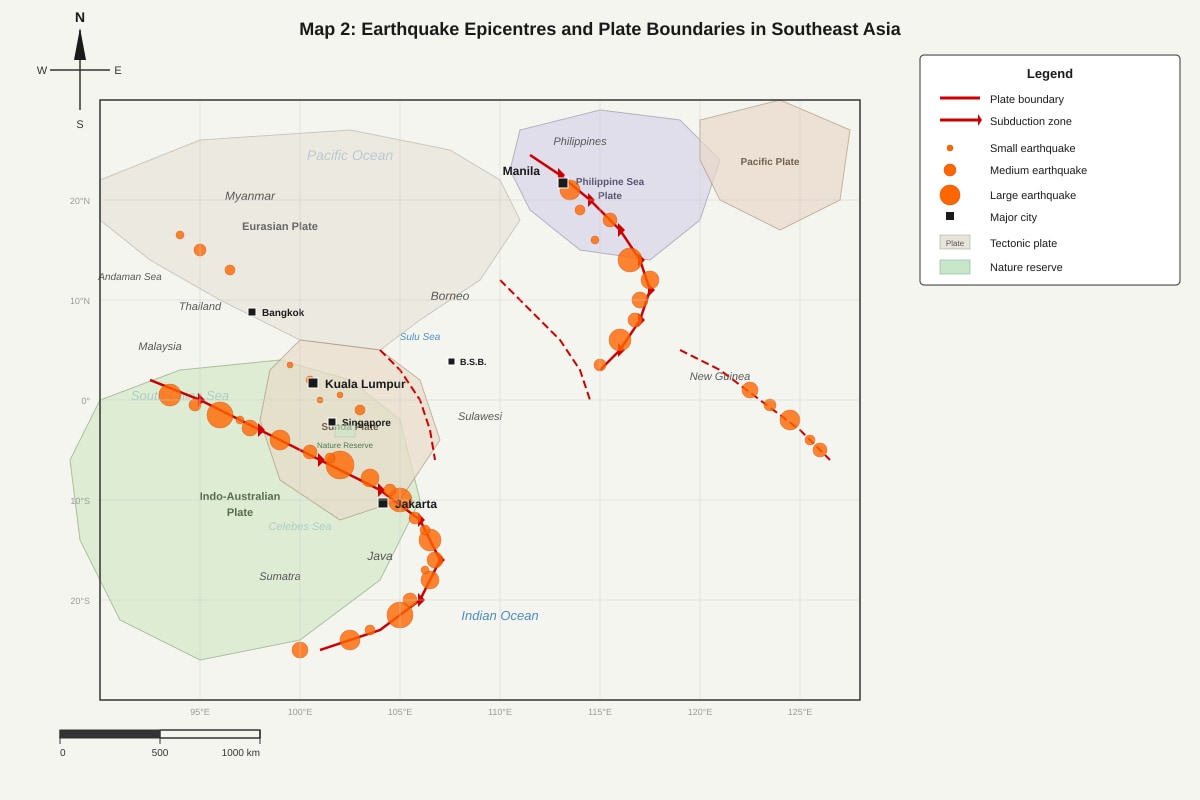
Generated map for this question.
(a) Describe the relationship between earthquake locations and plate boundaries shown on the map. [2 marks]
(b) Using evidence from the map, explain why Indonesia experiences more earthquakes than Malaysia. [3 marks]
(c) A magnitude 7.5 earthquake occurs near Jakarta. Predict the likely impacts on the city and explain your reasoning. [4 marks]
Predicted impacts: ___________________________________
Reasoning: __________________________________________
Section C: Fieldwork Application [15 marks]
Question 7 [8 marks]
A geography student wants to investigate the environmental impacts of tourism on Sentosa Island.
(a) State a suitable research question for this investigation. [1 mark]
(b) Describe a suitable sampling method the student could use to collect data across the island. [2 marks]
(c) Identify two types of primary data the student should collect and explain why each would be useful. [4 marks]
Data type 1: _________________________________________
Why useful: _________________________________________
Data type 2: _________________________________________
Why useful: _________________________________________
(d) State one limitation of this fieldwork method. [1 mark]
Question 8 [7 marks]
Study Figure 4, which shows the results of a questionnaire survey about public transport use in Singapore.
| Age Group | Daily MRT Users (%) | Prefer Car (%) | Use Bus Only (%) |
|---|---|---|---|
| 18-25 | 65 | 15 | 20 |
| 26-40 | 45 | 35 | 20 |
| 41-60 | 30 | 50 | 20 |
| Over 60 | 25 | 25 | 50 |
(a) Describe the trend in MRT usage across different age groups. [2 marks]
(b) Suggest two reasons why older people (over 60) prefer buses over MRT. [2 marks]
Reason 1: ___________________________________________
Reason 2: ___________________________________________
(c) Evaluate the reliability of this survey data. Consider both strengths and limitations. [3 marks]
Strengths: __________________________________________
Limitations: ________________________________________
Answers
Secondary 4 Geography Quiz - Map Graph Data Skills (Answer Key)
Section A: Data Interpretation [20 marks]
Question 1 [3 marks]
(a) Calculate the percentage of total tourist arrivals that Singapore received. [1 mark]
Working: Total arrivals = 39.8 + 26.1 + 19.1 + 16.1 + 8.3 = 109.4 million Singapore percentage = (19.1 ÷ 109.4) × 100 = 17.5%
Answer: 17.5% (Accept 17-18%)
(b) Suggest two reasons why Thailand receives the highest number of tourist arrivals. [2 marks]
Sample answers (any 2):
- Diverse tourist attractions (beaches, temples, cities, mountains)
- Well-developed tourism infrastructure and facilities
- Competitive pricing/good value for money
- Strong international marketing and promotion
- Cultural attractions and heritage sites
- Variety of tourism types (adventure, cultural, beach, medical)
- Good air connectivity and accessibility
Marking: 1 mark per valid reason with explanation
Question 2 [4 marks]
(a) Describe the temperature pattern shown in the graph. [1 mark]
Answer: Temperature remains consistently high throughout the year (26-28°C) with minimal seasonal variation.
Marking: 1 mark for noting high temperatures with little variation
(b) Identify the two wettest months and their approximate rainfall amounts. [2 marks]
Answer: Month 1: October/November, Rainfall: 280mm Month 2: April/May, Rainfall: 250mm
Marking: 1 mark for each correct month-rainfall pair (±20mm tolerance)
(c) Explain why Kuala Lumpur experiences this rainfall pattern. [1 mark]
Answer: Influenced by monsoon seasons - southwest monsoon brings rain in April-May, northeast monsoon brings rain in October-November.
Marking: 1 mark for mentioning monsoon influence or ITCZ movement
Question 3 [5 marks]
(a) Complete the pie chart to represent this data. [3 marks]
Calculations:
- Total count = 65 items
- Plastic bottles: (12/65) × 360° = 66°
- Food wrappers: (18/65) × 360° = 100°
- Cigarette butts: (25/65) × 360° = 138°
- Glass bottles: (3/65) × 360° = 17°
- Other: (7/65) × 360° = 39°
Marking:
- 1 mark for correct angle calculations
- 1 mark for accurate plotting (±5° tolerance)
- 1 mark for labels and title
(b) State the most common type of litter found. [1 mark]
Answer: Cigarette butts
(c) Suggest one method to make data collection more reliable. [1 mark]
Sample answers:
- Repeat the survey multiple times
- Use multiple survey locations
- Standardize the survey area size
- Survey at different times/days
- Use multiple surveyors for comparison
Question 4 [8 marks]
(a) Name the coastal landform shown. [1 mark]
Answer: Headland/Rocky headland/Cliff
(b) Describe three features visible in the photograph. [3 marks]
Sample answers (any 3):
- Steep rocky cliffs
- Sea caves at the base of cliffs
- Natural arches formed in the rock
- Offshore stacks/rock pillars
- Wave-cut platforms
- Layered rock structure/bedding planes
Marking: 1 mark per accurate feature description
(c) Explain how wave erosion has created these features. [4 marks]
Sample answer: Hydraulic action occurs when waves crash against the cliff, compressing air in cracks and creating pressure when waves retreat. Abrasion happens as waves hurl rocks and sand against the cliff face. These processes exploit weaknesses like joints and bedding planes in the rock. Over time, caves are enlarged and may break through to form arches. When arches collapse, isolated stacks remain offshore.
Marking scheme:
- 1 mark for hydraulic action explanation
- 1 mark for abrasion explanation
- 1 mark for mentioning rock weaknesses (joints/bedding planes)
- 1 mark for sequence of landform development (caves→arches→stacks)
Section B: Map Skills [15 marks]
Question 5 [6 marks]
(a) Identify two threats from urban development. [2 marks]
Sample answers:
- Road construction fragments habitats
- Urban expansion reduces reserve size
- Pollution from traffic and buildings
- Noise pollution disturbs wildlife
- Light pollution affects nocturnal species
- Increased human access and disturbance
Marking: 1 mark per valid threat identified from map evidence
(b) Explain how MacRitchie Reservoir location helps water security. [2 marks]
Sample answer: Located in forested catchment area which provides clean water supply. Central location allows efficient distribution across Singapore. Protected by nature reserve status preventing contamination from development.
Marking: 1 mark for catchment function, 1 mark for strategic location/protection
(c) Suggest why MRT lines avoid nature reserves. [2 marks]
Sample answer: Construction would damage sensitive ecosystems and wildlife habitats. Government policy protects nature reserves from development. Alternative routes around reserves minimize environmental impact while still providing transport access.
Marking: 1 mark for environmental protection, 1 mark for policy/planning consideration
Question 6 [9 marks]
(a) Describe relationship between earthquakes and plate boundaries. [2 marks]
Answer: Most earthquakes occur along or near plate boundaries. Earthquake frequency and magnitude appear higher near active plate boundaries, particularly where oceanic and continental plates meet.
Marking: 1 mark for spatial relationship, 1 mark for noting concentration along boundaries
(b) Explain why Indonesia has more earthquakes than Malaysia. [3 marks]
Sample answer: Indonesia is located directly on active plate boundaries where Indo-Australian, Eurasian, and Pacific plates meet. Malaysia is located further from major plate boundaries on the relatively stable Eurasian plate. Indonesia sits on the "Ring of Fire" with high tectonic activity, while Malaysia experiences fewer and weaker earthquakes due to its more stable geological position.
Marking: 1 mark each for Indonesia's location on plate boundaries, Malaysia's stable position, and reference to tectonic activity levels
(c) Predict impacts of magnitude 7.5 earthquake near Jakarta. [4 marks]
Predicted impacts:
- Building collapse, especially older/poorly constructed structures
- Casualties from falling debris and building collapse
- Infrastructure damage (roads, bridges, utilities)
- Economic disruption and business closure
- Secondary hazards like fires and landslides
Reasoning: Jakarta has high population density and many buildings not designed for major earthquakes. Soft sediments in coastal areas may amplify shaking. Limited earthquake preparedness compared to countries like Japan.
Marking: 2 marks for realistic impact predictions, 2 marks for sound reasoning based on Jakarta's characteristics
Section C: Fieldwork Application [15 marks]
Question 7 [8 marks]
(a) Suitable research question. [1 mark]
Sample answers:
- "How does tourism affect the environmental quality of Sentosa Island?"
- "What are the environmental impacts of tourism development on Sentosa?"
- "To what extent has tourism damaged the natural environment of Sentosa?"
Marking: 1 mark for clear, focused research question about tourism-environment relationship
(b) Suitable sampling method. [2 marks]
Sample answer: Use systematic sampling along transects from beach areas to inland areas at regular intervals (e.g., every 100m). This ensures representative coverage of different zones with varying tourism intensity.
Marking: 1 mark for systematic/stratified sampling, 1 mark for spatial justification
(c) Two types of primary data and usefulness. [4 marks]
Sample answers:
Data type 1: Environmental quality surveys (noise levels, litter count, vegetation damage) Why useful: Provides quantitative measures of environmental degradation that can be compared between high and low tourism areas.
Data type 2: Tourist behavior observations/questionnaires
Why useful: Identifies specific activities causing environmental impact and tourist awareness of environmental issues.
Marking: 1 mark per data type, 1 mark per explanation (4 total)
(d) One limitation of fieldwork method. [1 mark]
Sample answers:
- Time-consuming to cover large area
- Weather conditions may affect data collection
- Safety concerns in some areas
- Seasonal variations not captured in single survey
- Observer bias in environmental quality assessment
Question 8 [7 marks]
(a) Describe trend in MRT usage across age groups. [2 marks]
Answer: MRT usage decreases with age - highest among 18-25 year olds (65%) and lowest among over 60s (25%). There is a clear inverse relationship between age and MRT usage.
Marking: 1 mark for noting decreasing trend, 1 mark for supporting with data
(b) Two reasons why older people prefer buses. [2 marks]
Sample answers:
- Buses provide door-to-door service with less walking required
- Bus stops are more accessible than MRT stations with stairs/escalators
- Buses offer ground-level boarding (easier for mobility issues)
- More familiar with bus routes and systems
- Bus services reach areas not served by MRT
Marking: 1 mark per valid reason
(c) Evaluate reliability of survey data. [3 marks]
Strengths:
- Large sample size across different age groups
- Clear categories and percentages provided
- Covers main transport modes
Limitations:
- No information about sample size or survey method
- May not represent all areas of Singapore equally
- No indication of survey timing (peak vs off-peak)
- Possible response bias (people may not answer honestly)
Marking: 1 mark for identifying strength, 2 marks for identifying and explaining limitations
Free quiz and exam paper access
Enter your details to view this paper
Your access is remembered on this device.