AI Generated Quiz
Secondary 4 Geography Fieldwork Quiz
Free Sec 4 Geography Fieldwork quiz, HY3 AI version, with questions, answers, and O Level-style practice for Singapore students.
These static practice materials are generated from the site's syllabus and paper-generation workflow, with source and model context shown so students and parents can evaluate the material before use.
Questions

Free quiz and exam paper access
Enter your details to view this paper
Your access is remembered on this device.
Answers
Secondary 4 Geography Quiz - Fieldwork (Answer Key)
Total Marks: 40
Topic: Fieldwork (syllabus-first, Stage 4/5 generated; not claimed as past-year derived)
Section A: Answers 1–8
1. [1] To focus the investigation and guide what data to collect and analyse.
Teaching note: A research question defines the aim. Without it, fieldwork becomes unfocused. Common mistake: confusing research question with hypothesis (a testable statement).
2. [1] Primary data is collected first-hand by the student (e.g., survey); secondary data is collected by others (e.g., government report).
Teaching note: Distinguish source of data. Mark for any valid difference.
3. [1] Singapore Tourism Board annual visitor report / STB website statistics.
Teaching note: Accept any published source (e.g., NEA, SingStat). Must be pre-existing data not gathered by student.
4. [1] Random sampling.
Teaching note: Equal probability is key to random sampling.
5. [1] Dividing population into subgroups (strata) and sampling from each proportionally.
Teaching note: Used when population has clear categories (e.g., age, zone).
6. [1] Can collect views/opinions from many people efficiently.
Teaching note: Other valid: standardised, quantifiable.
7. [1] A line across the study area along which observations are made at intervals.
Teaching note: Transects show spatial change (e.g., beach to inland).
8. [1] Identifies confusing questions before real use / improves reliability.
Teaching note: Pilot test = small trial run.
Section B: Answers 9–15
9. [3] Method: Systematic sampling at every 50 m along the park coastline.
Marks: 1 for method name, 2 for explanation (covers space evenly, easy to repeat).
Teaching note: Systematic sampling is good for linear features like coastlines.
10. [2] Mean = (12 + 5 + 20 + 8) ÷ 4 = 45 ÷ 4 = 11.25 items.
Marks: 1 for sum, 1 for division and answer.
Teaching note: Mean = total ÷ count. Show working for mark.
11. [4] (1) Students draw familiar places showing attachment; (2) Size/Detail of drawn areas shows importance.
Marks: 2 per point with elaboration.
Teaching note: Mental maps reveal perception, not just physical layout.
12. [2] Provides numerical data that can be averaged / compared statistically.
Marks: 1 reason, 1 elaboration.
Teaching note: Likert scale turns opinion into ordinal data.
13. [3] Method: Count pedestrians every 100 m interval using tally counter.
Marks: 1 systematic, 1 interval, 1 tool.
Teaching note: Systematic = fixed interval, not random.
14. [3] Trend: Drop in 2020 (COVID), rise after, 2022 highest at 50k.
Marks: 1 describe drop, 1 recovery, 1 peak. Refer to chart values.
Teaching note: Use data from placeholder: 45→20→30→50.
15. [2] (1) Informed consent; (2) Anonymity.
Marks: 1 each.
Teaching note: Ethics protect respondents.
Section C: Answers 16–20
16. [5] Method: Use systematic or transect sampling at 10 m intervals from MRT; count litter in 5 m² quadrats; record distance; compare density.
Marks: 1 hypothesis link, 1 sampling, 1 quadrat, 1 distance measure, 1 analysis.
Teaching note: Must test stated relationship.
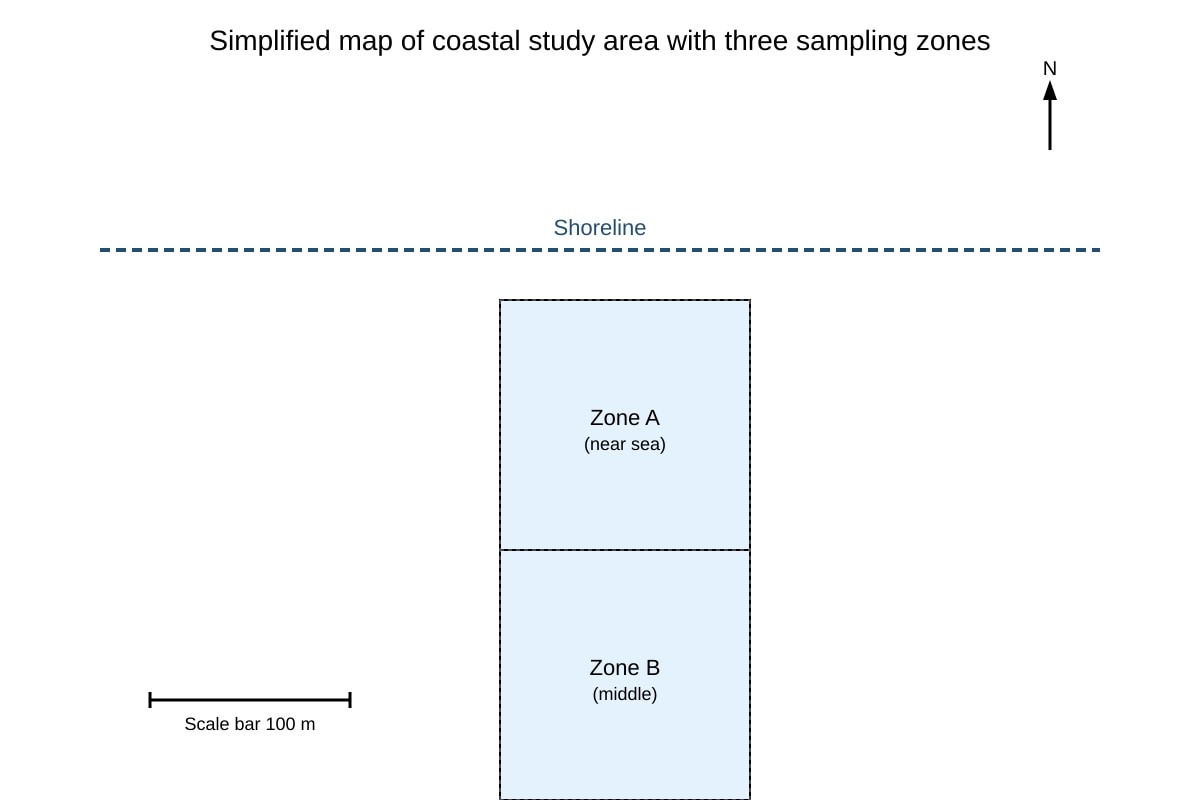
17. [3] Divide area into A/B/C strata; sample equally in each; compare coastal-inland change.
Marks: 1 strata, 1 equal sample, 1 purpose.
Teaching note: Map shows zones for stratification.
18. [2] Data type: Ordinal (categorical ordered). Limitation: vague "rarely" no frequency.
Marks: 1 type, 1 limitation.
Teaching note: Ordinal ≠ interval.
19. [3] Photos show green spaces, litter, infrastructure; e.g., photo of solar panels shows environmental effort.
Marks: 1 use, 2 example.
Teaching note: Visual evidence supports sustainability claims.
20. [4] Difference = 31 – 29 = 2°C. Shows ground warmer (urban heat / microclimate).
Marks: 1 calc, 1 value, 2 explanation.
Teaching note: 2 m warmer = surface heating; microclimate variation.