Secondary 4 Geography Quiz - Physical Geography
Name: ___________________________
Class: ___________
Date: ___________
Score: ___________ / 40
Duration: 60 minutes
Total Marks: 40
Instructions: Answer all 20 questions. Section A is data/diagram interpretation. Section B is structured response. Section C is extended response. Use clear geographical terms. Show workings where required.
Section A: Data and Diagram Interpretation (Questions 1–7)
1. Study the table below showing average global temperature anomaly (°C above 1900 baseline) for selected years.
| Year | Anomaly (°C) |
|---|
| 1980 | 0.30 |
| 1990 | 0.40 |
| 2000 | 0.55 |
| 2010 | 0.70 |
| 2020 | 0.95 |
Describe the trend shown in the table. [2]
2. Using the data in Q1, calculate the percentage increase in temperature anomaly from 1980 to 2020. Show your working. [3]
3.
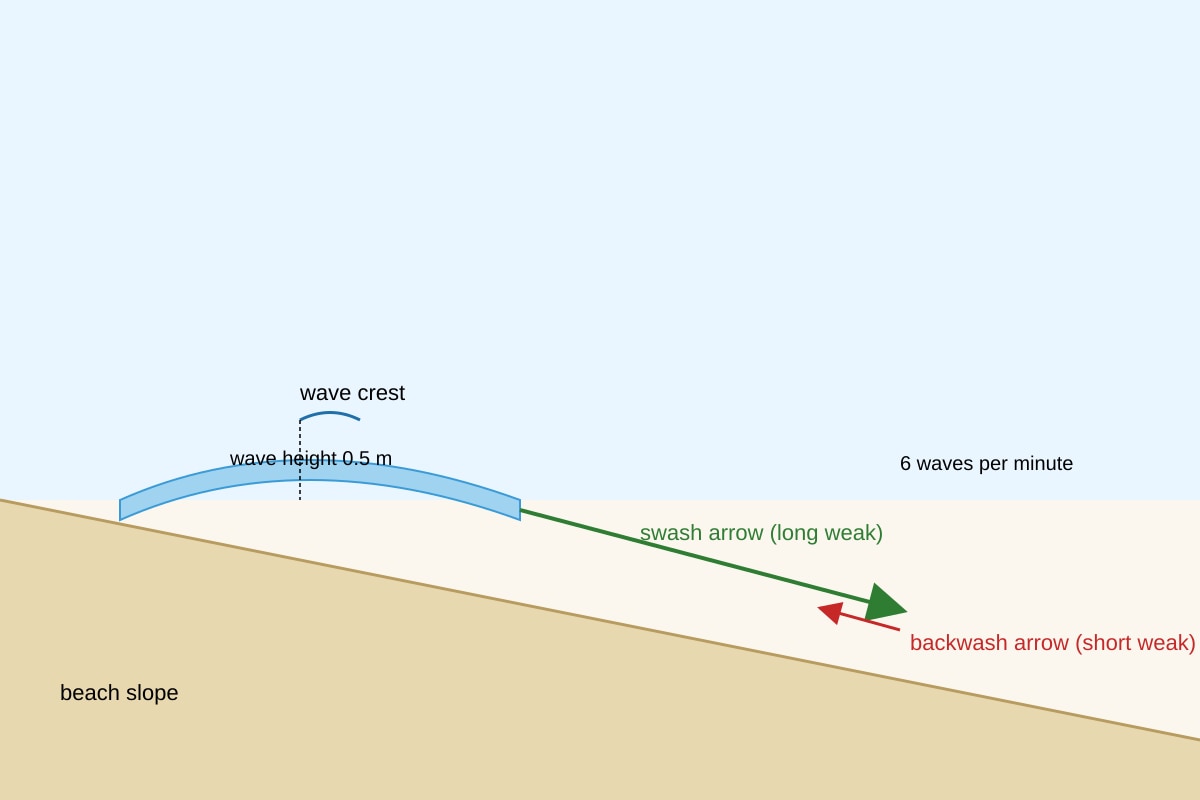
Generated diagram for Q3.
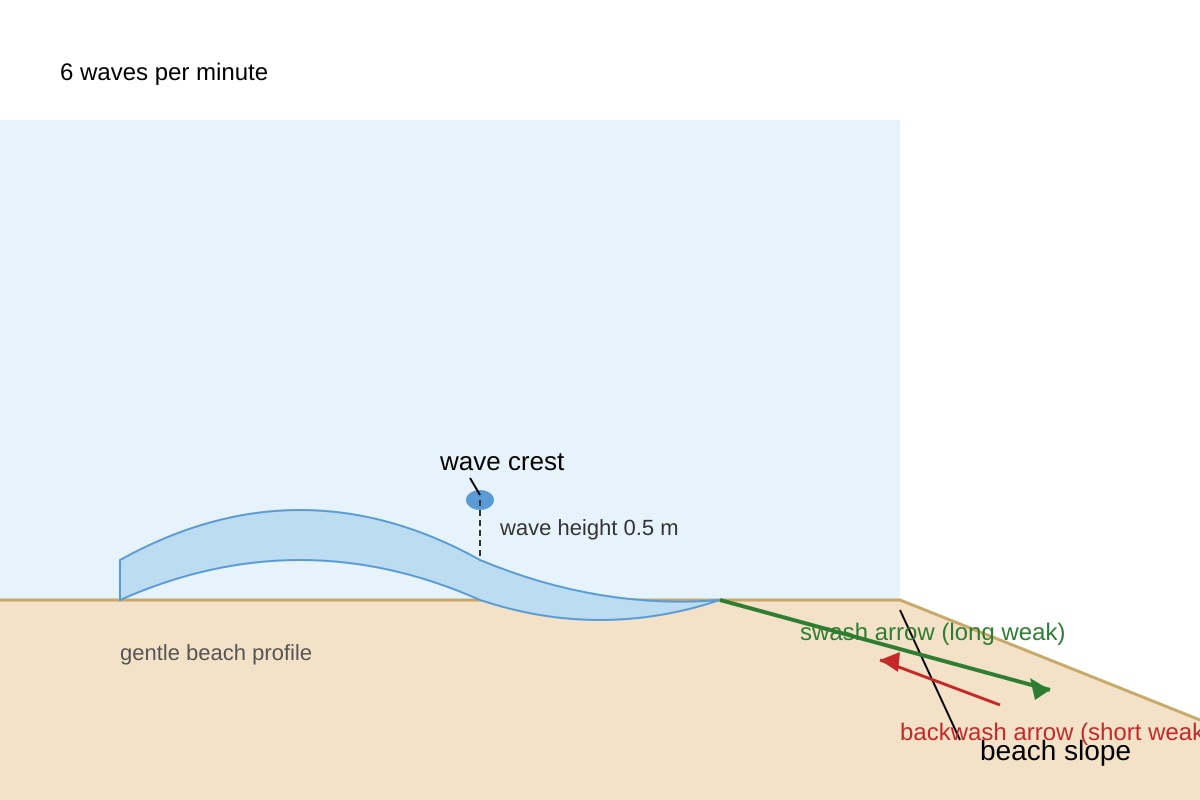
Study Figure Q3-fig1 which shows a wave type. Describe the type of waves associated with the diagram. [3]
4.
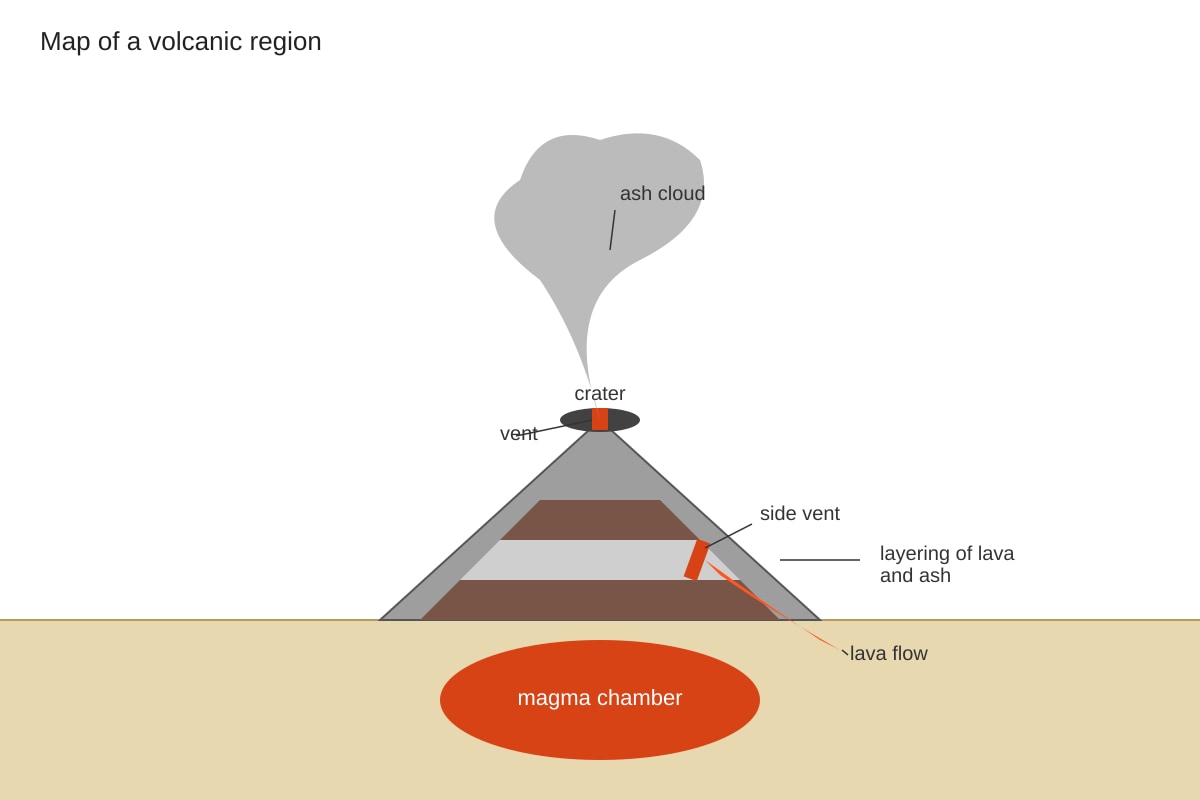
Generated map for Q4.
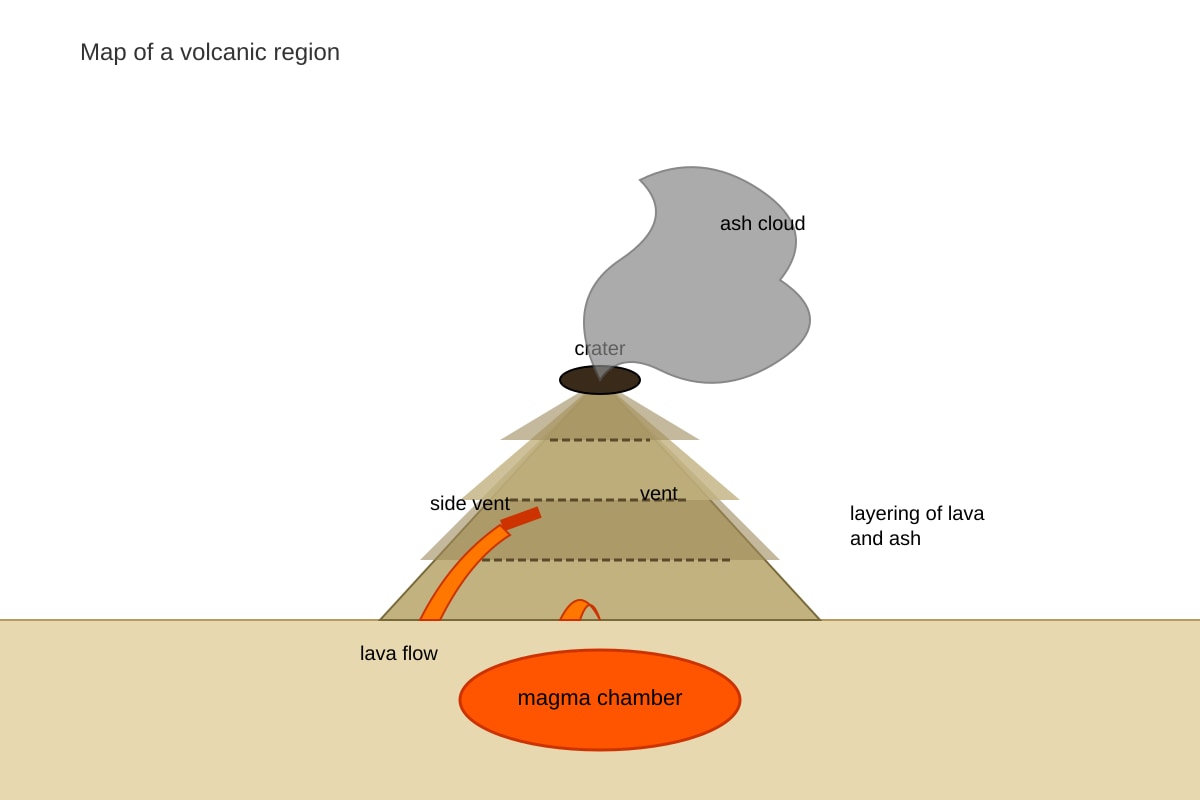
With reference to Map Q4-fig1, name the type of volcano shown and state one feature visible. [2]
5. The pie chart data below shows causes of coastal erosion in a study area: wave action 50%, human activity 30%, rainfall 20%. Plot a pie chart to represent this data. [3]
6.
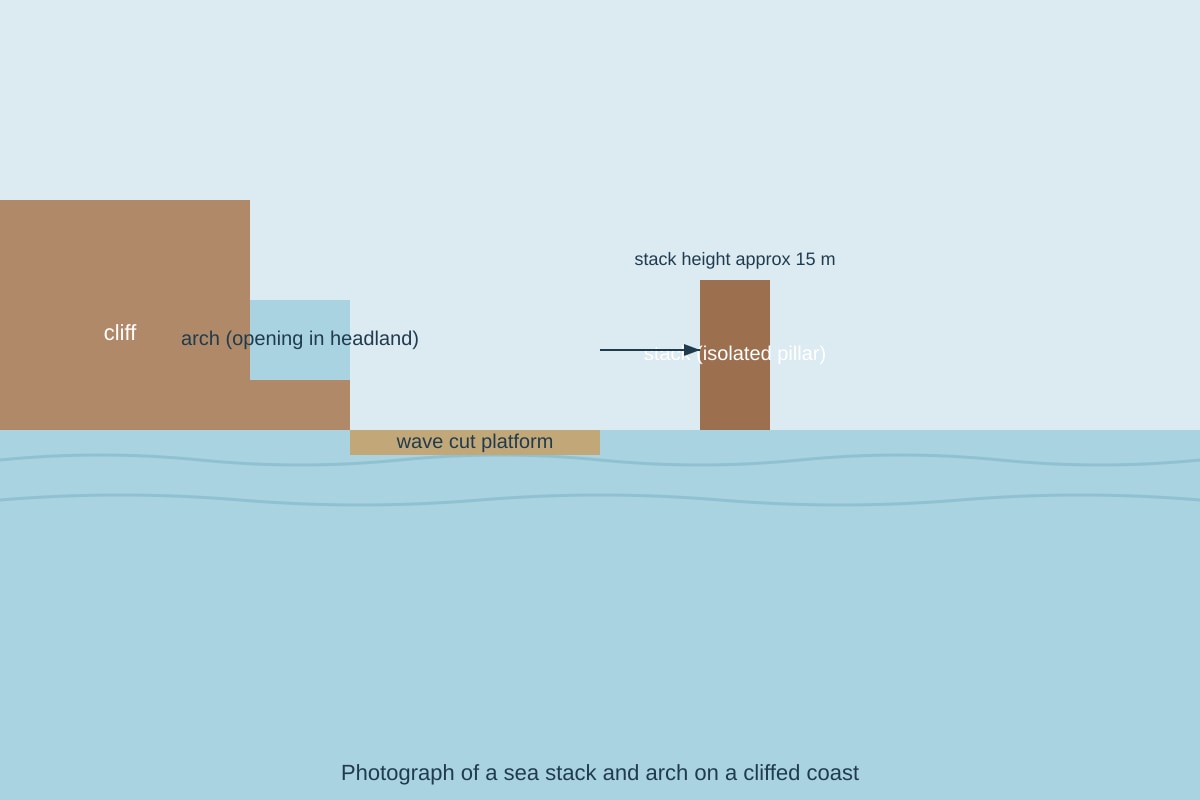
Generated photograph for Q6.
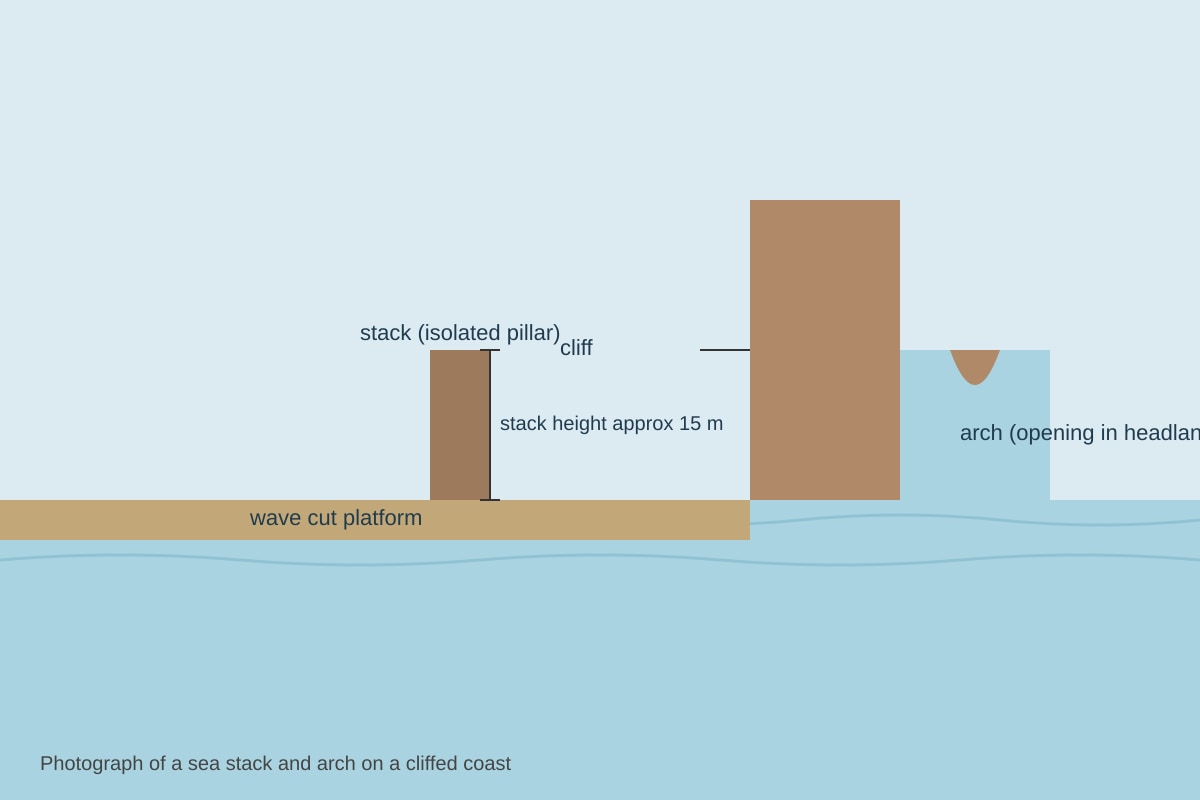
Study Photograph Q6-fig1 showing a coastal landform. Identify the landform and describe two observable features. [3]
7. A student recorded earthquake depths (km) at a plate boundary: 10, 25, 40, 55, 70. Calculate the mean depth. Show working. [2]
Section B: Structured Response (Questions 8–15)
8. Explain how hydraulic action contributes to coastal cliff erosion. [2]
9. State two differences between destructive and constructive waves. [2]
10. Describe how a volcanic hotspot forms a chain of islands, using Hawaii as example context. [3]
11. Explain one cause of global climate change related to the greenhouse effect. [2]
12.
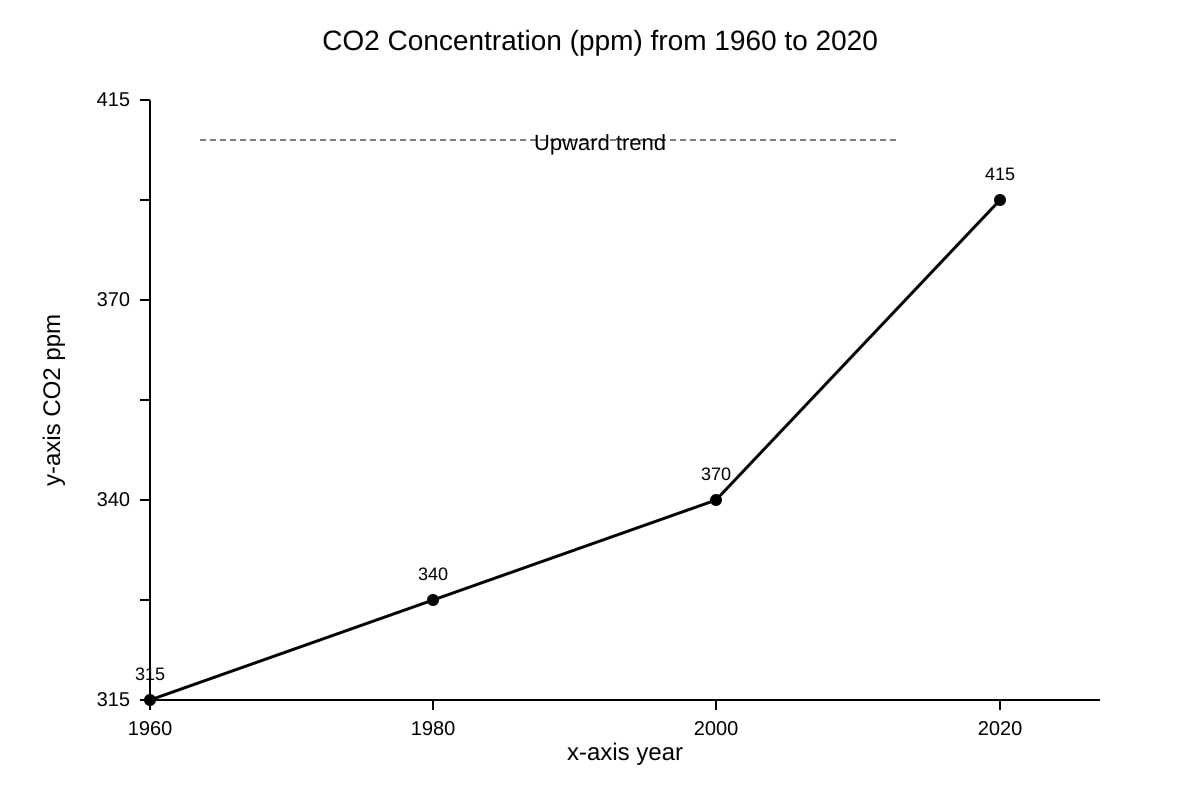
Generated graph for Q12.
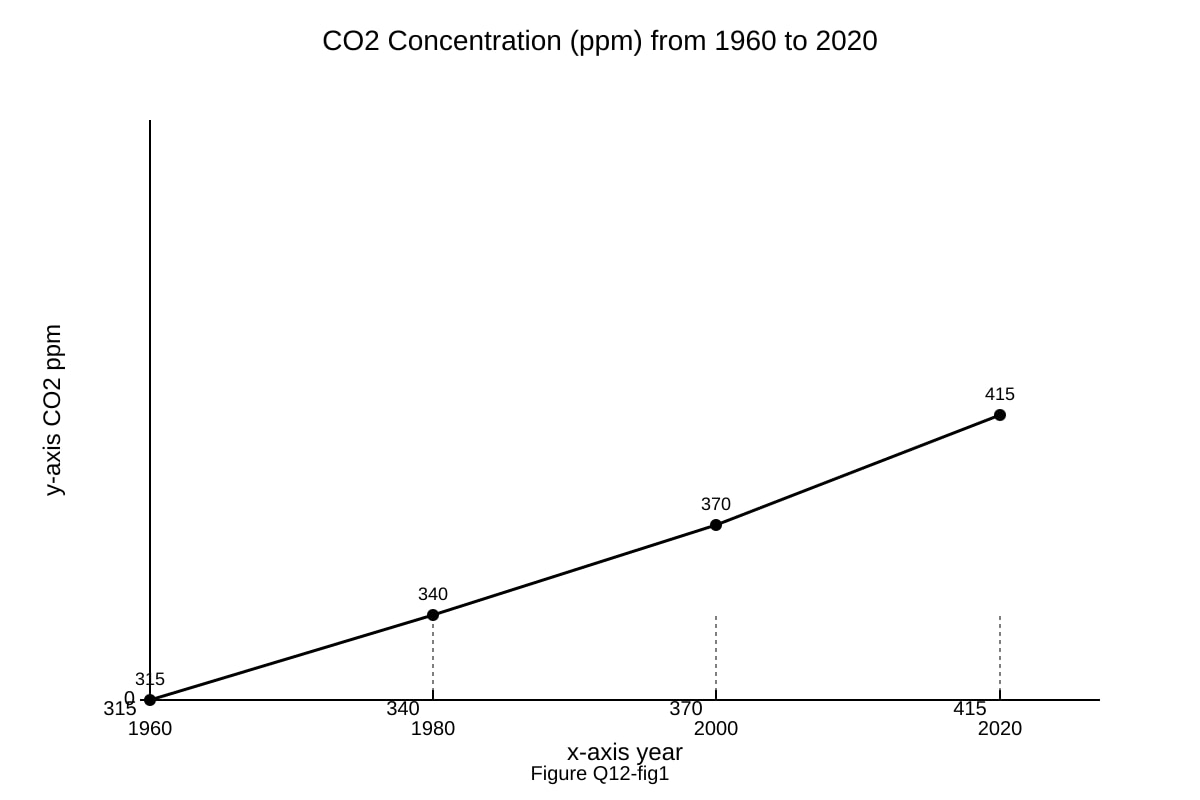
With reference to Figure Q12-fig1, explain the relationship between year and CO2 concentration. [3]
13. Account for the formation of a wave-cut platform. [3]
14. State two impacts of a volcanic eruption on the environment. [2]
15. Explain why tropical storms gain energy over warm ocean water. [3]
Section C: Extended Response (Questions 16–20)
16. "Climate change is mainly caused by natural processes." Do you agree? Explain your answer using evidence. [5]
17. With reference to a named tectonic hazard, explain its causes and how people can reduce its risk. [5]
18. Describe how coastal deposition forms a spit, and explain one human impact on this process. [4]
19. Explain the formation of a composite volcano and why it is more dangerous than a shield volcano. [4]
20. Evaluate the effectiveness of mangrove planting in protecting coastlines from erosion. [4]
</stage3_quiz_answers_md>
Secondary 4 Geography Quiz - Physical Geography (Answer Key)
Total Marks: 40
Section A: Data and Diagram Interpretation
Q1. [2 marks]
Answer: The temperature anomaly increases steadily from 0.30°C in 1980 to 0.95°C in 2020.
Teaching note: Trend description requires stating direction (rising) and using data points.
Marking: 1 mark for "increase/rise", 1 mark for referencing values (e.g., 0.30 to 0.95).
Q2. [3 marks]
Working: % increase = ((2020 value – 1980 value) / 1980 value) × 100
= ((0.95 – 0.30) / 0.30) × 100 = (0.65 / 0.30) × 100 = 216.7%
Answer: 216.7% (approx 217%).
Teaching: Percentage increase formula; shows acceleration of warming.
Marking: 1 mark formula, 1 mark substitution, 1 mark final answer.
Q3. [3 marks]
Answer: Constructive waves. Characteristics: low height (0.5 m), low frequency (6/min), swash stronger/longer than backwash.
Teaching: Constructive waves build beaches; diagram shows gentle slope and long swash.
Marking: 1 mark type, 2 marks for two characteristics from labels.
Q4. [2 marks]
Answer: Composite volcano (stratovolcano). Feature: magma chamber / vent / layered lava and ash / side vent.
Teaching: Composite volcanoes have alternating layers; map shows conical shape.
Marking: 1 mark name, 1 mark feature.
Q5. [3 marks]
Working: Angles: wave 50% = 180°, human 30% = 108°, rain 20% = 72°.
Answer: Pie chart with three slices labelled and titled.
Marking: 1 mark angles, 1 mark plot, 1 mark title/legend.
Q6. [3 marks]
Answer: Landform: sea arch and stack. Features: arch opening in headland, detached stack ~15 m, wave-cut platform.
Teaching: Erosion breaks through headland forming arch, then stack when arch collapses.
Marking: 1 mark identify, 2 marks two features.
Q7. [2 marks]
Working: Mean = (10+25+40+55+70)/5 = 200/5 = 40 km.
Answer: 40 km.
Marking: 1 mark sum, 1 mark divide.
Section B: Structured Response
Q8. [2 marks]
Answer: Hydraulic action is the force of waves compressing air in cracks, breaking rock.
Marking: 1 mark compression, 1 mark weakening/breaking.
Q9. [2 marks]
Answer: Destructive: high, frequent, strong backwash. Constructive: low, less frequent, strong swash. (Any 2 differences)
Marking: 1 mark each.
Q10. [3 marks]
Answer: Hotspot is stationary mantle plume; plate moves over it forming new volcanoes (Hawaii chain ages away from current).
Marking: 1 mark plume, 1 mark plate movement, 1 mark chain example.
Q11. [2 marks]
Answer: Greenhouse gases trap heat (CO2 from burning fossil fuels) increasing temperature.
Marking: 1 mark gas, 1 mark trapping.
Q12. [3 marks]
Answer: CO2 rises from 315 ppm (1960) to 415 ppm (2020); positive correlation with year.
Marking: 1 mark trend, 2 marks values/link.
Q13. [3 marks]
Answer: Waves erode cliff base forming notch, cliff collapses, platform left at low tide.
Marking: 1 mark notch, 1 mark collapse, 1 mark platform.
Q14. [2 marks]
Answer: Ash destroys vegetation; lava buries land. (Any 2)
Marking: 1 mark each.
Q15. [3 marks]
Answer: Warm water evaporates providing moisture; heat energy fuels storm convection.
Marking: 1 mark moisture, 2 marks energy/convection.
Section C: Extended Response
Q16. [5 marks]
Answer: Disagree; human causes (CO2) dominate. Evidence: CO2 rise matches industrialisation. Natural (solar) minor.
Marking descriptors: 1 mark stance, 2 marks human cause+evidence, 2 marks natural rebuttal.
Q17. [5 marks]
Answer: Earthquake: plate movement releases energy. Risk reduction: building codes, drills.
Marking: 1 mark hazard, 2 marks cause, 2 marks management.
Q18. [4 marks]
Answer: Longshore drift deposits sand beyond headland forming spit. Human: groynes trap sand reducing supply.
Marking: 2 marks formation, 2 marks impact.
Q19. [4 marks]
Answer: Viscous lava layers form steep composite; explosive due to silica. Shield is gentle/less explosive.
Marking: 2 marks formation, 2 marks danger compare.
Q20. [4 marks]
Answer: Mangroves buffer waves, stabilise soil; effective locally but limited against severe erosion.
Marking: 2 marks benefits, 2 marks limitation/eval.
</stage3_quiz_answers_md>
<stage3_quiz_md>
Secondary 4 Geography Quiz - Physical Geography
Name: ___________________________
Class: ___________
Date: ___________
Score: ___________ / 40
Duration: 60 minutes
Total Marks: 40
Instructions: Answer all 20 questions. Section A is data/diagram interpretation. Section B is structured response. Section C is extended response. Use clear geographical terms. Show workings where required.
Section A: Data and Diagram Interpretation (Questions 1–7)
1. Study the table below showing average global temperature anomaly (°C above 1900 baseline) for selected years.
| Year | Anomaly (°C) |
|---|
| 1980 | 0.30 |
| 1990 | 0.40 |
| 2000 | 0.55 |
| 2010 | 0.70 |
| 2020 | 0.95 |
Describe the trend shown in the table. [2]
2. Using the data in Q1, calculate the percentage increase in temperature anomaly from 1980 to 2020. Show your working. [3]
3.
Generated diagram for Q3.
Study Figure Q3-fig1 which shows a wave type. Describe the type of waves associated with the diagram. [3]
4.
Generated map for Q4.
With reference to Map Q4-fig1, name the type of volcano shown and state one feature visible. [2]
5. The pie chart data below shows causes of coastal erosion in a study area: wave action 50%, human activity 30%, rainfall 20%. Plot a pie chart to represent this data. [3]
6.
Generated photograph for Q6.
Study Photograph Q6-fig1 showing a coastal landform. Identify the landform and describe two observable features. [3]
7. A student recorded earthquake depths (km) at a plate boundary: 10, 25, 40, 55, 70. Calculate the mean depth. Show working. [2]
Section B: Structured Response (Questions 8–15)
8. Explain how hydraulic action contributes to coastal cliff erosion. [2]
9. State two differences between destructive and constructive waves. [2]
10. Describe how a volcanic hotspot forms a chain of islands, using Hawaii as example context. [3]
11. Explain one cause of global climate change related to the greenhouse effect. [2]
12.
Generated graph for Q12.
With reference to Figure Q12-fig1, explain the relationship between year and CO2 concentration. [3]
13. Account for the formation of a wave-cut platform. [3]
14. State two impacts of a volcanic eruption on the environment. [2]
15. Explain why tropical storms gain energy over warm ocean water. [3]
Section C: Extended Response (Questions 16–20)
16. "Climate change is mainly caused by natural processes." Do you agree? Explain your answer using evidence. [5]
17. With reference to a named tectonic hazard, explain its causes and how people can reduce its risk. [5]
18. Describe how coastal deposition forms a spit, and explain one human impact on this process. [4]
19. Explain the formation of a composite volcano and why it is more dangerous than a shield volcano. [4]
20. Evaluate the effectiveness of mangrove planting in protecting coastlines from erosion. [4]