From Real Exams Quiz
Secondary 4 Geography Map Graph Data Skills Quiz
Free Sec 4 Geography Map Graph Data Skills quiz, HY3 Exam version, with questions, answers, and O Level-style practice for Singapore students.
These static practice materials are generated from the site's syllabus and paper-generation workflow, with source and model context shown so students and parents can evaluate the material before use.
Questions
Secondary 4 Geography Quiz - Map Graph Data Skills
Name: ___________________________
Class: ____________
Date: ____________
Score: ____________
Duration: 60 minutes
Total Marks: 40
Instructions:
- This quiz tests your Map, Graph & Data Skills.
- Answer all 20 questions.
- Use the data, maps, and diagrams provided.
- For drawing questions, use a ruler and protractor where needed.
Section A: Data Interpretation (Questions 1–7)
1. Study the table below showing tourist arrivals to Country X from different regions in 2023.
| Region | Arrivals (thousands) |
|---|---|
| Asia | 820 |
| Europe | 340 |
| Americas | 210 |
| Africa | 90 |
| Oceania | 140 |
Plot a pie chart to represent the data. [3]
2. Using the table in Q1, calculate the angle for the Asia sector in the pie chart. Show your working. [2]
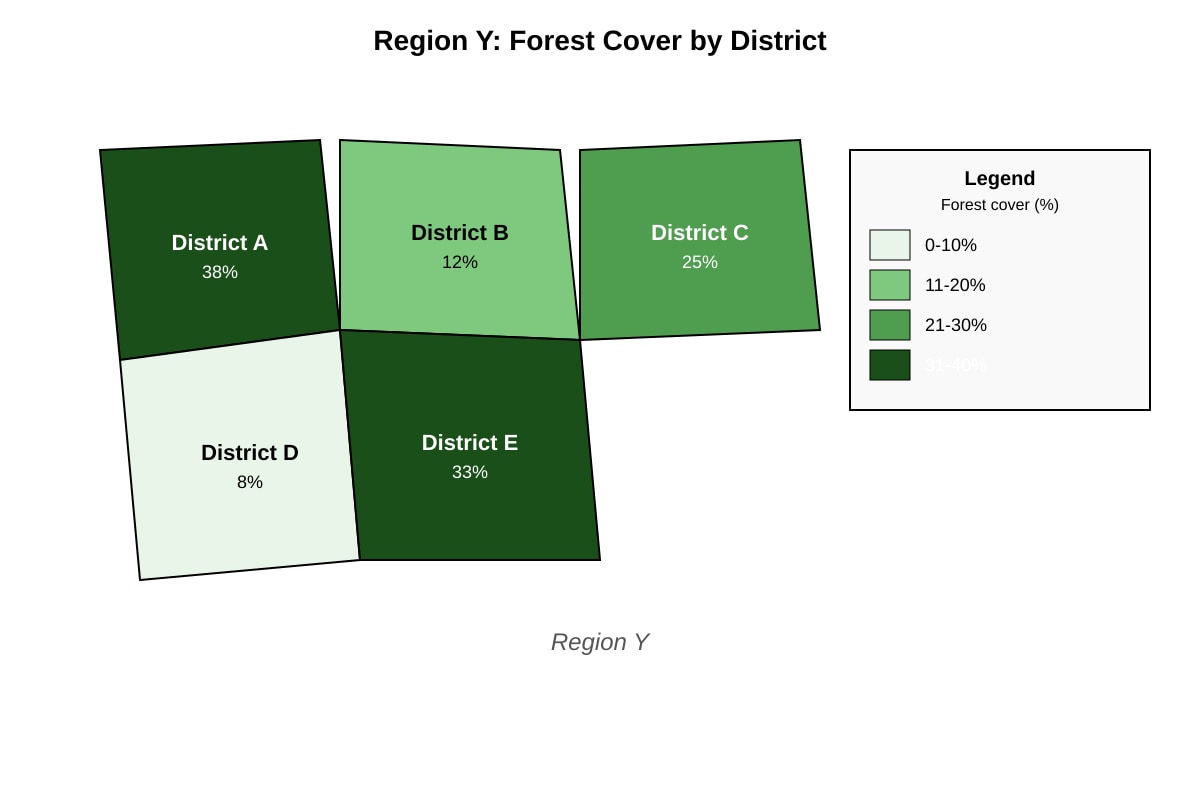
3. Study the map below which shows the percentage of forest cover by district in Region Y.
Image pending generation: map for Q3.
With reference to the map, state two districts that have forest cover above 30%. [2]
(i) ___________________
(ii) ___________________
4. The table below shows monthly rainfall (mm) for Town Z in 2023.
| Month | Jan | Feb | Mar | Apr | May | Jun | Jul | Aug | Sep | Oct | Nov | Dec |
|---|---|---|---|---|---|---|---|---|---|---|---|---|
| Rain (mm) | 120 | 90 | 80 | 60 | 50 | 40 | 30 | 35 | 70 | 110 | 150 | 170 |
Describe the trend of rainfall from January to December. [3]
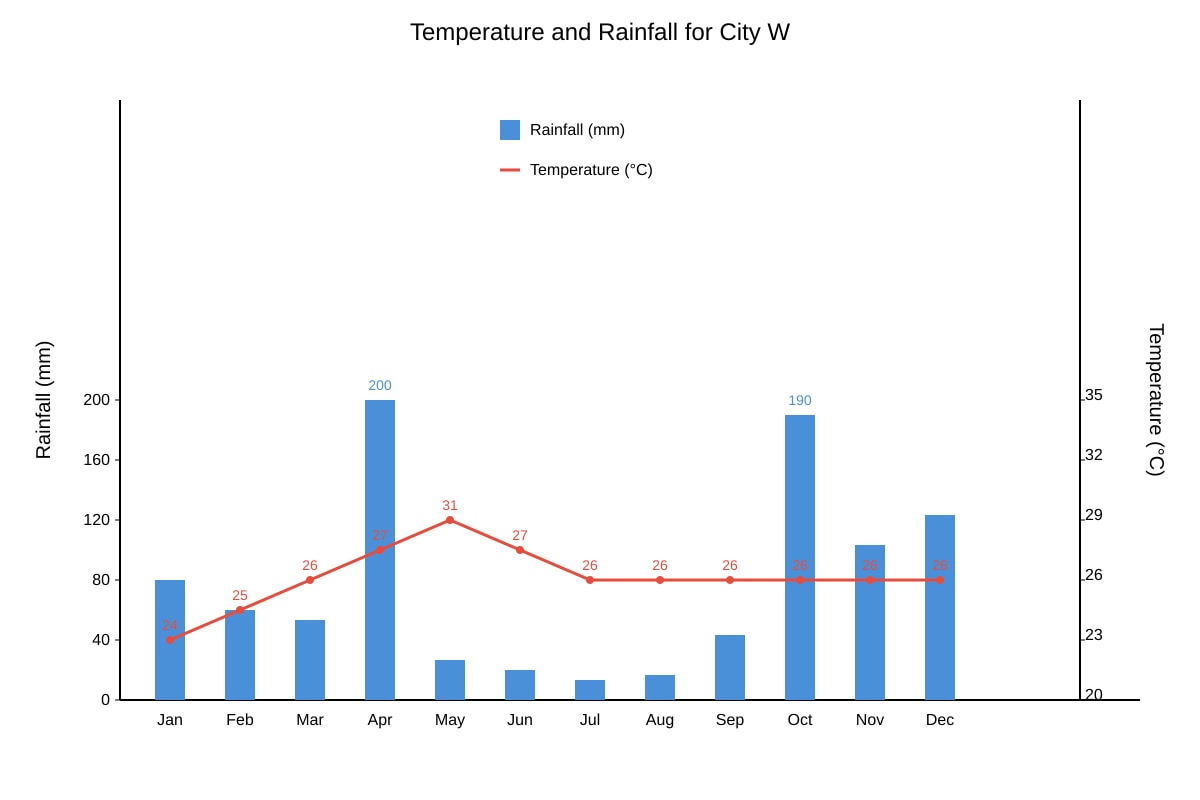
5. Study the graph below showing temperature and rainfall for City W.
Image pending generation: graph for Q5.
State the two months with the highest rainfall and the temperature range. [2]
Rainfall peaks: _________ and _________
Temp range: _________ to _________
6. A student collected data on transport mode to school.
| Mode | Walk | Bus | MRT | Car |
|---|---|---|---|---|
| Count | 15 | 40 | 30 | 15 |
What percentage of students took the bus? [2]
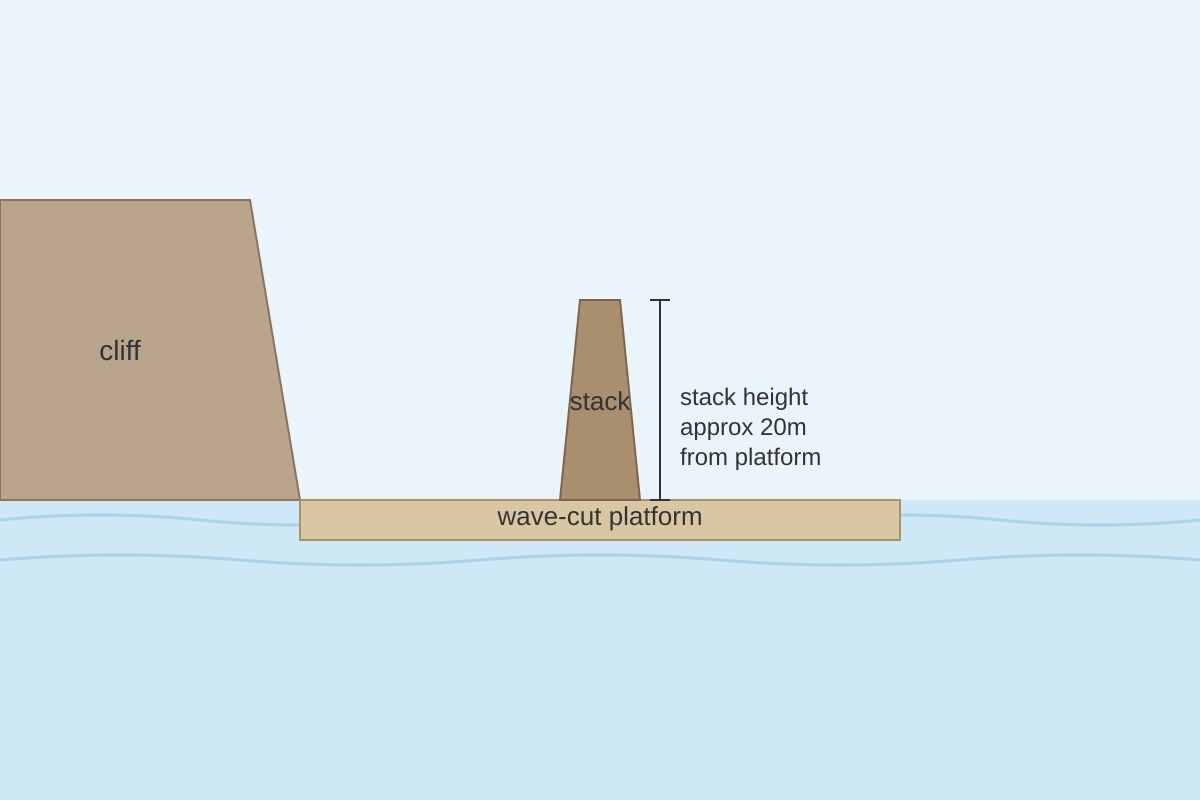
7. Study Photograph A below showing a coastal landform.
Image pending generation: diagram for Q7.
Describe the features of the coastal landform shown. [3]
Section B: Map and Graph Skills (Questions 8–14)
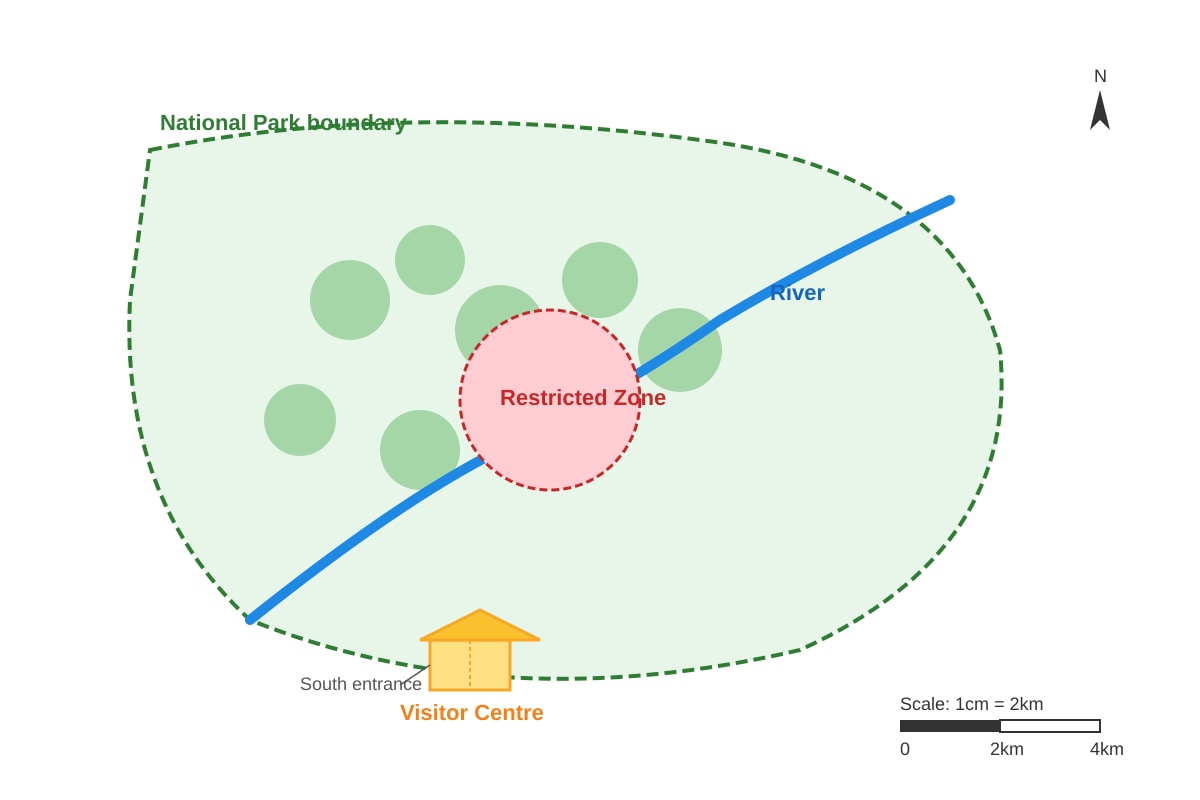
8. Study Map 1 below showing a proposed national park boundary in Country B.
Image pending generation: map for Q8.
With reference to Map 1, explain how the park design helps conserve the ecosystem. [4]
9. The table shows energy sources in Country C (2022).
| Source | Coal | Gas | Solar | Hydro | Wind |
|---|---|---|---|---|---|
| % | 45 | 25 | 10 | 12 | 8 |
Draw a bar graph to represent the data. [3]
10. Using the graph from Q9, which two sources make up more than 50% combined? [2]
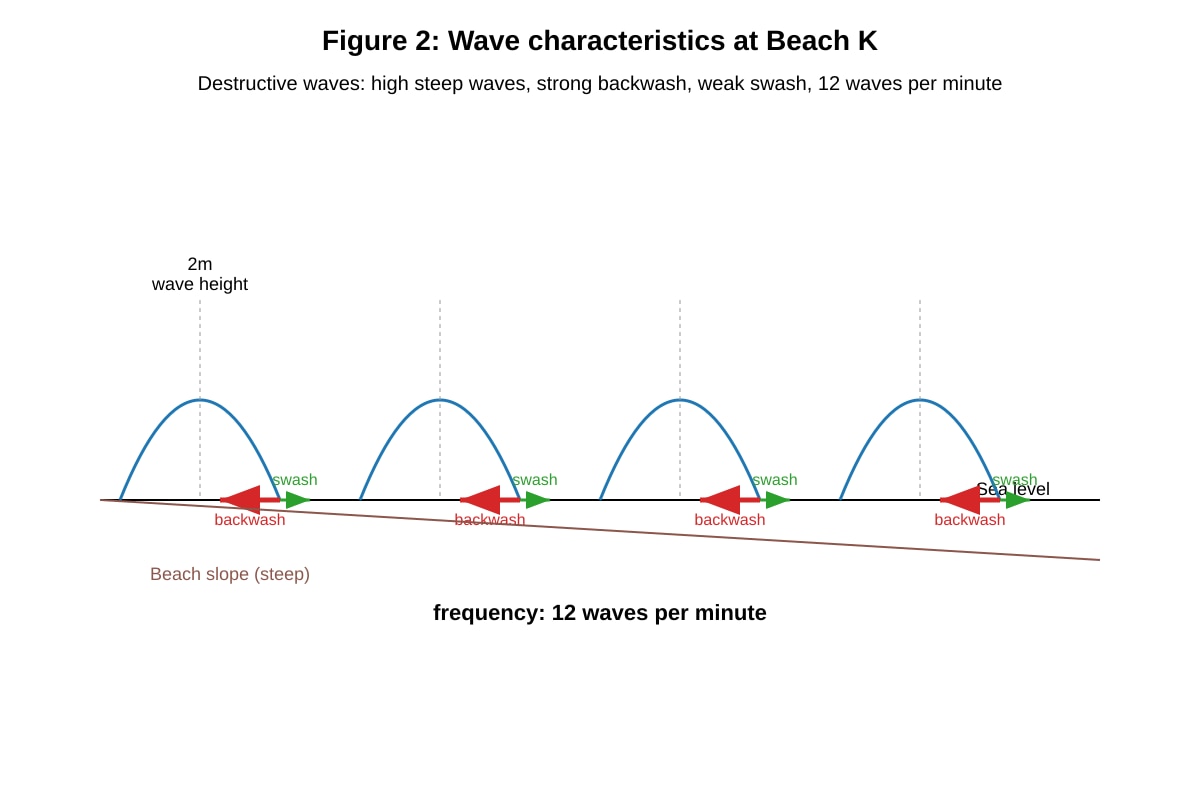
11. Study Figure 2 showing wave characteristics at Beach K.
Image pending generation: diagram for Q11.
Describe the type of waves and give two characteristics. [3]
Type: ___________________
(i) ___________________
(ii) ___________________
12. A field study recorded litter count per 100m at 4 beaches.
| Beach | A | B | C | D |
|---|---|---|---|---|
| Litter items | 8 | 15 | 5 | 12 |
Which beach is cleanest? What is the mean litter count? [2]
Cleanest: _______
Mean: _______
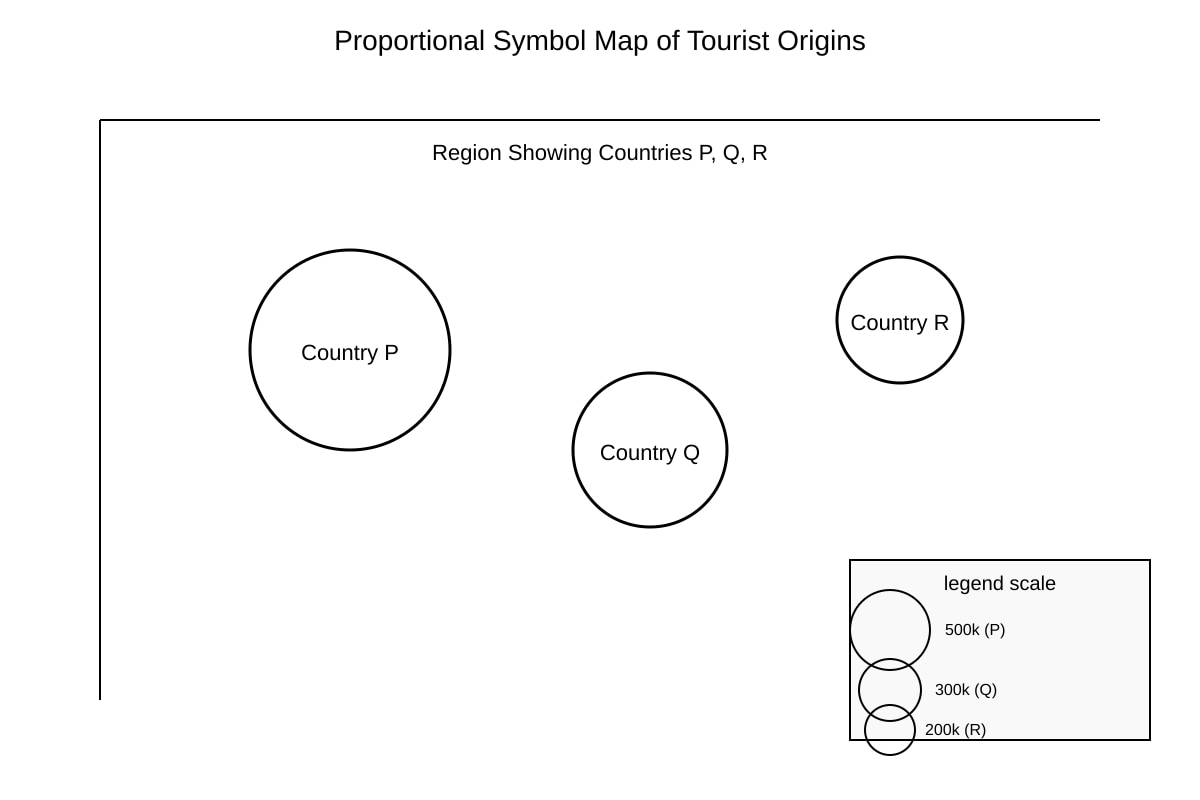
13. Study the incomplete proportional symbol map of tourist origins.
Image pending generation: map for Q13.
Use the table to complete the map by drawing circles of correct relative size. [2]
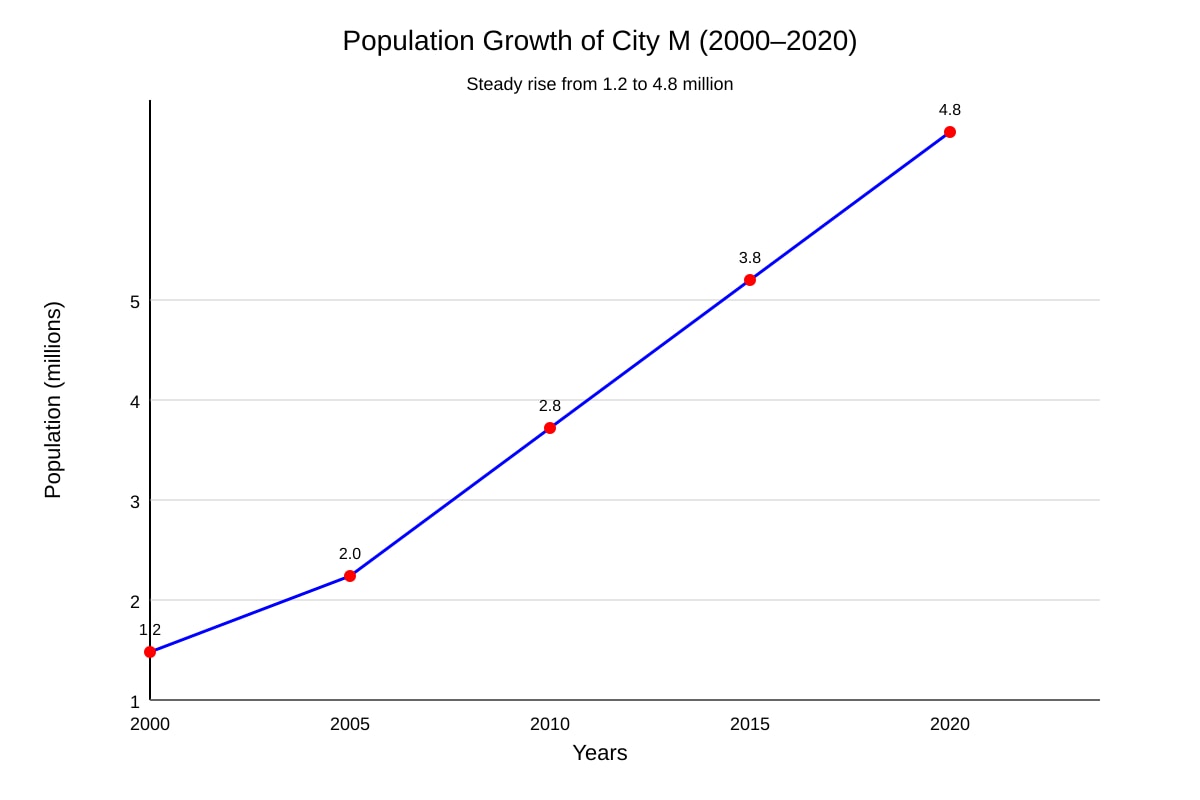
14. The line graph shows population growth of City M from 2000 to 2020.
Image pending generation: graph for Q14.
Calculate the average increase in population per 5 years. [2]
Section C: Applied Data Skills (Questions 15–20)
15. Study the table of water usage in Singapore households.
| Use | Shower | Tap | WC | Others |
|---|---|---|---|---|
| % | 35 | 20 | 25 | 20 |
Construct a pie chart. [3]
16. From Q15, what is the angle for "WC" use? [1]
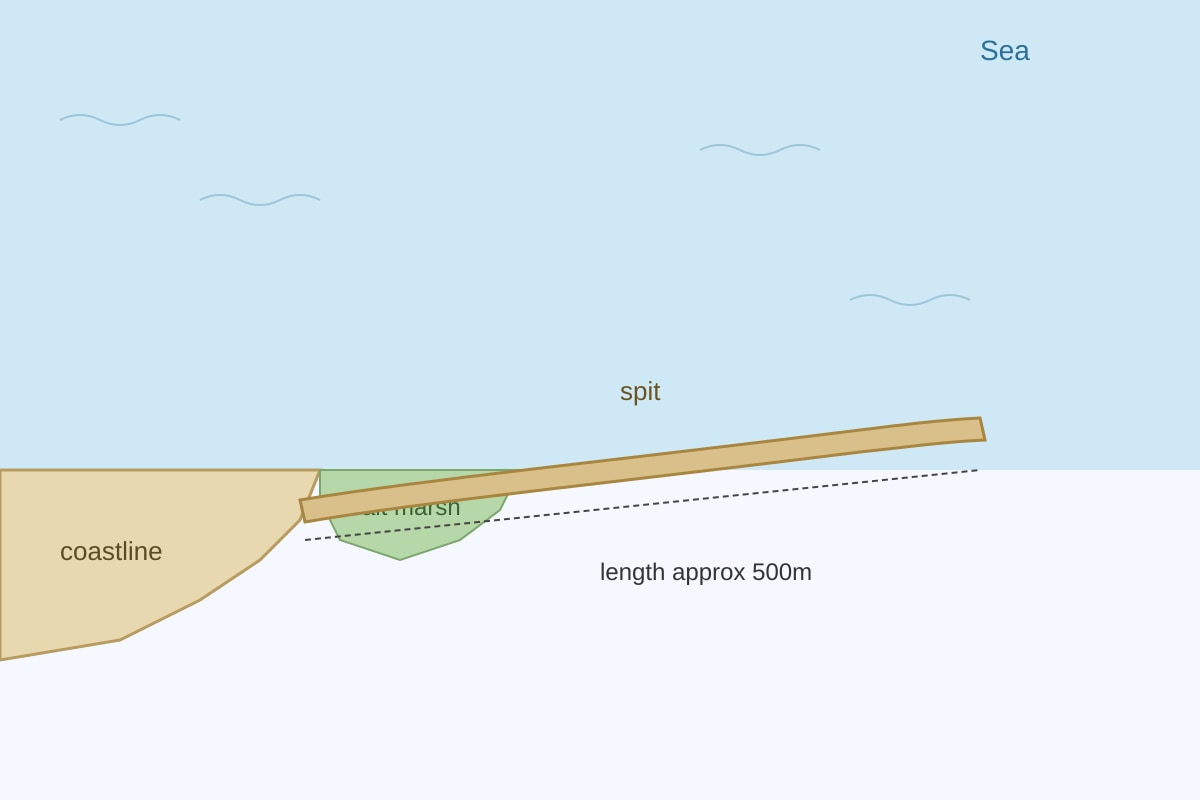
17. Study Photograph B of a spit.
Image pending generation: diagram for Q17.
Describe the spit and account for its formation. [5]
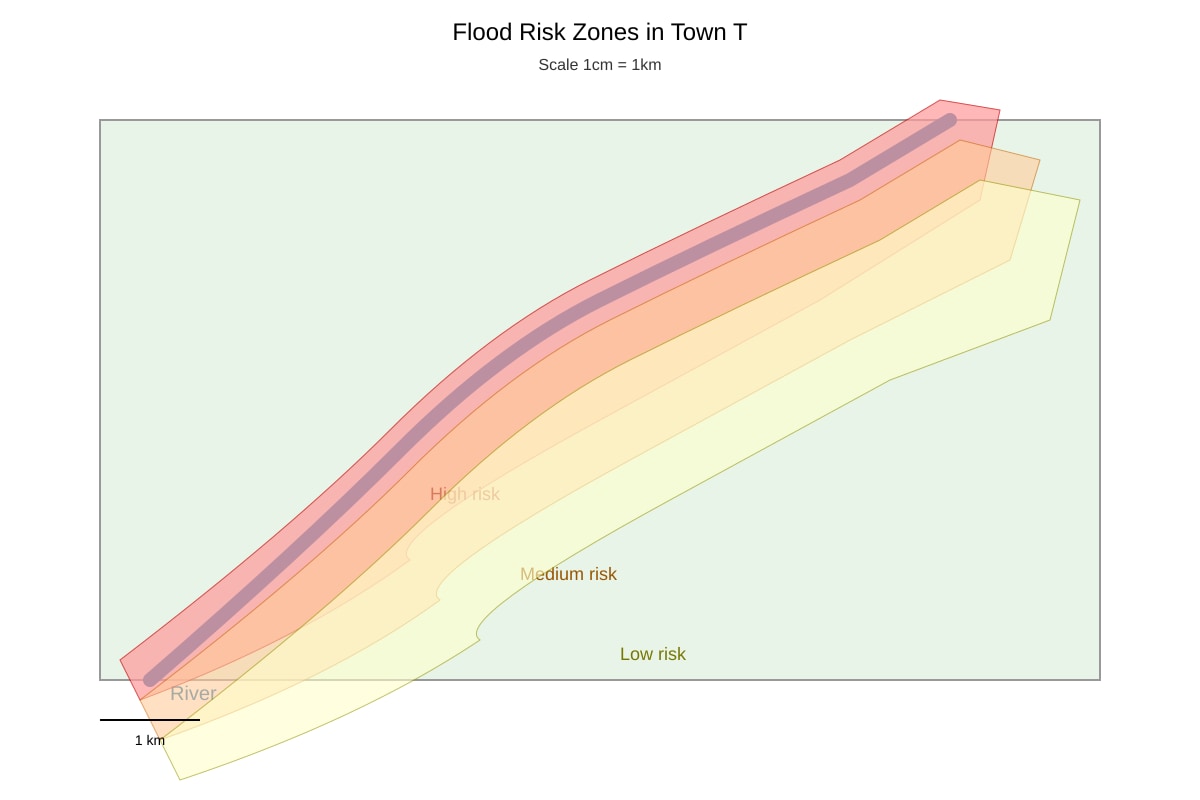
18. The map shows flood risk zones in Town T.
Image pending generation: map for Q18.
With reference to the map, list two areas at high flood risk. [2]
(i) ___________________
(ii) ___________________
19. A survey of 200 residents on recycling habit:
| Response | Always | Sometimes | Never |
|---|---|---|---|
| Count | 90 | 70 | 40 |
What percentage never recycle? [2]
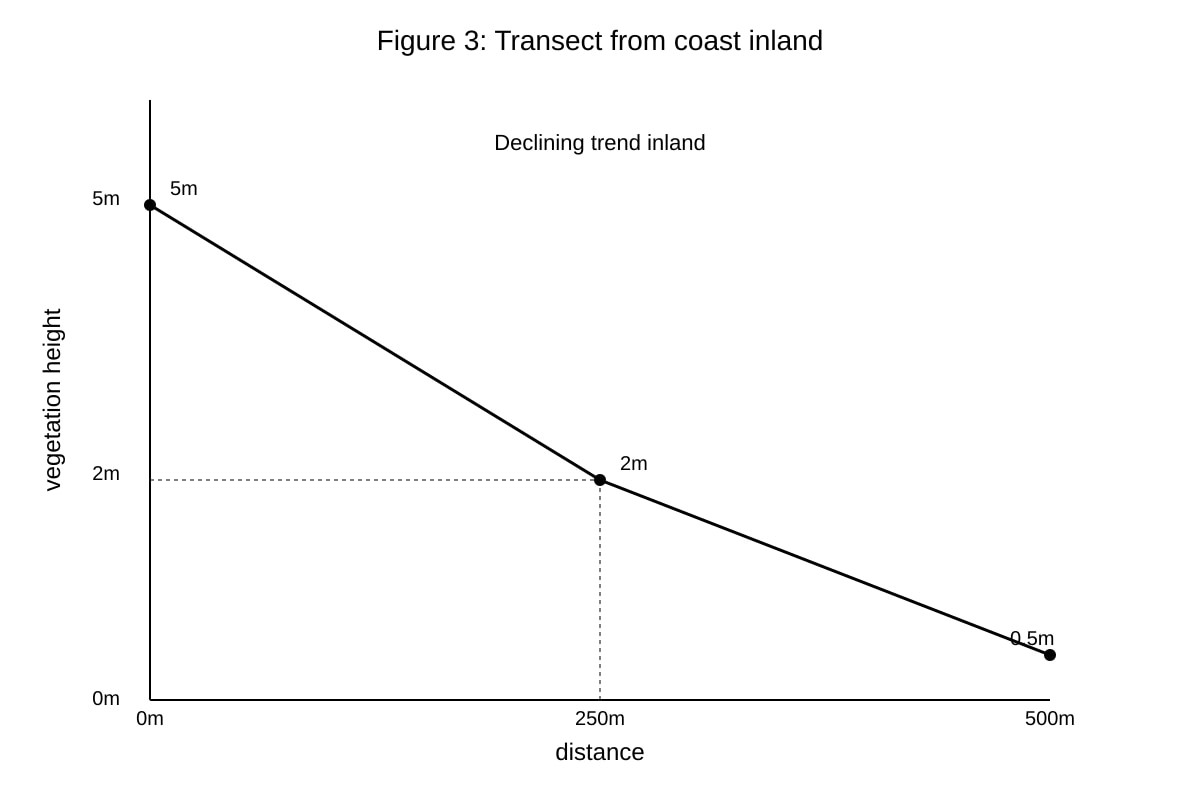
20. Study Figure 3 showing a transect from coast inland.
Image pending generation: graph for Q20.
Describe the change in vegetation height along the transect. [3]
Answers
Secondary 4 Geography Quiz - Map Graph Data Skills (Answer Key)
Total Marks: 40
Duration: 60 minutes
Section A: Data Interpretation
Q1. [3 marks]
Pie chart of tourist arrivals:
- Total = 820+340+210+90+140 = 1600 thousand
- Asia: (820/1600)×360 = 184.5°
- Europe: (340/1600)×360 = 76.5°
- Americas: (210/1600)×360 = 47.25°
- Africa: (90/1600)×360 = 20.25°
- Oceania: (140/1600)×360 = 31.5° Marking: 1 mark angles correct, 1 mark title+legend, 1 mark neat plot.
Q2. [2 marks]
Angle Asia = (820 / 1600) × 360° = 184.5°
Working: 820÷1600=0.5125; ×360 = 184.5°.
1 mark for division, 1 mark for final angle.
Q3. [2 marks]
(i) District A (38%)
(ii) District E (33%)
Both above 30%. 1 mark each.
Q4. [3 marks]
Trend: Rainfall decreases from Jan (120mm) to Jul (30mm), then increases to Dec (170mm).
Bimodal/U-shaped.
1 mark overall description, 2 marks reference to low and high months.
Q5. [2 marks]
Rainfall peaks: Apr and Oct. Temp range: 24°C to 31°C. 1 mark each pair.
Q6. [2 marks]
Total = 15+40+30+15 = 100. Bus % = (40/100)×100 = 40%.
1 mark total, 1 mark percentage.
Q7. [3 marks]
Features: isolated sea stack ~20m high; wave-cut platform at base; cliff behind retreating.
1 mark landform ID, 2 marks features described.
Section B: Map and Graph Skills
Q8. [4 marks]
- Restricted zone protects core (1)
- Visitor centre limits access to core (1)
- Boundary encloses river/forest (1)
- Scale shows size managed (1)
Marking descriptors as above.
Q9. [3 marks]
Bar graph: 5 bars (Coal 45, Gas 25, Solar 10, Hydro 12, Wind 8).
1 mark bars, 1 mark labels, 1 mark title.
Q10. [2 marks]
Coal (45%) + Gas (25%) = 70% > 50%. Answer: Coal and Gas.
Q11. [3 marks]
Type: Destructive.
(i) High steep waves (2m)
(ii) Strong backwash > swash, 12/min
1 mark type, 2 marks characteristics.
Q12. [2 marks]
Cleanest: C (5 items). Mean = (8+15+5+12)/4 = 10.
1 mark each.
Q13. [2 marks]
Circles: P largest (500k), Q medium (300k), R smallest (200k).
1 mark relative size, 1 mark legend.
Q14. [2 marks]
Increase 2000→2020 = 4.8-1.2 = 3.6 million over 20 years = 4 periods.
Per 5yr = 3.6/4 = 0.9 million. 1 mark calc, 1 mark answer.
Section C: Applied Data Skills
Q15. [3 marks]
Total 100%. Angles: Shower 126°, Tap 72°, WC 90°, Others 72°.
1 mark angles, 1 mark title, 1 mark plot.
Q16. [1 mark]
WC angle = 25% × 360 = 90°.
Q17. [5 marks]
Describe: elongated ridge of sand extending from coast, salt marsh behind. [2]
Formation: longshore drift moves sediment; deposited where coast changes direction; grows over time. [3]
Marking: description 2, process 3.
Q18. [2 marks]
(i) Near river bend (high)
(ii) Lowland south (high)
1 mark each from map.
Q19. [2 marks]
Never = 40/200 × 100 = 20%. 1 mark total, 1 mark %.
Q20. [3 marks]
Vegetation height decreases from 5m at coast to 0.5m inland over 500m.
1 mark trend, 2 marks values referenced.
Free quiz and exam paper access
Enter your details to view this paper
Your access is remembered on this device.