From Real Exams Quiz
Secondary 4 Geography Map Graph Data Skills Quiz
Free Sec 4 Geography Map Graph Data Skills quiz, Exam version, with questions, answers, and O Level-style practice for Singapore students.
These static practice materials are generated from the site's syllabus and paper-generation workflow, with source and model context shown so students and parents can evaluate the material before use.
Questions
Secondary 4 Geography Quiz - Map Graph Data Skills
Name: _________________ Class: _________________ Date: _________________
Score: _____ / 35 marks Duration: 45 minutes
Instructions:
- Answer ALL questions in the spaces provided
- Use black or blue pen only
- Show all working for calculation questions
- Refer to figures and data sources where indicated
Section A: Data Interpretation [15 marks]
Question 1 [3 marks]
Study Table 1, which shows visitor arrivals to Singapore by country of origin in 2023.
| Country | Visitors (thousands) |
|---|---|
| China | 1,850 |
| Indonesia | 1,420 |
| Malaysia | 980 |
| India | 750 |
| Australia | 520 |
Plot a pie chart to represent this data. Show your working for angle calculations.
Working:
Pie Chart:
Question 2 [4 marks]
Study Photograph A, which shows a coastal landform in Southeast Asia.
[Photograph would show a mangrove coastline with visible root systems and mudflats]
With reference to Photograph A, describe the features visible and explain how this ecosystem helps reduce coastal erosion.
Features: ________________________________________________________________
Erosion reduction: __________________________________________________________
Question 3 [5 marks]
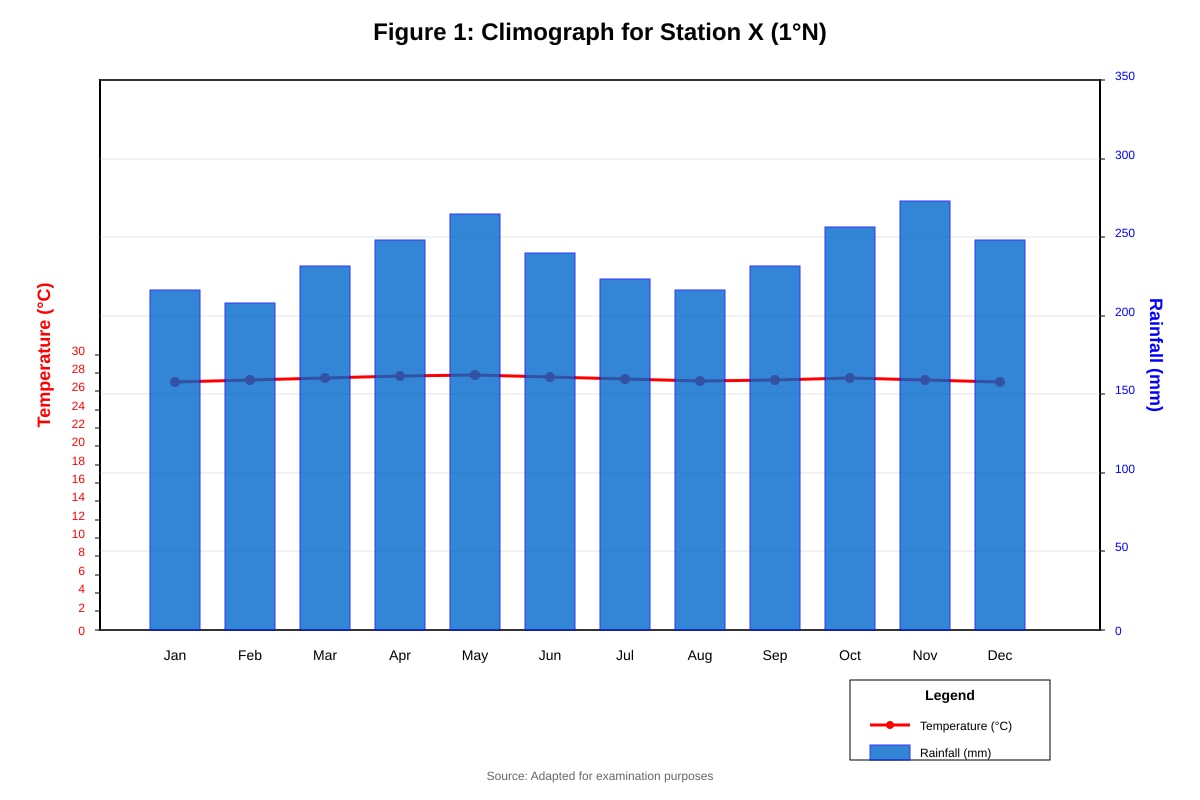
Study Figure 1, which shows temperature and rainfall data for Station X located at 1°N latitude.
Generated figure for this question.
(a) Name the climate type shown in Figure 1. [1]
(b) Account for this climate type at Station X's location. [4]
Question 4 [3 marks]
A student collected data on beach slope angles at different locations. The results are shown in Table 2.
| Location | Beach Material | Slope Angle |
|---|---|---|
| Bay A | Fine sand | 3° |
| Bay B | Coarse shingle | 12° |
| Bay C | Mixed sediment | 7° |
Explain the relationship between beach material and slope angle shown in the data.
Section B: Map Analysis [10 marks]
Question 5 [4 marks]
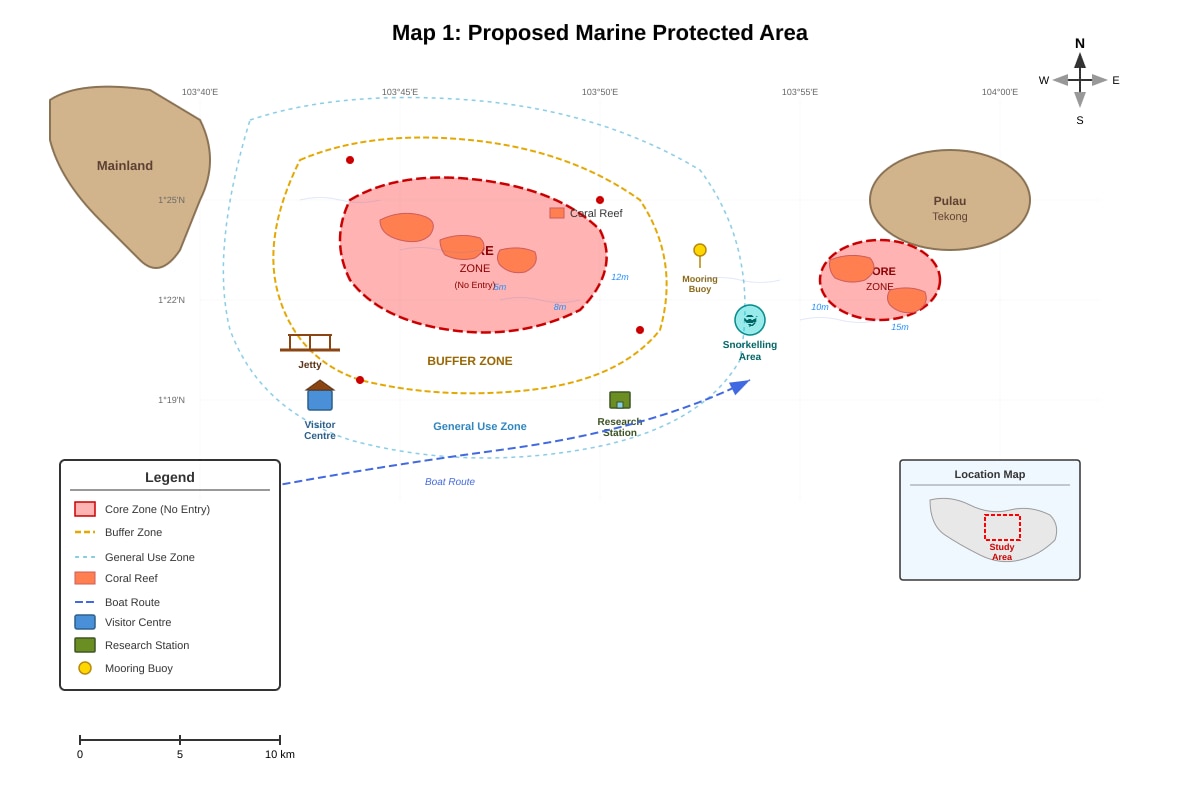
Study Map 1, which shows a proposed marine protected area in Southeast Asia.
Generated map for this question.
With reference to Map 1, explain how creating marine protected areas helps conserve coral reef ecosystems.
Question 6 [6 marks]
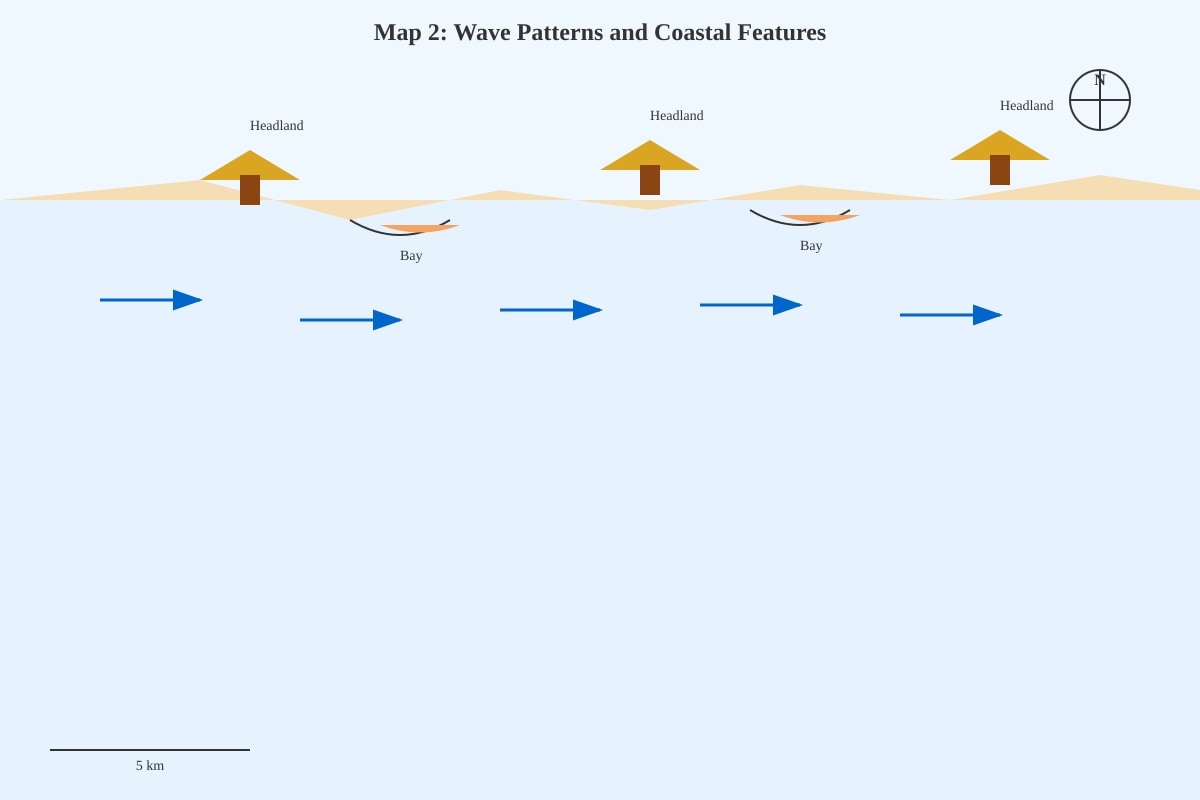
Study Map 2, which shows wave patterns and coastal features along a 5km stretch of coastline.
Generated map for this question.
(a) Describe the wave pattern shown in Map 2. [2]
(b) Explain how wave refraction affects erosion and deposition along this coastline. [4]
Section C: Data Analysis [10 marks]
Question 7 [6 marks]
Study Figure 2, which shows earthquake magnitude and death toll data for five recent earthquakes.
| Earthquake | Magnitude | Deaths | GDP per capita (USD) |
|---|---|---|---|
| A | 7.2 | 15,000 | 2,500 |
| B | 6.8 | 500 | 45,000 |
| C | 7.5 | 25,000 | 1,800 |
| D | 6.9 | 200 | 38,000 |
| E | 7.0 | 8,000 | 5,200 |
Analyse the relationship between earthquake magnitude, economic development, and death toll shown in the data.
Question 8 [4 marks]
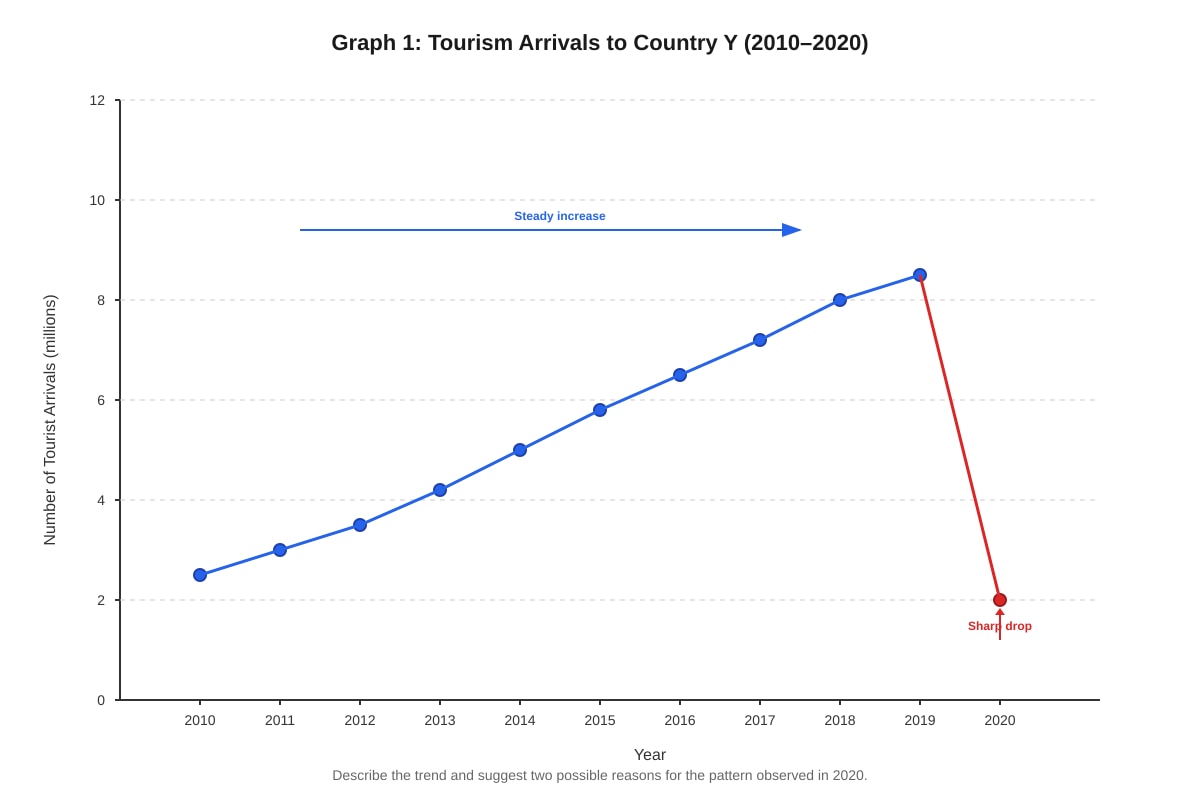
Study Graph 1, which shows tourism arrivals to Country Y from 2010-2020.
Generated graph for this question.
Describe the trend shown in Graph 1 and suggest two possible reasons for the pattern observed in 2020.
Trend: ___________________________________________________________________
Reason 1: ________________________________________________________________
Reason 2: ________________________________________________________________
END OF QUIZ
Answers
Secondary 4 Geography Quiz - Map Graph Data Skills (Answer Key)
Section A: Data Interpretation [15 marks]
Question 1 [3 marks]
Working: Total visitors = 1,850 + 1,420 + 980 + 750 + 520 = 5,520 thousand
China: (1,850 ÷ 5,520) × 360° = 121° Indonesia: (1,420 ÷ 5,520) × 360° = 93° Malaysia: (980 ÷ 5,520) × 360° = 64° India: (750 ÷ 5,520) × 360° = 49° Australia: (520 ÷ 5,520) × 360° = 34°
Marking:
- Correct angle calculations (2 marks)
- Accurate pie chart with title and labels (1 mark)
Question 2 [4 marks]
Features: Mangrove trees with extensive root systems visible above water level; mudflats between trees; calm water conditions; dense vegetation canopy (2 marks for any 2 detailed features)
Erosion reduction: Root systems trap sediment and reduce wave energy; dense vegetation acts as natural barrier; organic matter from mangroves increases soil stability; roots bind sediment together preventing erosion (2 marks for any 2 mechanisms with explanation)
Question 3 [5 marks]
(a) Climate type: Equatorial/Tropical rainforest climate (1 mark)
(b) Account for climate:
- High temperatures due to location near equator receiving intense solar radiation year-round (1 mark)
- High rainfall caused by Intertropical Convergence Zone (ITCZ) bringing convectional rainfall (1 mark)
- Trade winds converge causing air to rise and cool, forming clouds and precipitation (1 mark)
- Consistent conditions throughout year due to minimal seasonal variation at equatorial latitude (1 mark)
Question 4 [3 marks]
Relationship explanation:
- Larger/coarser beach material (shingle) creates steeper slopes due to poor packing and high friction between particles (1 mark)
- Fine sand creates gentler slopes due to good packing and lower friction allowing particles to settle at lower angles (1 mark)
- Mixed sediment shows intermediate slope angle reflecting combination of particle sizes (1 mark)
Section B: Map Analysis [10 marks]
Question 5 [4 marks]
Conservation explanation:
- Core zones (no-take areas) allow fish populations to recover and coral to regenerate without human disturbance (1 mark)
- Buffer zones limit fishing activities while allowing some sustainable use, reducing pressure on core areas (1 mark)
- Visitor facilities concentrate tourism activities in designated areas, preventing damage to sensitive coral areas (1 mark)
- Zoning system allows monitoring and enforcement of regulations to prevent illegal fishing and pollution (1 mark)
Question 6 [6 marks]
(a) Wave pattern: Waves approach coastline at an angle; wave crests bend/refract around headlands; waves concentrate energy on headlands and spread energy in bays (2 marks for accurate description)
(b) Wave refraction effects:
- Waves slow down in shallow water near headlands, causing wave crests to bend and concentrate energy (1 mark)
- Concentrated wave energy on headlands increases erosion, forming cliffs and removing material (1 mark)
- Waves spread out in bays, reducing energy and allowing deposition of sediment (1 mark)
- This creates alternating pattern of erosional (headlands) and depositional (bays) landforms (1 mark)
Section C: Data Analysis [10 marks]
Question 7 [6 marks]
Analysis:
- Higher magnitude earthquakes do not always cause more deaths (e.g., Earthquake B: 6.8 magnitude, 500 deaths vs Earthquake A: 7.2 magnitude, 15,000 deaths) (1 mark)
- Countries with higher GDP per capita tend to have lower death tolls despite similar magnitudes (1 mark)
- Developed countries (B, D with GDP >$35,000) have significantly fewer deaths due to better building standards and emergency preparedness (2 marks)
- Developing countries (A, C with GDP <$3,000) show much higher death tolls, indicating greater vulnerability (1 mark)
- Economic development appears more important than earthquake magnitude in determining casualties (1 mark)
Question 8 [4 marks]
Trend: Steady increase in tourism arrivals from 2010-2019, followed by sharp decline in 2020 (1 mark)
Reason 1: COVID-19 pandemic caused international travel restrictions and border closures (1 mark with explanation)
Reason 2: Economic recession reduced disposable income for travel/tourism; health concerns made people avoid international travel (1 mark with explanation)
Alternative reasons: Natural disasters, political instability, currency fluctuations (accept any reasonable explanation with context)
Total: 35 marks
Grade Boundaries:
- A: 30-35 marks
- B: 25-29 marks
- C: 20-24 marks
- D: 15-19 marks
Free quiz and exam paper access
Enter your details to view this paper
Your access is remembered on this device.