From Real Exams Quiz
Secondary 4 Geography Fieldwork Quiz
Free Sec 4 Geography Fieldwork quiz, HY3 Exam version, with questions, answers, and O Level-style practice for Singapore students.
These static practice materials are generated from the site's syllabus and paper-generation workflow, with source and model context shown so students and parents can evaluate the material before use.
Questions
Free quiz and exam paper access
Enter your details to view this paper
Your access is remembered on this device.
Answers
Secondary 4 Geography Quiz - Fieldwork: Answer Key
Total Marks: 40
Duration: 45 minutes
Section A: Fieldwork Planning and Research Design
1. [1 mark]
Answer: To provide a testable statement that guides data collection and analysis.
Teaching note: A hypothesis predicts a relationship (e.g., "more litter near entrance"). It keeps the study focused and lets the student check if data supports it.
Common mistake: Saying "to get good results" – too vague; must show direction or relationship.
2. [2 marks]
Answer: The number of litter items decreases with increasing distance from the park entrance. (1 mark for variable relationship, 1 mark for clear direction)
Teaching note: Hypothesis must name both variables (distance, litter count) and propose a trend.
Marking: 1 mark for identifying variables, 1 mark for stating expected pattern.
3. [2 marks]
Answer: A narrow question is manageable within time/space limits (1); it allows clear data collection and specific analysis (1).
Teaching note: Broad questions like "study the environment" are hard to measure; narrow ones give actionable steps.
4. [2 marks]
Answer: Any two from: NEA temperature records, SingStat data, URA master plan, school records, online maps. (1 mark each)
Teaching note: Secondary data = already collected by others; useful for context before field visit.
5. [1 mark]
Answer: Stratified sampling covers different subgroups fairly, reducing bias.
Teaching note: Convenience may miss important zones; stratified ensures representation.
Section B: Data Collection Methods
6. [2 marks]
Answer: To gather people's opinions, behaviours, or knowledge (1) through set questions (1).
Teaching note: Used for human geography topics like sense of place or transport.
7. [2 marks]
Answer: A mental map shows a person's perception of an area (1) with landmarks, routes, and importance they draw (1).
Teaching note: Different from real map; reveals emotional/spatial connection.
8. [2 marks]
Answer: Any two: stand safely away from traffic, count in fixed time intervals, avoid distracting drivers, record systematically. (1 mark each)
Teaching note: Safety and consistency protect data quality.
9. [2 marks]
Answer: Field sketch can highlight key features and omit distractions (1); allows annotation of processes not visible in photo (1).
Teaching note: Photo shows real state but sketch shows understanding.
10. [2 marks]
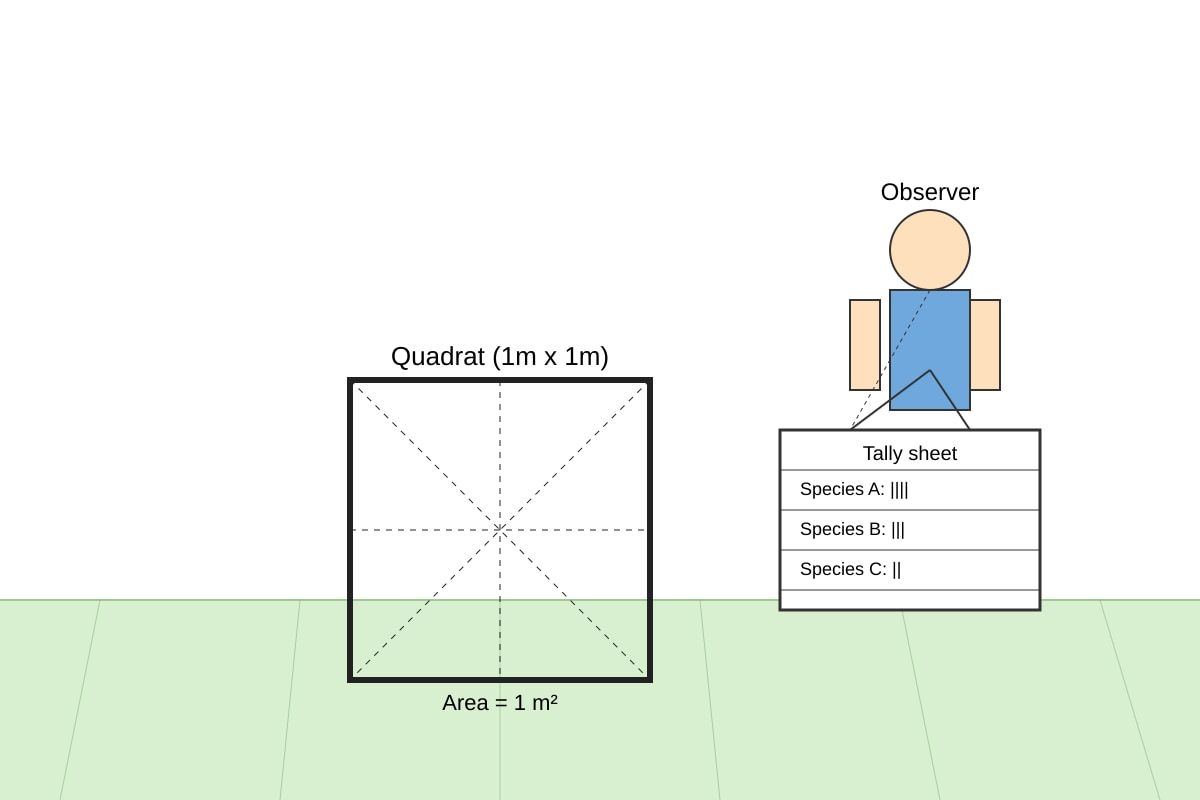
Answer: Place quadrat on ground (1); count items inside frame and record on tally (1).
Teaching note: From figure, 1 m² frame used for standard area count.
Expected visual: Quadrat labelled 1 m², tally sheet present.
Section C: Sampling and Data Analysis
11. [2 marks]
Working: (4+7+5+8+6) ÷ 5 = 30 ÷ 5 = 6
Answer: Mean = 6 items. (1 mark for sum, 1 mark for division/correct answer)
Teaching note: Mean = average; add all, divide by count.
12. [2 marks]
Working: (8 ÷ 20) × 100 = 40%
Answer: 40% walk. (1 mark for fraction, 1 mark for % calculation)
Teaching note: Percentage = part/total × 100.
13. [3 marks]
Answer: Bar graph with Zone A=12, B=18, C=10. (1 mark axes/labels, 1 mark correct bars, 1 mark title/legend)
Teaching note: Use equal width bars, label values.
14. [2 marks]
Answer: Count how often each response occurs (1); look for highest/lowest or repeating values to see trend (1).
Teaching note: Frequency shows common patterns.
15. [1 mark]
Answer: More shade attracts more park users.
Teaching note: Positive relationship = both increase together.
Section D: Presentation and Evaluation
16. [2 marks]
Answer: Poster, oral presentation, graph display, video. (1 mark each, any two)
Teaching note: Reports not only written; varied audience reach.
17. [2 marks]
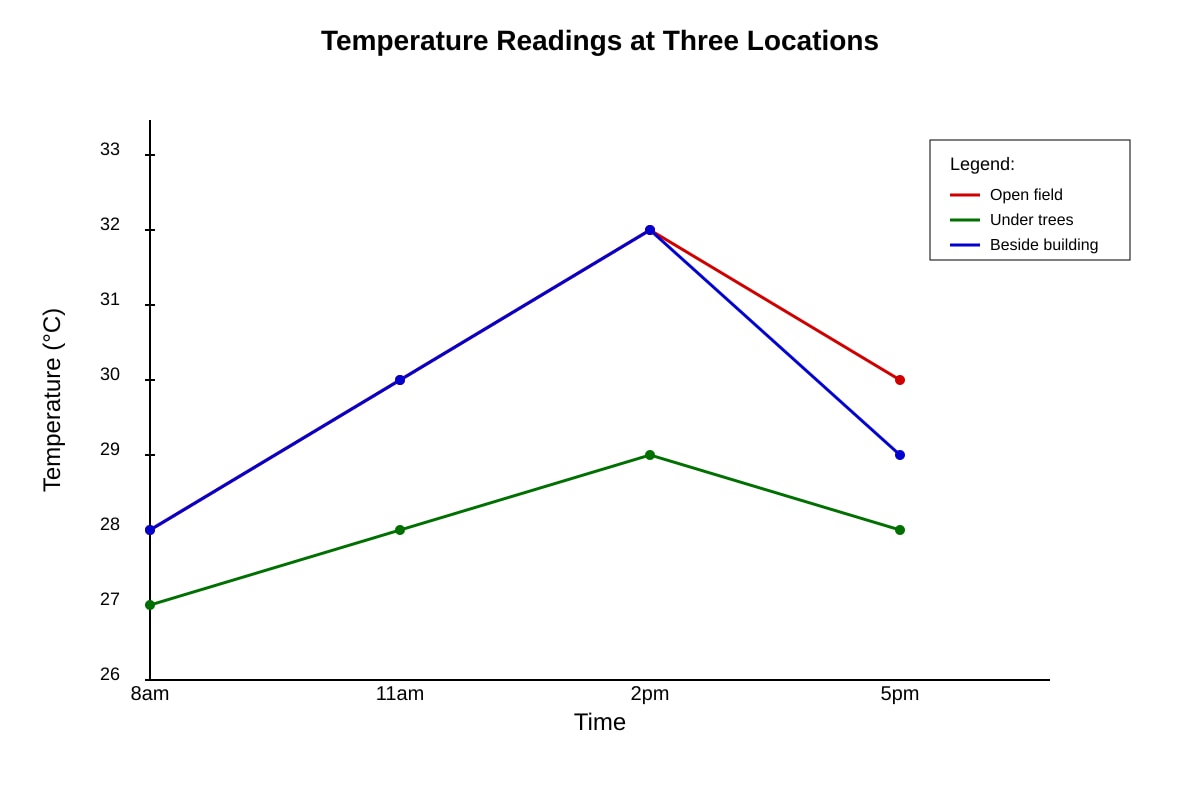
Answer: Temperature rises from 28°C at 8am to 33°C at 2pm then falls to 30°C at 5pm (1); highest at afternoon (1).
Teaching note: From graph values open field: 28,31,33,30.
Expected visual: 3 lines, open field peak at 2pm.
18. [2 marks]
Answer: Shows where data collected (1); helps reader understand spatial context (1).
Teaching note: Map links findings to place.
19. [2 marks]
Answer: Only one time may miss daily variation (1); weather that day may not be typical (1).
Teaching note: Single sample limits reliability.
20. [2 marks]
Answer: Collect data across multiple days/times (1); use more sites for comparison (1).
Teaching note: Repeated sampling improves confidence.