AI Generated Exam Paper
Secondary 4 Geography Practice Paper 5
Free Sec 4 Geography Practice Paper 5, HY3 AI version, with questions, answers, and O Level-style practice for Singapore students.
These static practice materials are generated from the site's syllabus and paper-generation workflow, with source and model context shown so students and parents can evaluate the material before use.
Questions
TuitionGoWhere Practice Paper - Geography Secondary 4
TuitionGoWhere Practice Paper (AI) — Version 5
Subject: Geography
Level: Secondary 4
Paper: Practice Paper (Map Graph Data Skills)
Duration: 1 hour 15 minutes
Total Marks: 40
Name: ________________________
Class: ____________
Date: ____________
Instructions:
- This practice paper contains 20 questions on Map, Graph & Data Skills.
- Answer all questions in the spaces provided.
- Use the data, figures, and tables given to support your answers with reference where required.
- Marks for each question are shown in brackets [ ].
- Section marks and total marks are stated at the end of each section.
Section A: Data Interpretation (Questions 1–8) [16 marks]
1. Study Table 1 which shows the monthly mean temperature and rainfall for City X in 2022.
| Month | Jan | Feb | Mar | Apr | May | Jun | Jul | Aug | Sep | Oct | Nov | Dec |
|---|---|---|---|---|---|---|---|---|---|---|---|---|
| Temp (°C) | 27 | 27 | 28 | 28 | 28 | 27 | 27 | 27 | 27 | 27 | 27 | 27 |
| Rainfall (mm) | 180 | 160 | 200 | 240 | 220 | 140 | 120 | 130 | 160 | 210 | 250 | 220 |
Describe the annual temperature pattern of City X. [2]
2. Using the data in Table 1 (Q1), calculate the total annual rainfall for City X. Show your working. [2]
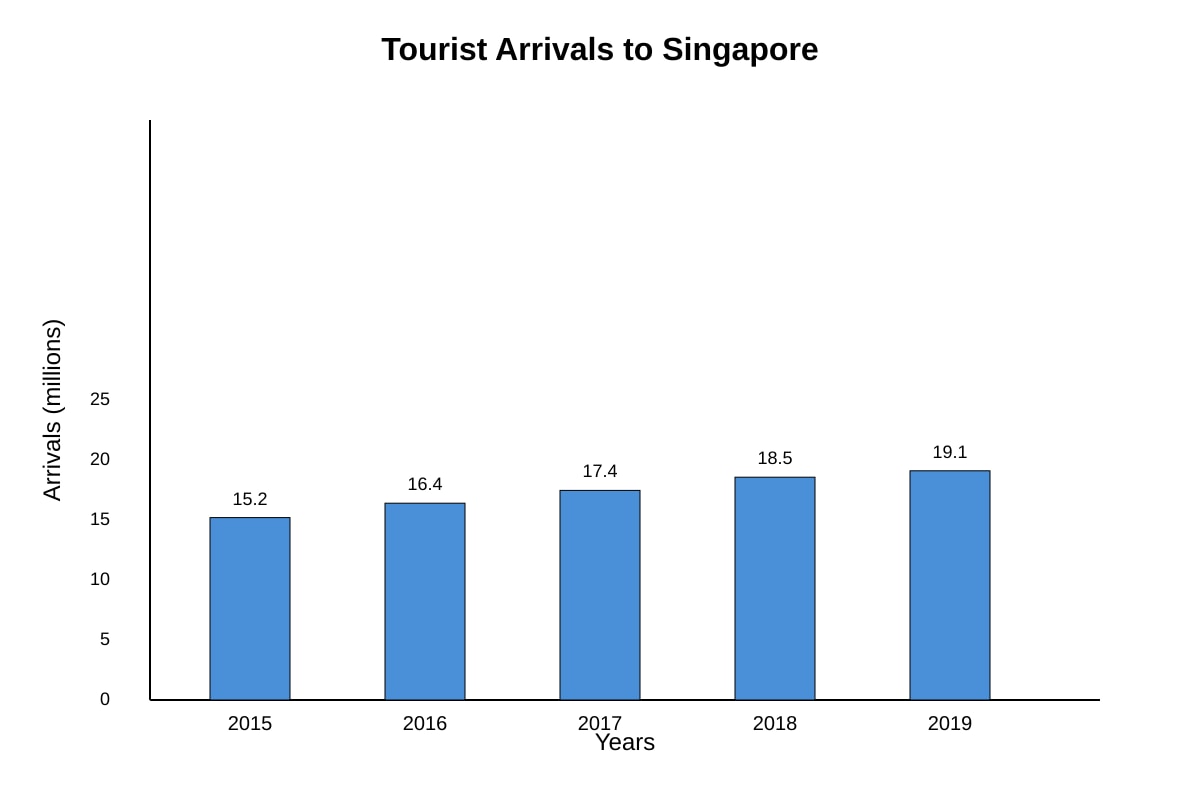
3. Study the bar chart described in Figure 1 below.
Image pending generation: graph for Q3.
With reference to Figure 1, state the trend in tourist arrivals from 2015 to 2019. [1]
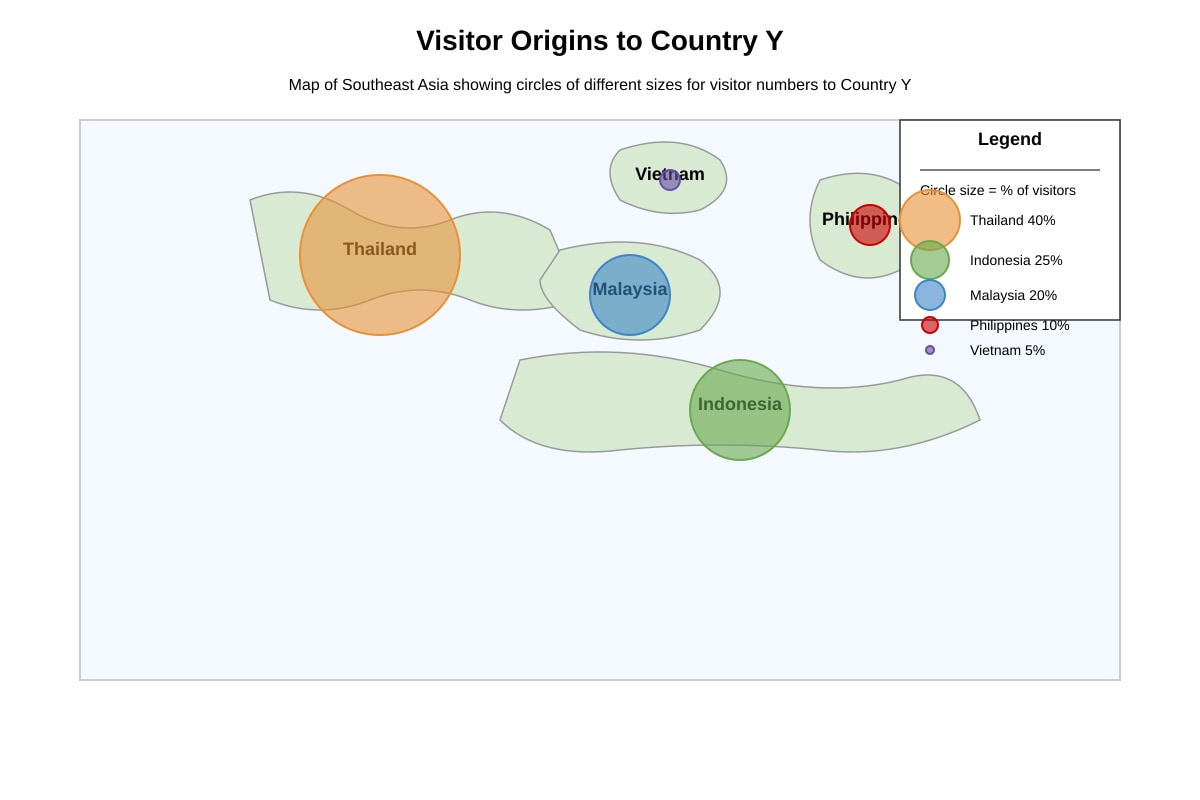
4. Study Figure 2 which is an incomplete proportional symbol map of visitor origins to Country Y.
Image pending generation: map for Q4.
Table 2 shows visitor origins to Country Y in 2021: Thailand 40%, Indonesia 25%, Malaysia 20%, Philippines 10%, Vietnam 5%. Use Table 2 to complete Figure 2 by stating the circle size order from largest to smallest. [2]
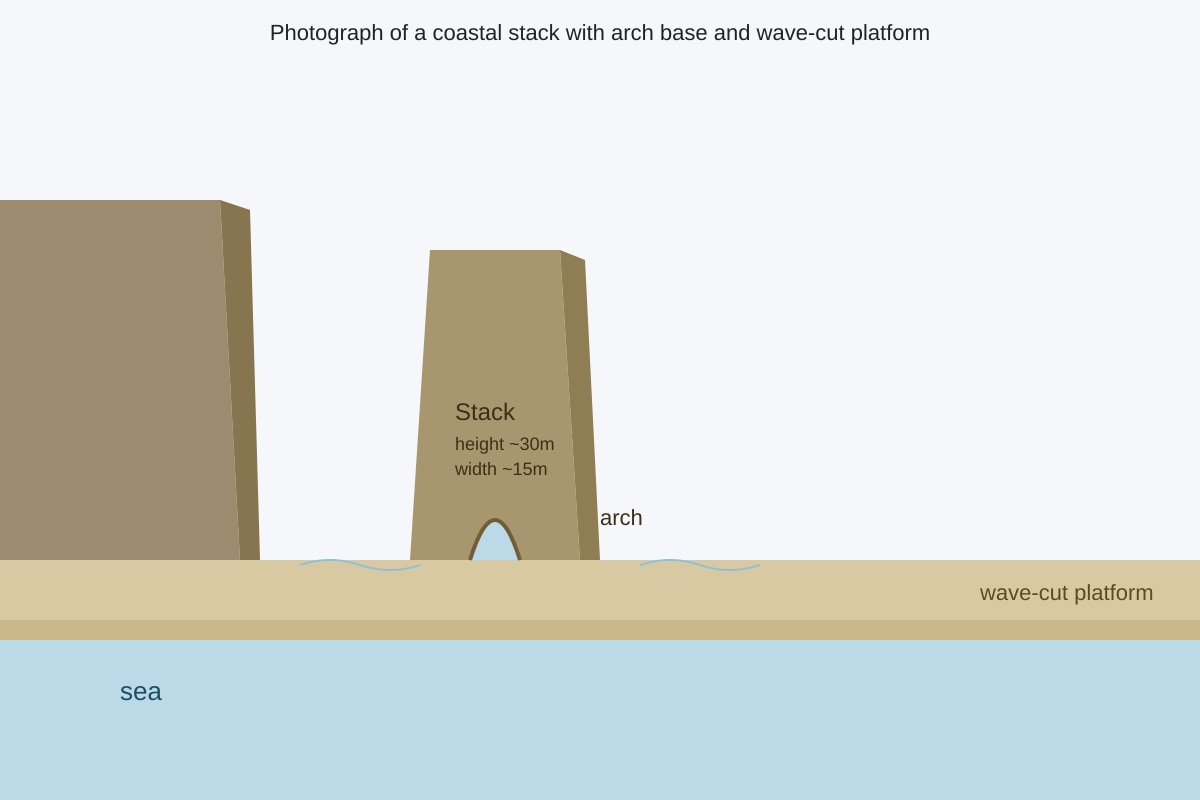
5. Study Photograph A described below.
Image pending generation: source_image for Q5.
With reference to Photograph A, identify the coastal landform shown and describe two visible features. [3]
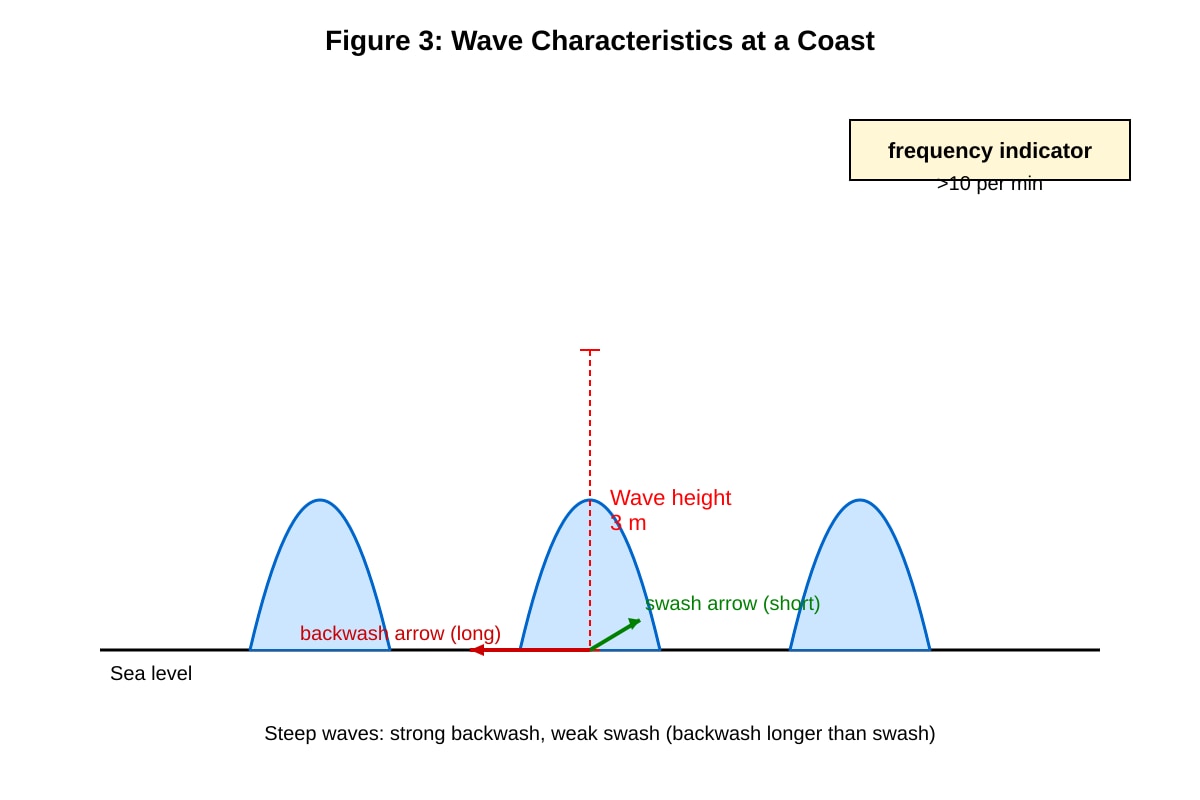
6. Study Figure 3 which shows wave characteristics at a coast.
Image pending generation: diagram for Q6.
Describe the type of waves shown in Figure 3. [2]
7. Table 3 shows land use in Town Z: Residential 45%, Commercial 20%, Industrial 15%, Green space 20%. Plot a pie chart to represent this data. Calculate the angle for Residential. [2]
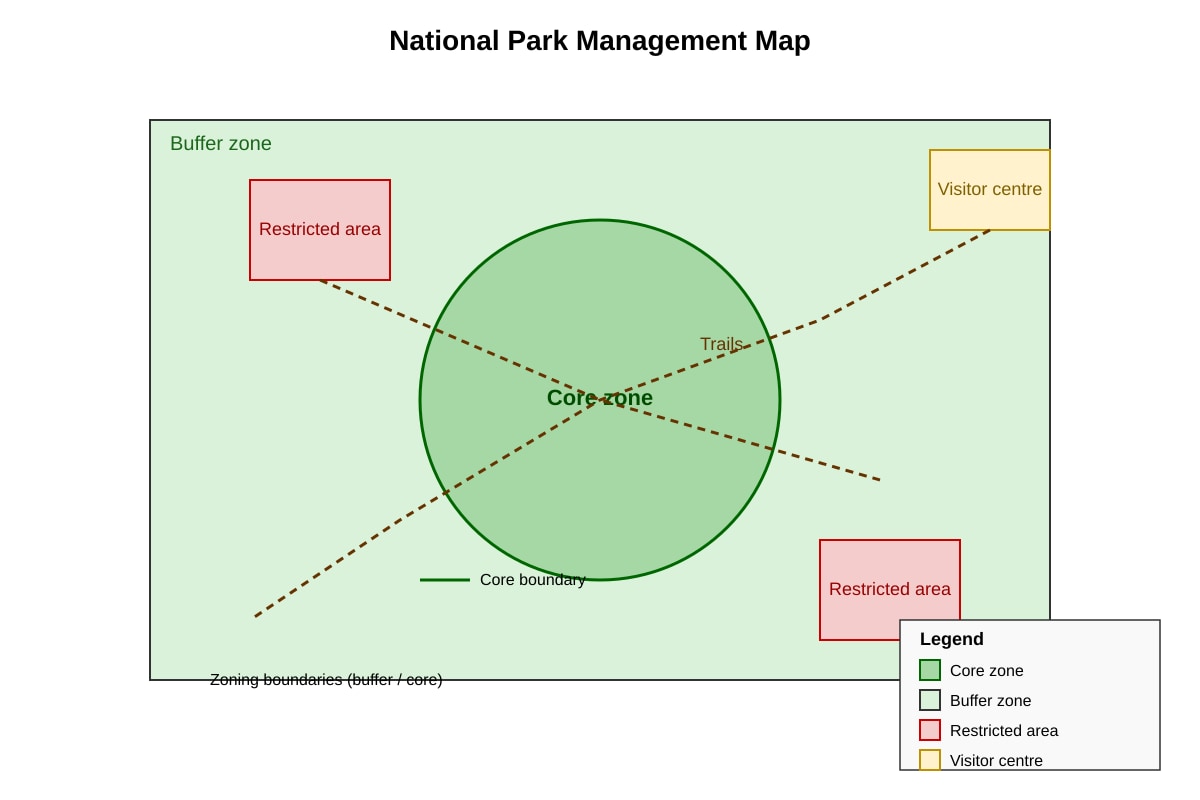
8. Study Map 1 below.
Image pending generation: map for Q8.
With reference to Map 1, explain how zoning helps conserve the ecosystem. [2]
Section B: Graph Construction and Analysis (Questions 9–14) [12 marks]
9. Table 4 shows energy sources in Nation A: Coal 50%, Solar 20%, Wind 15%, Hydro 15%. Calculate the pie chart angle for Solar. [1]
10. Using Table 4 (Q9), state the angle for Hydro and plot all four categories on a pie chart (describe your plotting steps). [2]
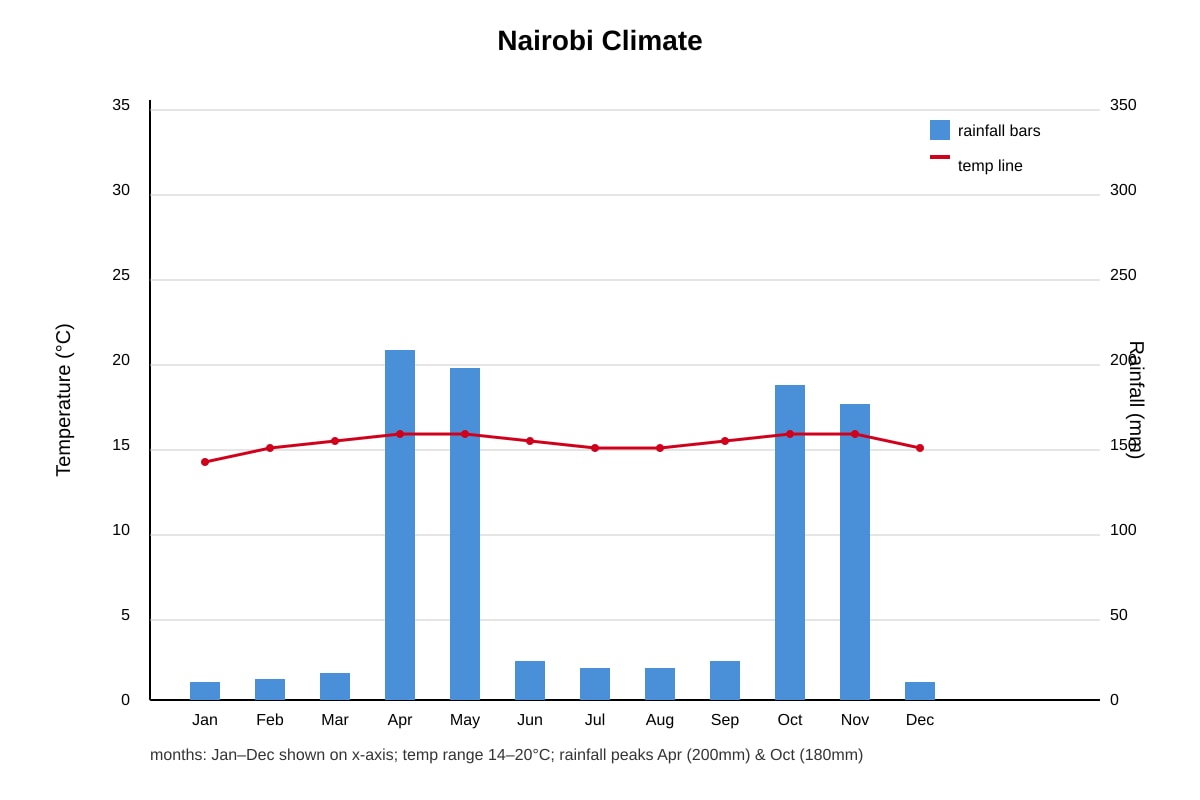
11. Study Figure 4 climate graph described below.
Image pending generation: graph for Q11.
Describe the rainfall pattern of Nairobi using Figure 4. [2]
12. With reference to Figure 4 (Q11), suggest one reason for the bimodal rainfall pattern. [1]
13. A student recorded litter counts at Beach B: 12, 15, 9, 14, 10 pieces in 5 quadrats. Calculate the mean litter count. Show working. [2]
14. Study Table 5 showing population density (persons/km²) in 3 districts: North 1200, Central 3500, South 800. Construct a bar graph description with axis labels and values. [2]
Section C: Applied Data Skills (Questions 15–20) [12 marks]
15. A fieldwork study uses systematic sampling every 50m along a transect. Explain one advantage of this method. [1]
16. Study Table 6: Visitor satisfaction scores (1-5) at Park C: Weekday 4.2, Weekend 3.1. Explain the trend. [2]
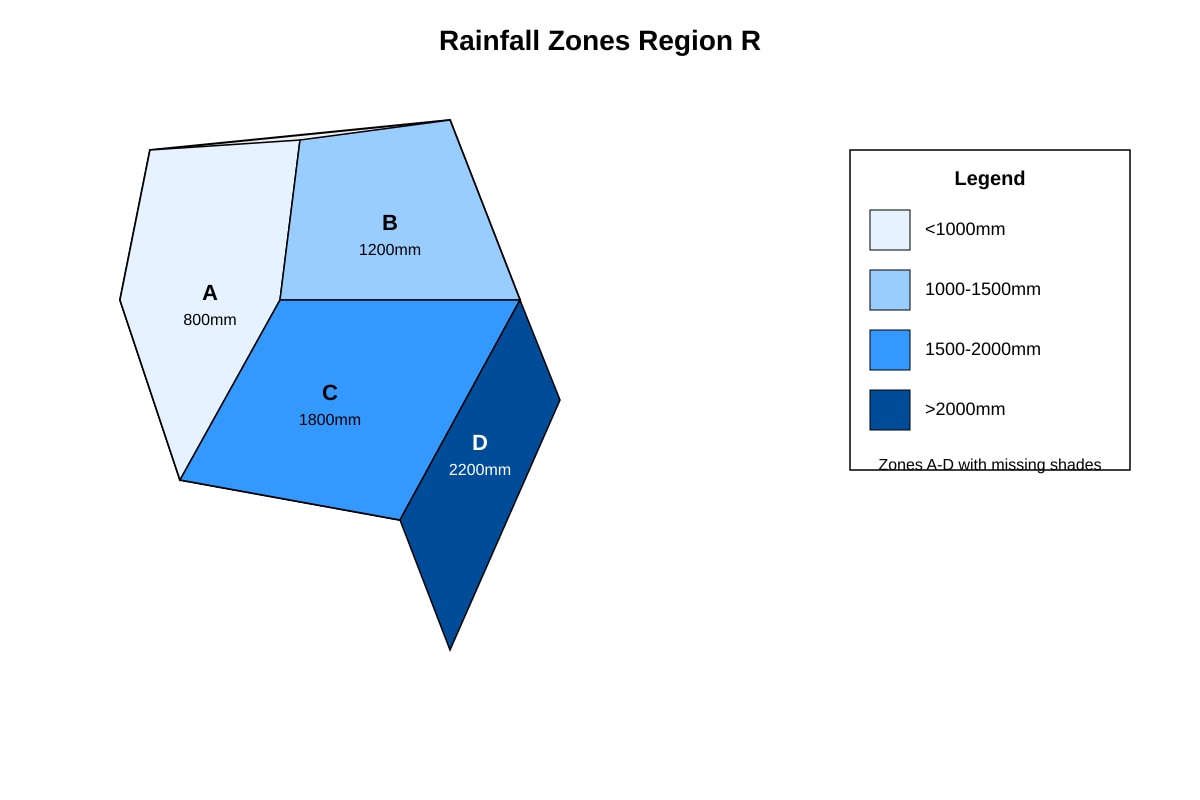
17. Figure 5 shows an incomplete choropleth map of rainfall zones.
Image pending generation: map for Q17.
With reference to Table 7 (A=800, B=1200, C=1800, D=2200mm), state the shading class for Zone C. [1]
18. Calculate the percentage increase in tourist arrivals from 15.2m (2015) to 19.1m (2019). Show working. [2]
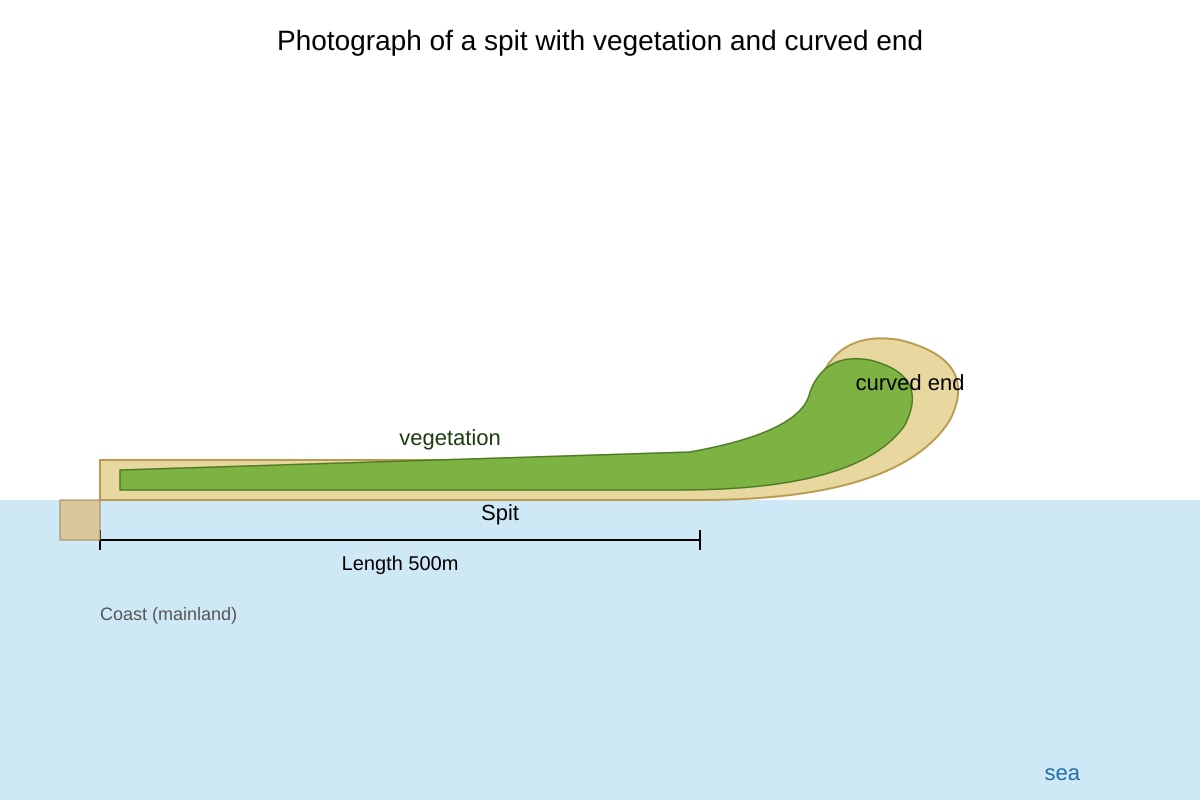
19. Study Photograph B described below.
Image pending generation: source_image for Q19.
Identify the landform and explain its formation process briefly. [3]
20. A questionnaire asks: "How often do you visit parks?" with options Daily, Weekly, Monthly, Never. State one improvement to make this question more geographical. [1]
End of Paper
Total Marks: 40
Answers
TuitionGoWhere Practice Paper Answer Key — Geography Secondary 4 (Version 5)
Subject: Geography
Level: Secondary 4
Paper: Practice Paper (Map Graph Data Skills)
Total Marks: 40
Section A Answers (16 marks)
Q1 [2]
Answer: Temperature is consistently high throughout the year, ranging from 27°C to 28°C with very little variation (annual range only 1°C).
Teaching note: Student should state both the high value and low variation. Mark breakdown: 1 mark for "high temp 27-28°C", 1 mark for "small variation / range 1°C".
Q2 [2]
Working: 180+160+200+240+220+140+120+130+160+210+250+220 = 2230 mm
Answer: Total annual rainfall = 2230 mm.
Teaching note: Add all 12 monthly values. Show sum. Common mistake: omitting a month.
Q3 [1]
Answer: Tourist arrivals increased steadily from 15.2 million in 2015 to 19.1 million in 2019.
Teaching note: Trend is upward; accept "rose" or "grew".
Q4 [2]
Answer: Largest to smallest circle: Thailand (40%), Indonesia (25%), Malaysia (20%), Philippines (10%), Vietnam (5%).
Teaching note: Proportional symbols use percentage size. 1 mark order, 1 mark correct mapping.
Q5 [3]
Answer: Landform: coastal stack (1). Features: (a) vertical rock column separated from mainland cliff (1); (b) wave-cut platform at base/foreground (1).
Teaching note: Identify type then describe observable evidence from photo.
Q6 [2]
Answer: Destructive waves (1). Characteristics: high steep waves (~3m), backwash stronger/longer than swash, frequent (>10/min) (1).
Teaching note: Link diagram evidence to destructive type.
Q7 [2]
Angle Residential = 45% × 360° = 162°.
Answer: 162° (2 marks if working shown; 1 for correct value only if working omitted but instructed).
Teaching note: (value/total)×360 = (45/100)×360.
Q8 [2]
Answer: Core zone restricts human entry protecting wildlife (1); buffer zone allows limited use reducing pressure on core (1).
Teaching note: Use map labels to explain conservation.
Section B Answers (12 marks)
Q9 [1]
Angle Solar = 20% × 360° = 72°. Answer: 72°.
Q10 [2]
Hydro angle = 15% × 360° = 54° (1). Plot steps: draw circle, use protractor for each: Coal 180°, Solar 72°, Wind 54°, Hydro 54°; label and add legend (1).
Q11 [2]
Answer: Bimodal rainfall with peaks in Apr-May (~200mm) and Oct-Nov (~180mm), lower mid-year (1); overall annual rainfall moderate (1).
Q12 [1]
Answer: Equatorial ITCZ movement causes two rainy seasons (or monsoonal shift).
Q13 [2]
Mean = (12+15+9+14+10)/5 = 60/5 = 12 pieces/quadrat.
Answer: 12. Working shown for 2 marks.
Q14 [2]
Answer: Bar graph with X: districts (North, Central, South), Y: density. Bars: North 1200, Central 3500, South 800 (2 for correct description).
Section C Answers (12 marks)
Q15 [1]
Answer: Systematic sampling ensures even coverage along transect / reduces bias.
Q16 [2]
Answer: Satisfaction higher on weekday (4.2) than weekend (3.1) (1); likely due to overcrowding on weekends (1).
Q17 [1]
Answer: Zone C (1800mm) falls in 1500-2000mm class.
Q18 [2]
% increase = ((19.1-15.2)/15.2)×100 = (3.9/15.2)×100 ≈ 25.7%.
Answer: 25.7% (2 marks with working).
Q19 [3]
Answer: Spit (1). Formed by longshore drift depositing sediment parallel to coast (1); curved end from changing wave direction (1).
Q20 [1]
Answer: Add location of park or distance from home to make spatial.
Total Marks: 40 — verified.
Free quiz and exam paper access
Enter your details to view this paper
Your access is remembered on this device.