AI Generated Exam Paper
Secondary 4 Geography Practice Paper 4
Free Sec 4 Geography Practice Paper 4, HY3 AI version, with questions, answers, and O Level-style practice for Singapore students.
These static practice materials are generated from the site's syllabus and paper-generation workflow, with source and model context shown so students and parents can evaluate the material before use.
Questions
TuitionGoWhere Practice Paper - Geography Secondary 4
TuitionGoWhere Practice Paper (AI) — Version 4 of 5
Subject: Geography
Level: Secondary 4
Paper: Practice Paper (Topic: Map Graph Data Skills)
Duration: 60 minutes
Total Marks: 40
Name: __________________________
Class: ____________
Date: ____________
Instructions:
- This practice paper contains 20 questions on Map, Graph & Data Skills.
- Answer all questions in the spaces provided.
- Use the data, maps, and figures carefully. Show your working where calculation is needed.
- Marks for each question are shown in brackets [ ].
- Section marks and total marks are given at the end of each section.
Section A: Data Interpretation from Tables and Graphs (Questions 1–8) [16 marks]
1. Study Table 1 which shows the monthly average temperature and rainfall for City X.
| Month | Jan | Feb | Mar | Apr | May | Jun | Jul | Aug | Sep | Oct | Nov | Dec |
|---|---|---|---|---|---|---|---|---|---|---|---|---|
| Temp (°C) | 27 | 27 | 28 | 28 | 28 | 27 | 27 | 27 | 27 | 27 | 27 | 27 |
| Rainfall (mm) | 180 | 160 | 200 | 240 | 220 | 120 | 100 | 110 | 140 | 190 | 210 | 190 |
Describe the annual temperature pattern of City X. [2]
2. Using the same Table 1 in Q1, calculate the total annual rainfall for City X. Show your working. [2]
3. Study Table 2 which shows the origin of tourists to Country Y in 2023.
| Region | Asia | Europe | Americas | Africa | Oceania |
|---|---|---|---|---|---|
| Visitors (000s) | 820 | 310 | 150 | 40 | 80 |
Calculate the angle for the "Asia" sector if a pie chart is drawn to represent this data. [2]
4. With reference to Table 2 in Q3, which region contributed the smallest number of visitors? [1]
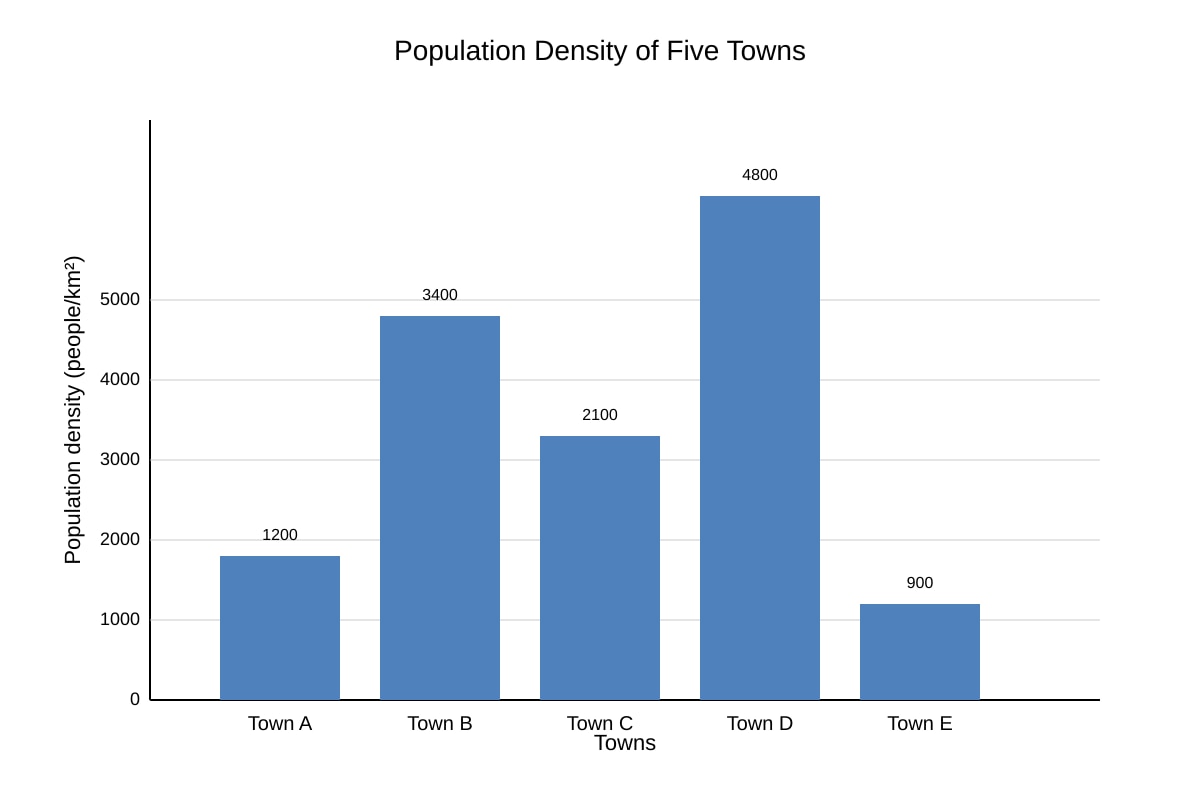
5. Study Figure 1 which shows a bar graph of population density (people per km²) for five towns.
Image pending generation: graph for Q5.
State the town with the highest population density. [1]
6. Using Figure 1 in Q5, calculate the difference in population density between Town D and Town E. [2]
7. Study Table 3 which shows the land use (%) of a Singapore neighbourhood.
| Land use | Residential | Commercial | Park | Industrial | Transport |
|---|---|---|---|---|---|
| % | 45 | 15 | 20 | 10 | 10 |
What percentage of land is used for non-residential purposes? [2]
8. With reference to Table 3 in Q7, suggest one reason why parks make up 20% of the land use. [2]
Section B: Map and Photograph Skills (Questions 9–14) [12 marks]
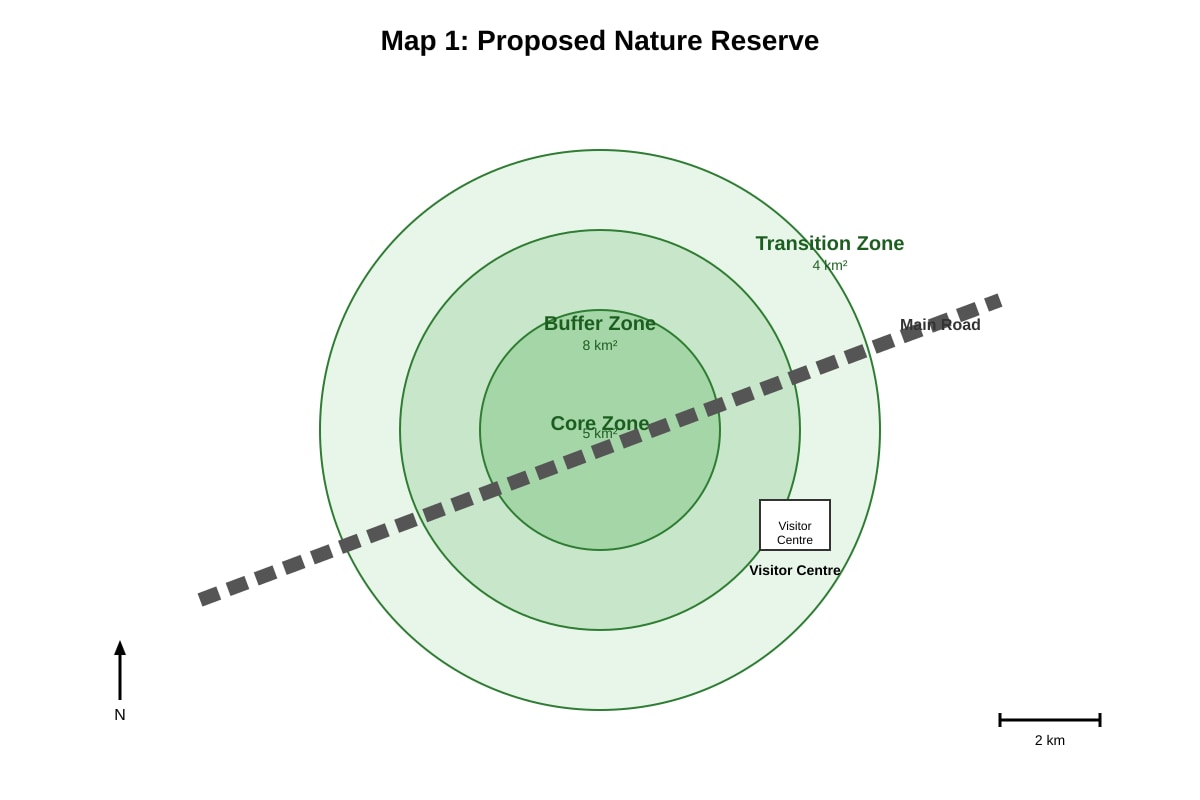
9. Study Map 1 which shows a proposed nature reserve with zones.
Image pending generation: map for Q9.
With reference to Map 1, name the zone that restricts human entry the most. [1]
10. Using Map 1 in Q9, explain how the buffer zone helps conserve the core zone. [2]
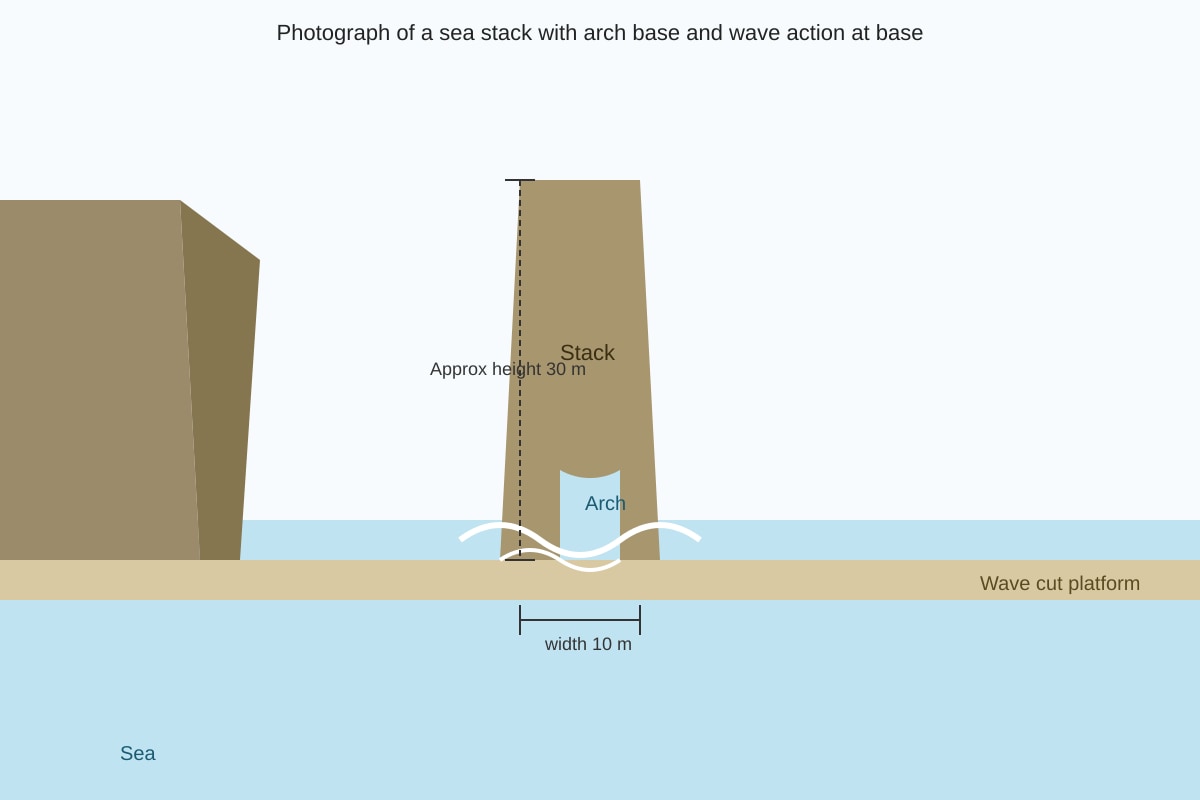
11. Study Photograph A which shows a coastal landform.
Image pending generation: source_image for Q11.
Identify the coastal landform shown in Photograph A. [1]
12. With reference to Photograph A in Q11, describe two observable features of the landform. [2]
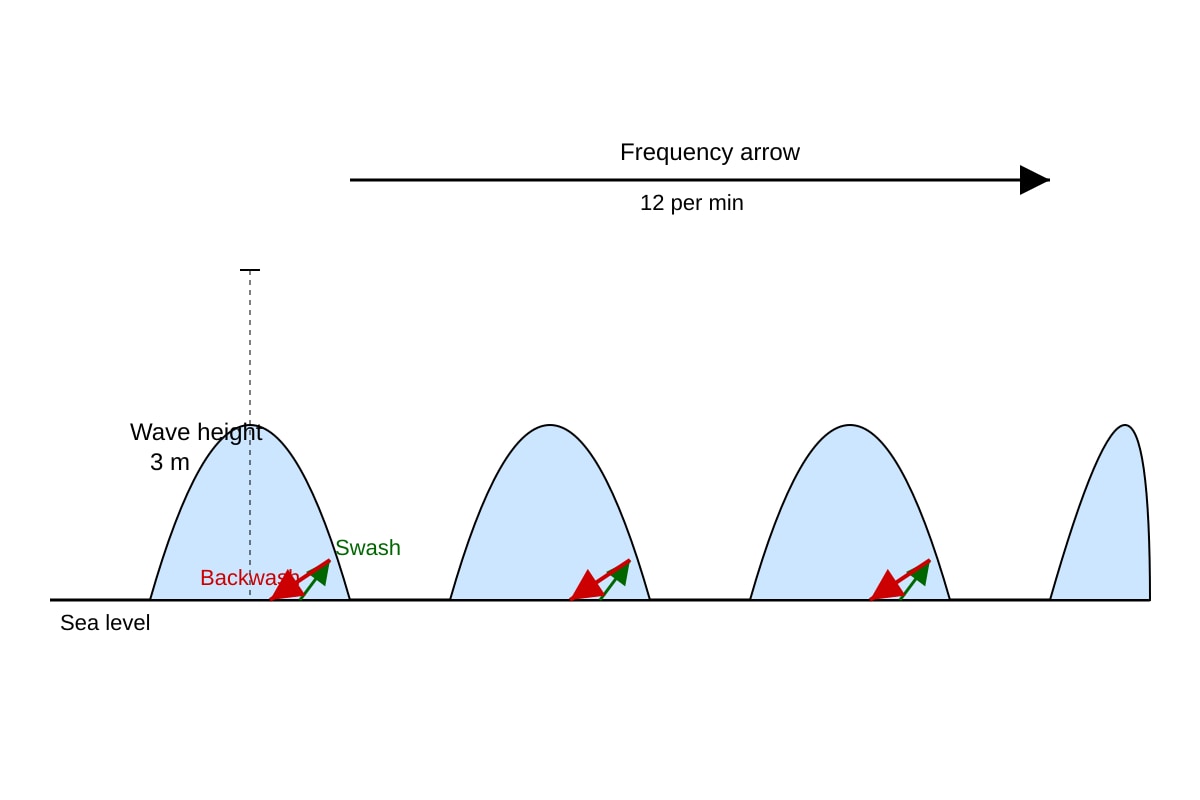
13. Study Figure 2 which shows wave characteristics at a coast.
Image pending generation: diagram for Q13.
Describe the type of waves shown in Figure 2. [2]
14. Using Figure 2 in Q13, give one visible characteristic that shows the waves are destructive. [2]
Section C: Graph Construction and Fieldwork Data (Questions 15–20) [12 marks]
15. Table 4 shows the mode of transport used by students to school.
| Mode | Walk | Bus | MRT | Car | Cycle |
|---|---|---|---|---|---|
| Students | 40 | 80 | 60 | 20 | 10 |
Plot a pie chart to represent the data. Show the angle calculations. [3]
16. Using your pie chart from Q15, what is the angle for "Bus"? [1]
17. A student did a fieldwork study on litter count at East Coast Park. She used systematic sampling every 100 m along a 1 km transect. Explain one advantage of systematic sampling. [2]
18. Study Table 5 which shows questionnaire results on favourite outdoor activity.
| Activity | Walking | Cycling | Picnic | Sports |
|---|---|---|---|---|
| Responses | 50 | 30 | 40 | 30 |
With reference to Table 5, which activity had the highest response? [1]
19. A geography student wants to map temperature variation in a school compound. Describe a suitable primary data collection method including instrument. [2]
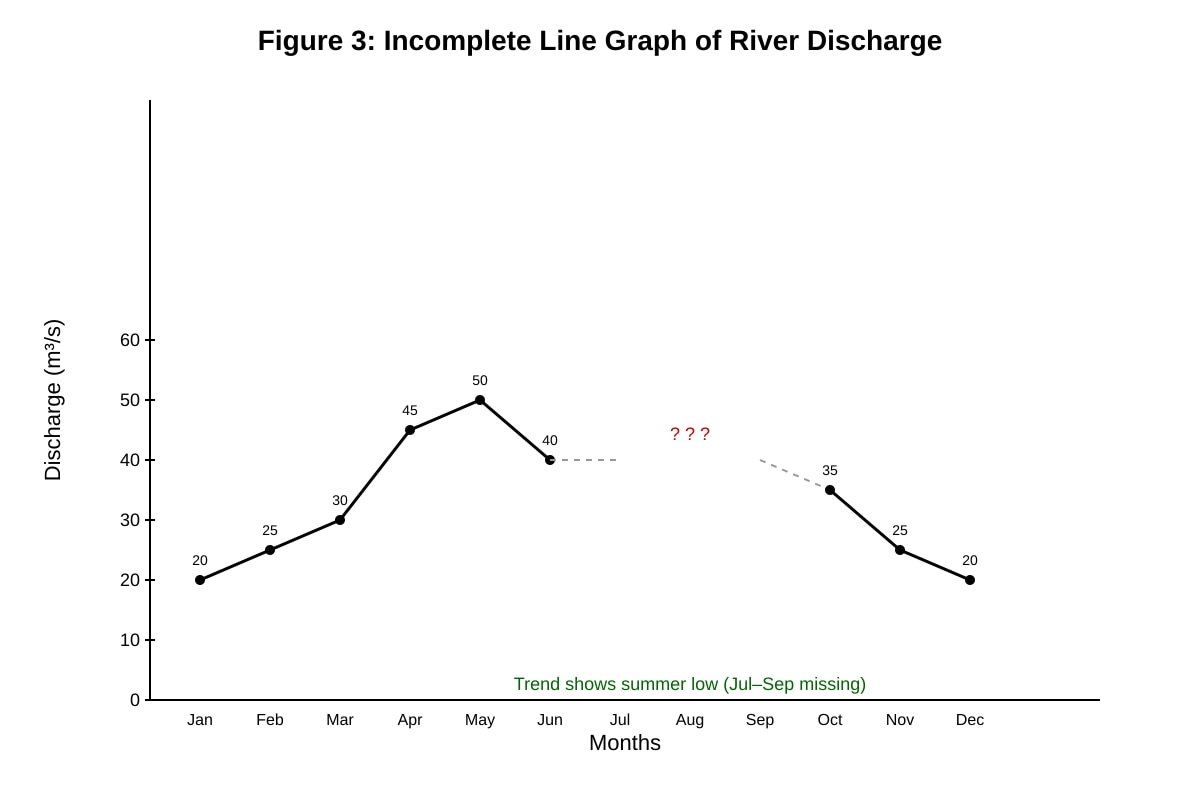
20. Study Figure 3 which is an incomplete line graph of river discharge over a year.
Image pending generation: graph for Q20.
With reference to Figure 3, describe the trend from Jan to Jun. [2]
End of Paper
Total Marks: 40
Answers
TuitionGoWhere Practice Paper Answer Key — Geography Secondary 4 (Version 4)
Topic: Map Graph Data Skills
Total Marks: 40
Section A Answers (16 marks)
Q1. [2] Temperature remains high throughout the year, between 27°C and 28°C, with very little variation (range of only 1°C).
Teaching note: Read the Temp row across months. Constant high values near equator indicate low annual temperature range. 1 mark for "high and steady", 1 mark for specific values/range.
Q2. [2] Total = 180+160+200+240+220+120+100+110+140+190+210+190 = 1960 mm.
Working: Sum all rainfall values. 1 mark for correct sum, 1 mark for showing working. Common mistake: copying one month wrongly.
Q3. [2] Total visitors = 820+310+150+40+80 = 1400 (000s). Angle = (820 ÷ 1400) × 360° = 210.9° ≈ 211°.
Steps: Find total, then proportion × 360°. 1 mark calc, 1 mark answer. Use nearest degree.
Q4. [1] Africa (40 000 visitors).
Note: Smallest value in table.
Q5. [1] Town D (4800 people/km²).
From graph bars, D tallest.
Q6. [2] 4800 – 900 = 3900 people/km².
1 mark subtraction, 1 mark correct unit.
Q7. [2] Non-residential = 15+20+10+10 = 55%.
Add commercial, park, industrial, transport. 1 mark for sum, 1 mark answer.
Q8. [2] Parks provide ecosystem services (e.g., recreation, cooling) and support sustainable urban neighbourhoods.
Any valid reason: 1 mark point, 1 mark elaboration. Syllabus link: sustainable development.
Section B Answers (12 marks)
Q9. [1] Core Zone.
Most restricted per map labels.
Q10. [2] Buffer zone absorbs human impact (e.g., from visitor centre, roads) before reaching core, protecting biodiversity.
1 mark for function, 1 mark link to map feature.
Q11. [1] Sea stack (with arch base).
Identify landform type.
Q12. [2] Features: (1) isolated rock column detached from mainland; (2) arch opening at base; (3) wave-cut platform at sea level. Any two: 1 mark each.
Q13. [2] Destructive waves. Characteristics: high steep waves (3 m), frequent (12/min), backwash > swash.
1 mark type, 1 mark two characteristics.
Q14. [2] Backwash arrows longer/more powerful than swash, showing net erosion.
1 mark observation, 1 mark link to destructiveness.
Section C Answers (12 marks)
Q15. [3] Total = 40+80+60+20+10 = 210.
Angles: Walk (40/210)×360=68.6°, Bus (80/210)×360=137.1°, MRT (60/210)×360=102.9°, Car (20/210)×360=34.3°, Cycle (10/210)×360=17.1°.
Plot pie with title and legend. 1 mark angles, 1 mark accurate plot, 1 mark title/legend.
Q16. [1] 137° (from Q15).
Q17. [2] Systematic sampling gives even coverage along transect and reduces bias.
1 mark even coverage, 1 mark reduced bias.
Q18. [1] Walking (50 responses).
Q19. [2] Use digital thermometer at fixed points (e.g., every 50 m) at same time of day to record temperature.
1 mark method, 1 mark instrument.
Q20. [2] Discharge increases from 20 (Jan) to peak 50 (May) then declines to 40 (Jun).
1 mark increase, 1 mark peak and decline.
Total Marks Check: Section A 16 + B 12 + C 12 = 40 ✓
Free quiz and exam paper access
Enter your details to view this paper
Your access is remembered on this device.