AI Generated Exam Paper
Secondary 4 Geography Practice Paper 4
Free Sec 4 Geography Practice Paper 4, DeepSeek AI version, with questions, answers, and O Level-style practice for Singapore students.
These static practice materials are generated from the site's syllabus and paper-generation workflow, with source and model context shown so students and parents can evaluate the material before use.
Questions
TuitionGoWhere Practice Paper - Geography Secondary 4
TuitionGoWhere Practice Paper (AI) Version 4
Subject: Geography Level: Secondary 4 Paper: Practice Paper 4 – Map, Graph & Data Skills Duration: 1 hour 30 minutes Total Marks: 60
Name: _________________________ Class: _________________________ Date: _________________________
Instructions to Candidates
- This paper consists of four sections (A, B, C, D). Answer all questions.
- Write your answers in the spaces provided.
- Marks for each question are indicated in square brackets [ ].
- The total mark for this paper is 60.
- You are advised to spend approximately 5 minutes reading the resource booklet before beginning your answers.
- Where appropriate, support your answers with evidence from the figures, tables, and maps provided.
- Calculators may be used where necessary.
Resource Booklet
Figure 1: Visitor Arrivals to Singapore (2010–2022)
| Year | Visitor Arrivals (millions) |
|---|---|
| 2010 | 11.6 |
| 2012 | 14.5 |
| 2014 | 15.1 |
| 2016 | 16.4 |
| 2018 | 18.5 |
| 2020 | 2.7 |
| 2022 | 6.3 |
Figure 2: Land Use in Town X (2023)
| Land Use Type | Area (hectares) |
|---|---|
| Residential | 120 |
| Commercial | 45 |
| Industrial | 30 |
| Parks & Recreation | 55 |
| Transport Infrastructure | 25 |
| Others | 15 |
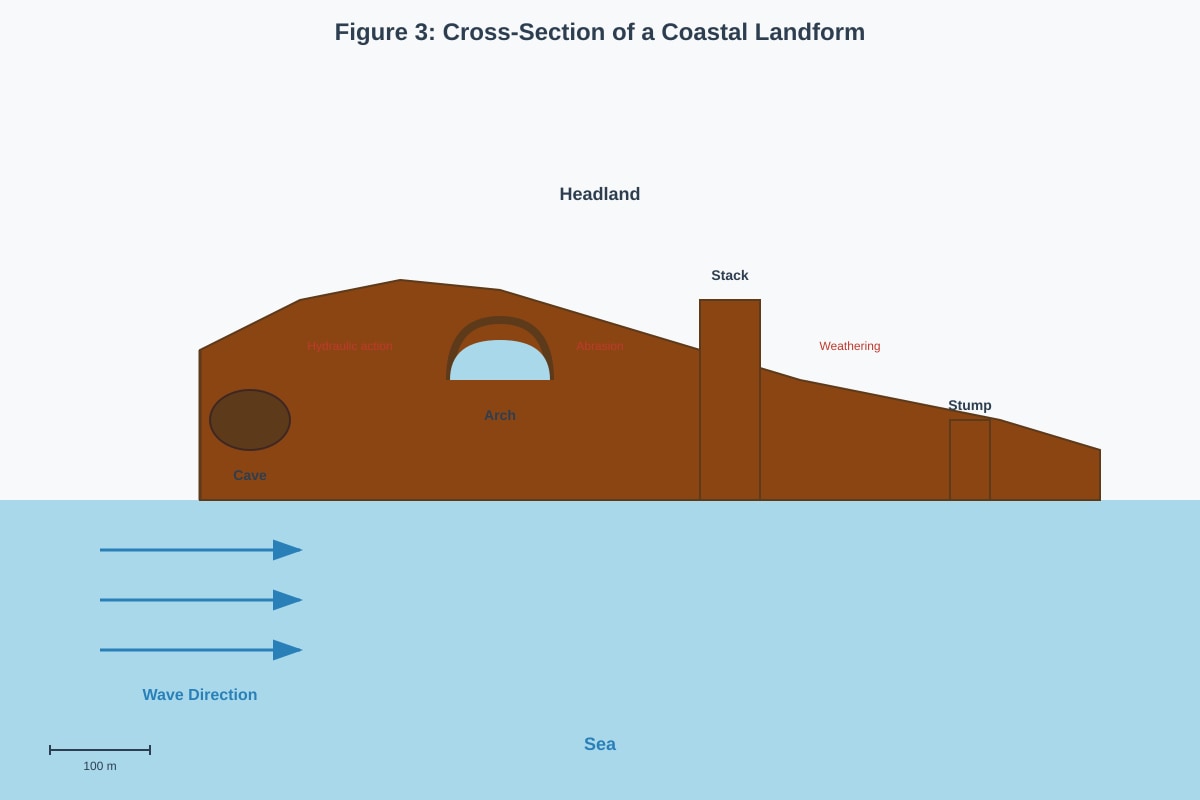
Figure 3: Cross-Section of a Coastal Landform
Generated diagram for this question.
Figure 4: Monthly Rainfall and Temperature for Station Y (2022)
| Month | Rainfall (mm) | Temperature (°C) |
|---|---|---|
| Jan | 250 | 26 |
| Feb | 230 | 26 |
| Mar | 280 | 27 |
| Apr | 300 | 27 |
| May | 180 | 28 |
| Jun | 160 | 28 |
| Jul | 150 | 27 |
| Aug | 140 | 27 |
| Sep | 170 | 27 |
| Oct | 220 | 27 |
| Nov | 290 | 26 |
| Dec | 310 | 26 |
Figure 5: Map of a Coastal Settlement
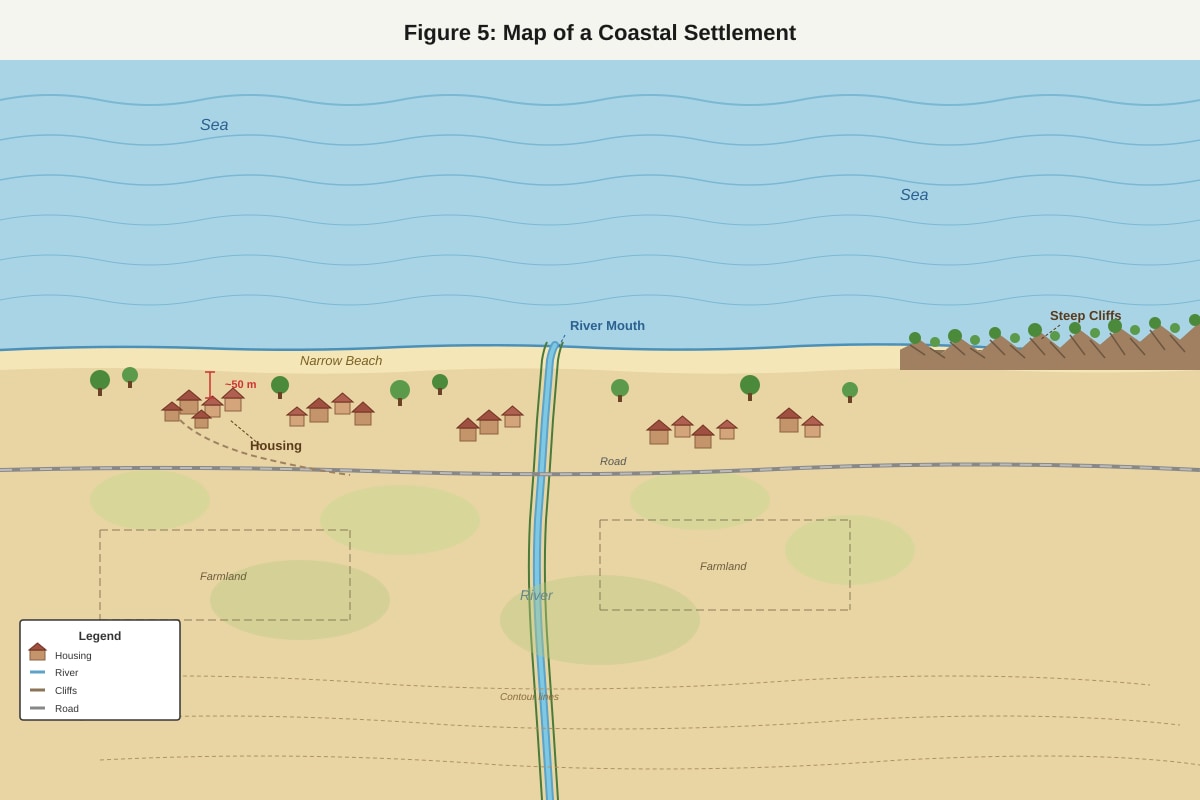
Generated map for this question.
Figure 6: Tourist Expenditure by Category in Country Z (2022)
| Expenditure Category | Percentage (%) |
|---|---|
| Accommodation | 35 |
| Food & Beverage | 25 |
| Transport | 15 |
| Shopping | 15 |
| Entertainment | 10 |
Section A: Data Interpretation and Graph Skills
[20 marks] Answer all questions in this section.
1. Study Figure 1, which shows visitor arrivals to Singapore from 2010 to 2022.
(a) Describe the general trend in visitor arrivals between 2010 and 2018. [2]
(b) Calculate the percentage decrease in visitor arrivals between 2018 and 2020. Show your working. [2]
(c) Suggest one reason for the change in visitor arrivals observed between 2018 and 2020. [2]
(d) Using the data in Figure 1, construct a line graph to show visitor arrivals to Singapore from 2010 to 2022. Include a title, labelled axes, and accurate plotting. [4]
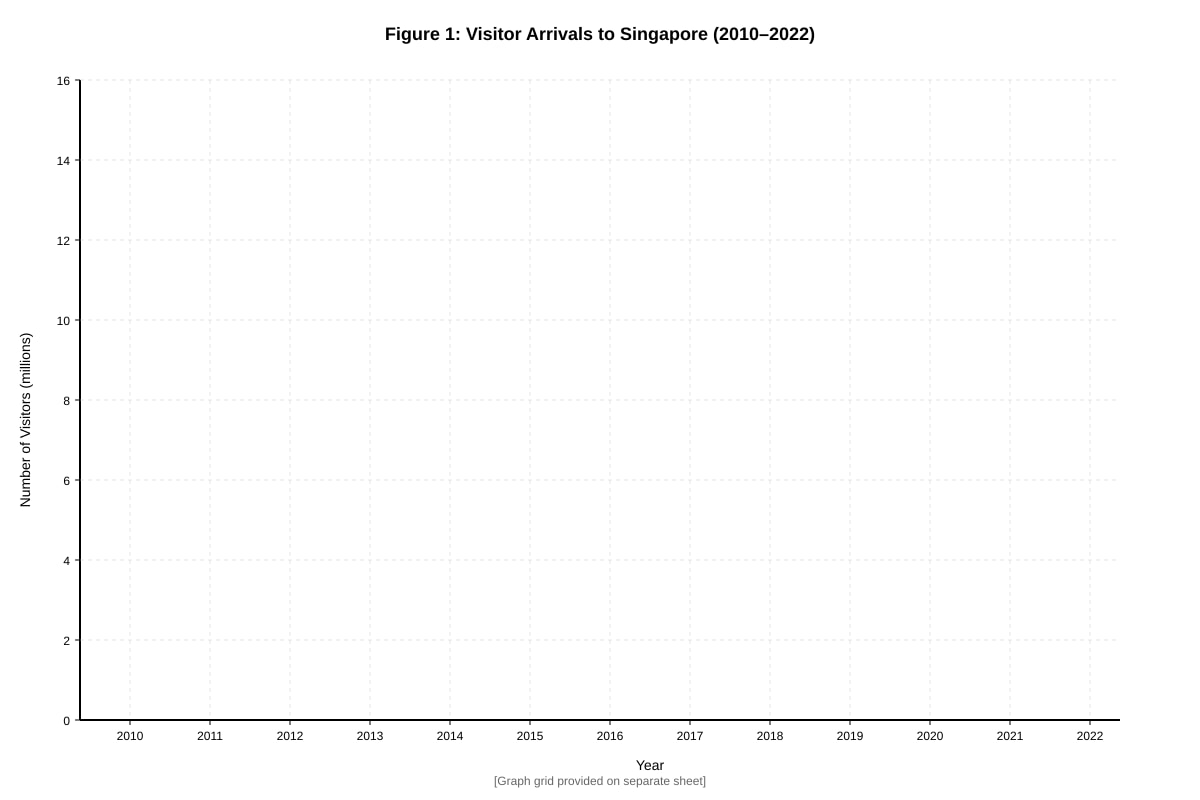
Generated graph for this question.
2. Study Figure 2, which shows land use in Town X in 2023.
(a) Calculate the total area of Town X. [1]
(b) Calculate the percentage of land used for Parks & Recreation. Show your working and give your answer to one decimal place. [2]
(c) Construct a pie chart to represent the land use data in Figure 2. Include a title, accurate angle calculations, and a legend. [5]
[Pie chart to be drawn on separate sheet]
(d) Identify the land use type that occupies the second largest area in Town X. [1]
(e) Suggest one reason why Parks & Recreation might be an important land use in a sustainable town. [1]
Section B: Map and Photograph Interpretation
[15 marks] Answer all questions in this section.
3. Study Figure 3, which shows a cross-section of a coastal landform sequence.
(a) Identify the coastal landforms labelled A, B, and C in Figure 3. [3]
A: _______________________________________________________________________________
B: _______________________________________________________________________________
C: _______________________________________________________________________________
(b) Explain the process by which landform A is formed. [3]
(c) With reference to Figure 3, explain how landform B will eventually become landform C. [3]
4. Study Figure 5, which shows a map of a coastal settlement.
(a) Using evidence from Figure 5, describe two ways in which the physical environment poses challenges for the residents of this settlement. [4]
(b) Suggest one strategy the settlement could adopt to reduce the risk from coastal hazards. Explain your answer. [2]
Section C: Climate and Weather Data Skills
[15 marks] Answer all questions in this section.
5. Study Figure 4, which shows monthly rainfall and temperature data for Station Y in 2022.
(a) Calculate the total annual rainfall for Station Y. [1]
(b) Calculate the mean monthly temperature for Station Y. Show your working and give your answer to one decimal place. [2]
(c) Construct a climograph to represent the data in Figure 4. Use a bar graph for rainfall and a line graph for temperature. Include a title, labelled axes, and accurate plotting. [6]
[Climograph to be drawn on separate sheet]
(d) Based on the climograph you have drawn, identify the climate type of Station Y. Support your answer with two pieces of evidence from the data. [3]
(e) Explain why Station Y experiences high rainfall in the months of November to January. [3]
Section D: Tourism and Data Application
[10 marks] Answer all questions in this section.
6. Study Figure 6, which shows tourist expenditure by category in Country Z in 2022.
(a) Identify the category with the highest percentage of tourist expenditure. [1]
(b) Explain two reasons why the category identified in (a) might account for the largest share of tourist spending. [4]
(c) Using the data in Figure 6, construct a bar graph to represent tourist expenditure by category. Include a title, labelled axes, and accurate plotting. [5]
[Bar graph to be drawn on separate sheet]
END OF PAPER
This practice paper was generated by TuitionGoWhere AI for educational purposes. It is not derived from any specific past-year examination paper.
Answers
TuitionGoWhere Practice Paper - Geography Secondary 4
Answer Key and Marking Scheme – Version 4
Paper: Practice Paper 4 – Map, Graph & Data Skills Total Marks: 60
Section A: Data Interpretation and Graph Skills [20 marks]
Question 1: Visitor Arrivals to Singapore [10 marks]
(a) Describe the general trend in visitor arrivals between 2010 and 2018. [2]
Answer: Visitor arrivals to Singapore showed a steady and consistent increase from 11.6 million in 2010 to 18.5 million in 2018. [1 mark] The growth was continuous over the period, with an overall increase of approximately 6.9 million visitors across the eight years. [1 mark]
Marking notes:
- Award 1 mark for identifying the increasing trend.
- Award 1 mark for providing specific data evidence (start and end figures, or magnitude of change).
- Accept: "rising trend," "upward trend," "general increase."
(b) Calculate the percentage decrease in visitor arrivals between 2018 and 2020. Show your working. [2]
Answer:
- Visitor arrivals in 2018: 18.5 million
- Visitor arrivals in 2020: 2.7 million
- Decrease: 18.5 – 2.7 = 15.8 million [1 mark for correct subtraction]
- Percentage decrease: (15.8 ÷ 18.5) × 100 = 85.4% [1 mark for correct calculation]
Marking notes:
- Award 1 mark for correct working (showing subtraction).
- Award 1 mark for correct answer (85.4% or 85.41%).
- Accept answers rounded to 85% if working is shown correctly.
- Do not penalise for missing percentage sign if value is correct.
(c) Suggest one reason for the change in visitor arrivals observed between 2018 and 2020. [2]
Answer: The sharp decline in visitor arrivals between 2018 and 2020 was primarily due to the COVID-19 pandemic. [1 mark] International travel restrictions, border closures, and lockdowns implemented globally from early 2020 severely reduced the number of tourists able to visit Singapore. [1 mark]
Marking notes:
- Award 1 mark for identifying the COVID-19 pandemic as the reason.
- Award 1 mark for explaining how it caused the decline (travel restrictions, border closures, health concerns, reduced flights).
- Accept other plausible reasons if well-explained (e.g., global economic recession), but COVID-19 is the expected answer given the timing.
(d) Using the data in Figure 1, construct a line graph to show visitor arrivals to Singapore from 2010 to 2022. Include a title, labelled axes, and accurate plotting. [4]
Answer:
- Title (1 mark): Appropriate title, e.g., "Visitor Arrivals to Singapore (2010–2022)" or "Figure 1: Visitor Arrivals to Singapore, 2010–2022."
- Axes (1 mark): X-axis labelled "Year" with years 2010, 2012, 2014, 2016, 2018, 2020, 2022. Y-axis labelled "Visitor Arrivals (millions)" with appropriate scale (e.g., 0 to 20).
- Plotting (2 marks): All seven data points plotted accurately (±1 mm tolerance). Points connected with straight lines.
Marking notes:
- Award 1 mark for correct and complete title.
- Award 1 mark for correctly labelled axes with units.
- Award 2 marks for accurate plotting of all points; deduct 1 mark if 1–2 points are inaccurate; deduct 2 marks if 3 or more points are inaccurate.
- Do not penalise if points are not connected, but a line graph requires connection.
Question 2: Land Use in Town X [10 marks]
(a) Calculate the total area of Town X. [1]
Answer: Total area = 120 + 45 + 30 + 55 + 25 + 15 = 290 hectares
Marking notes:
- Award 1 mark for correct answer (290 hectares).
- Accept answer without units if value is correct.
(b) Calculate the percentage of land used for Parks & Recreation. Show your working and give your answer to one decimal place. [2]
Answer:
- Parks & Recreation area: 55 hectares
- Total area: 290 hectares
- Percentage: (55 ÷ 290) × 100 = 18.9655...% = 19.0% (to one decimal place) [1 mark for working, 1 mark for correct answer]
Marking notes:
- Award 1 mark for correct formula and substitution.
- Award 1 mark for correct answer rounded to one decimal place (19.0%).
- Accept 19% if working is shown correctly.
(c) Construct a pie chart to represent the land use data in Figure 2. Include a title, accurate angle calculations, and a legend. [5]
Answer: Angle calculations:
- Residential: (120 ÷ 290) × 360° = 148.97° ≈ 149°
- Commercial: (45 ÷ 290) × 360° = 55.86° ≈ 56°
- Industrial: (30 ÷ 290) × 360° = 37.24° ≈ 37°
- Parks & Recreation: (55 ÷ 290) × 360° = 68.28° ≈ 68°
- Transport Infrastructure: (25 ÷ 290) × 360° = 31.03° ≈ 31°
- Others: (15 ÷ 290) × 360° = 18.62° ≈ 19°
Marking scheme:
- Angle calculations (2 marks): All six angles calculated correctly (±2° tolerance). Award 1 mark if 3–5 angles are correct.
- Plotting (2 marks): Sectors drawn accurately with protractor (±2° tolerance). Sectors labelled or colour-coded.
- Title and legend (1 mark): Appropriate title (e.g., "Land Use in Town X, 2023") and legend identifying each land use type.
Marking notes:
- Angles must sum to 360° (±2°).
- Legend may be replaced by direct labelling of sectors.
- Deduct 1 mark if title is missing or incomplete.
(d) Identify the land use type that occupies the second largest area in Town X. [1]
Answer: Parks & Recreation (55 hectares)
Marking notes:
- Award 1 mark for "Parks & Recreation" or "Parks and Recreation."
- Do not accept "Recreation" alone unless context is clear.
(e) Suggest one reason why Parks & Recreation might be an important land use in a sustainable town. [1]
Answer: Parks and recreation areas provide ecosystem services such as regulating urban temperatures (reducing the urban heat island effect), absorbing rainwater to reduce flood risk, and offering spaces for community interaction and physical activity, which supports social and environmental sustainability.
Marking notes:
- Award 1 mark for any valid reason linked to sustainability (environmental, social, or economic).
- Accept: "provides green space for residents' well-being," "supports biodiversity," "reduces air pollution," "offers recreational opportunities," "improves mental health."
- Answer must link to sustainability, not just state a benefit.
Section B: Map and Photograph Interpretation [15 marks]
Question 3: Coastal Landform Sequence [9 marks]
(a) Identify the coastal landforms labelled A, B, and C in Figure 3. [3]
Answer:
- A: Cave [1 mark]
- B: Arch [1 mark]
- C: Stack [1 mark]
Marking notes:
- Award 1 mark for each correct identification.
- Accept "sea cave" for A.
(b) Explain the process by which landform A is formed. [3]
Answer: A cave is formed when waves attack a line of weakness (such as a joint, fault, or crack) in the rock at the base of a headland. [1 mark] Hydraulic action forces water and compressed air into the crack, widening it, while abrasion (rocks and sediment carried by waves) grinds away at the rock. [1 mark] Over time, these erosional processes enlarge the crack into a hollow cavity called a cave. [1 mark]
Marking notes:
- Award 1 mark for identifying the starting point (line of weakness in headland).
- Award 1 mark for explaining the erosional processes (hydraulic action and/or abrasion).
- Award 1 mark for describing the outcome (enlargement into a cave).
- Accept alternative valid explanations using correct geographical terminology.
(c) With reference to Figure 3, explain how landform B will eventually become landform C. [3]
Answer: The arch (B) will eventually collapse to form a stack (C). [1 mark] Continued erosion at the base of the arch by wave action weakens the rock supporting the roof of the arch. Weathering (such as salt crystallisation and wetting-drying cycles) further weakens the rock above. [1 mark] Eventually, the roof of the arch can no longer support its own weight and collapses, leaving an isolated pillar of rock (the stack) separated from the headland. [1 mark]
Marking notes:
- Award 1 mark for stating that the arch collapses.
- Award 1 mark for explaining the processes causing collapse (erosion at base, weathering of roof).
- Award 1 mark for describing the result (formation of a stack).
- Reference to Figure 3 is expected but not mandatory for full marks if explanation is clear.
Question 4: Coastal Settlement Map [6 marks]
(a) Using evidence from Figure 5, describe two ways in which the physical environment poses challenges for the residents of this settlement. [4]
Answer:
- Challenge 1 – Coastal erosion (2 marks): The map shows a narrow beach, which indicates limited natural protection against wave attack. The steep cliffs to the east suggest active erosion, which could threaten properties located near the cliff edge. Housing located only 50 metres from the shoreline is vulnerable to erosion and potential land loss.
- Challenge 2 – Flooding (2 marks): The settlement is located at the mouth of a river, which increases flood risk during heavy rainfall or storm surges. Low-lying coastal land near the river mouth is susceptible to both river flooding and coastal inundation, threatening homes and infrastructure.
Marking notes:
- Award 2 marks for each challenge (1 mark for identifying the challenge, 1 mark for explaining with map evidence).
- Accept other valid challenges: landslides from steep cliffs, limited space for expansion, exposure to storm waves.
- Answers must reference specific features from Figure 5.
(b) Suggest one strategy the settlement could adopt to reduce the risk from coastal hazards. Explain your answer. [2]
Answer: The settlement could construct a seawall or revetment along the shoreline. [1 mark] This hard engineering structure would absorb and reflect wave energy, reducing the rate of coastal erosion and protecting the houses located 50 metres from the shore. It would also provide a barrier against storm surges, reducing flood risk. [1 mark]
Marking notes:
- Award 1 mark for identifying a valid strategy (seawall, groynes, beach nourishment, managed retreat, mangrove planting, relocation of housing).
- Award 1 mark for explaining how the strategy reduces risk.
- Explanation must be linked to the specific context of the settlement shown in Figure 5.
Section C: Climate and Weather Data Skills [15 marks]
Question 5: Climograph Construction and Interpretation [15 marks]
(a) Calculate the total annual rainfall for Station Y. [1]
Answer: Total annual rainfall = 250 + 230 + 280 + 300 + 180 + 160 + 150 + 140 + 170 + 220 + 290 + 310 = 2,680 mm
Marking notes:
- Award 1 mark for correct answer (2,680 mm).
- Accept answer without units if value is correct.
(b) Calculate the mean monthly temperature for Station Y. Show your working and give your answer to one decimal place. [2]
Answer:
- Sum of monthly temperatures: 26 + 26 + 27 + 27 + 28 + 28 + 27 + 27 + 27 + 27 + 26 + 26 = 322
- Mean monthly temperature: 322 ÷ 12 = 26.833...°C = 26.8°C (to one decimal place) [1 mark for working, 1 mark for correct answer]
Marking notes:
- Award 1 mark for correct summation and division.
- Award 1 mark for correct answer rounded to one decimal place (26.8°C).
- Accept 26.8 or 26.8°C.
(c) Construct a climograph to represent the data in Figure 4. Use a bar graph for rainfall and a line graph for temperature. Include a title, labelled axes, and accurate plotting. [6]
Answer: Marking scheme:
- Title (1 mark): Appropriate title, e.g., "Climograph for Station Y (2022)" or "Monthly Rainfall and Temperature for Station Y, 2022."
- Axes (2 marks): X-axis labelled "Month" with all 12 months (Jan–Dec). Left Y-axis labelled "Rainfall (mm)" with appropriate scale (e.g., 0–350 mm). Right Y-axis labelled "Temperature (°C)" with appropriate scale (e.g., 0–30°C or 20–30°C).
- Rainfall bars (1.5 marks): All 12 bars plotted accurately (±1 mm tolerance). Bars should be adjacent and of equal width.
- Temperature line (1.5 marks): All 12 temperature points plotted accurately and connected with a smooth line.
Marking notes:
- Award full marks for axes if both are correctly labelled with units and appropriate scales.
- Deduct 0.5 marks per error in plotting (up to maximum deduction for each element).
- Temperature line must be clearly distinguishable from rainfall bars.
(d) Based on the climograph you have drawn, identify the climate type of Station Y. Support your answer with two pieces of evidence from the data. [3]
Answer: Station Y has a tropical monsoon climate. [1 mark]
Evidence:
- Evidence 1 (1 mark): High temperatures throughout the year, with a mean monthly temperature of 26.8°C and a small annual temperature range of only 2°C (26°C to 28°C). This is characteristic of tropical climates near the equator.
- Evidence 2 (1 mark): High total annual rainfall (2,680 mm) with distinct wet and dry seasons. The wettest months are November to January (exceeding 250 mm per month), while the driest months are June to August (140–160 mm per month). This seasonal rainfall pattern is typical of a monsoon climate.
Marking notes:
- Award 1 mark for correct climate type identification (tropical monsoon or tropical wet-dry climate).
- Award 1 mark for each valid piece of evidence with data support.
- Accept "tropical monsoon climate" or "Am climate (Köppen classification)."
- Do not accept "equatorial climate" as the rainfall shows seasonality (equatorial climates have rainfall evenly distributed throughout the year).
(e) Explain why Station Y experiences high rainfall in the months of November to January. [3]
Answer: Station Y experiences high rainfall from November to January due to the influence of the Northeast Monsoon. [1 mark] During this period, the Intertropical Convergence Zone (ITCZ) shifts southward, bringing prevailing northeasterly winds that pick up moisture as they cross the South China Sea or other warm ocean waters. [1 mark] When these moisture-laden winds reach Station Y, the warm, moist air rises (convection), cools, and condenses to form heavy rain. The orographic effect may also contribute if Station Y is located near highlands. [1 mark]
Marking notes:
- Award 1 mark for identifying the monsoon mechanism (Northeast Monsoon or seasonal wind reversal).
- Award 1 mark for explaining moisture source (winds crossing warm seas).
- Award 1 mark for explaining the rainfall process (convection, condensation, or orographic lifting).
- Accept alternative explanations if geographically sound and consistent with the data.
Section D: Tourism and Data Application [10 marks]
Question 6: Tourist Expenditure Analysis [10 marks]
(a) Identify the category with the highest percentage of tourist expenditure. [1]
Answer: Accommodation (35%)
Marking notes:
- Award 1 mark for "Accommodation."
- Accept "Accommodation (35%)."
(b) Explain two reasons why the category identified in (a) might account for the largest share of tourist spending. [4]
Answer:
- Reason 1 (2 marks): Accommodation is typically the largest fixed cost for tourists. Hotels, resorts, and other lodging options charge per night, and tourists often stay for multiple nights. For example, a tourist staying seven nights at a mid-range hotel could spend a significant portion of their total trip budget on accommodation alone. Accommodation costs are relatively inelastic—tourists must pay for a place to sleep regardless of other spending choices.
- Reason 2 (2 marks): In many destinations, accommodation prices have risen due to increased demand, luxury development, and higher operating costs. Tourists may also choose higher-category accommodation (e.g., 4- or 5-star hotels) that charges premium rates, further increasing the share of expenditure on accommodation. Additionally, accommodation costs often include taxes and service charges that add to the total bill.
Marking notes:
- Award 2 marks for each well-explained reason (1 mark for identifying the reason, 1 mark for elaboration/explanation).
- Accept other valid reasons: accommodation is a necessity (non-discretionary spending), tourists prioritise comfort and safety, accommodation packages include meals/services, length of stay multiplies daily room rates.
- Reasons must be clearly explained, not just stated.
(c) Using the data in Figure 6, construct a bar graph to represent tourist expenditure by category. Include a title, labelled axes, and accurate plotting. [5]
Answer: Marking scheme:
- Title (1 mark): Appropriate title, e.g., "Tourist Expenditure by Category in Country Z (2022)" or "Figure 6: Tourist Expenditure in Country Z, 2022."
- Axes (1 mark): X-axis labelled "Expenditure Category" with all five categories. Y-axis labelled "Percentage (%)" with appropriate scale (e.g., 0–40%).
- Plotting (2 marks): All five bars plotted accurately (±1 mm tolerance). Bars should be of equal width, separated by equal gaps, and reach the correct percentage values.
- Labels (1 mark): Bars clearly labelled or a legend provided if colours/patterns are used. Percentage values may be written above each bar.
Marking notes:
- Award 1 mark for correct and complete title.
- Award 1 mark for correctly labelled axes with units.
- Award 2 marks for accurate plotting of all bars; deduct 1 mark if 1–2 bars are inaccurate; deduct 2 marks if 3 or more bars are inaccurate.
- Award 1 mark for clear labelling of bars or inclusion of a legend.
- Bars must be separate (not a histogram) as categories are discrete.
END OF ANSWER KEY
This answer key was generated by TuitionGoWhere AI for educational purposes. Marking notes are provided to guide assessment and indicate expected response depth.
Free quiz and exam paper access
Enter your details to view this paper
Your access is remembered on this device.