AI Generated Exam Paper
Secondary 4 Geography Practice Paper 3
Free Sec 4 Geography Practice Paper 3, HY3 AI version, with questions, answers, and O Level-style practice for Singapore students.
These static practice materials are generated from the site's syllabus and paper-generation workflow, with source and model context shown so students and parents can evaluate the material before use.
Questions
TuitionGoWhere Practice Paper - Geography Secondary 4
TuitionGoWhere Practice Paper (AI) — Version 3
Subject: Geography
Level: Secondary 4
Paper: Practice Paper (Map Graph Data Skills)
Duration: 1 hour 15 minutes
Total Marks: 40
Name: ________________________
Class: ________
Date: ____________
Instructions:
- This practice paper contains 20 questions across three sections.
- Answer all questions in the spaces provided.
- Use the data, figures, and tables provided to support your answers with reference where required.
- Marks for each question are shown in brackets [ ].
- Section subtotals and question marks add up to 40 marks.
Section A: Data Interpretation and Graph Skills (Questions 1–8) [16 marks]
1. Study the table below showing monthly rainfall (mm) for City X in 2023.
| Month | Jan | Feb | Mar | Apr | May | Jun | Jul | Aug | Sep | Oct | Nov | Dec |
|---|---|---|---|---|---|---|---|---|---|---|---|---|
| Rain (mm) | 20 | 35 | 60 | 120 | 200 | 250 | 240 | 210 | 180 | 90 | 40 | 25 |
Calculate the total annual rainfall for City X. [2]
2. Using the data in Question 1, describe the rainfall distribution pattern of City X. [2]
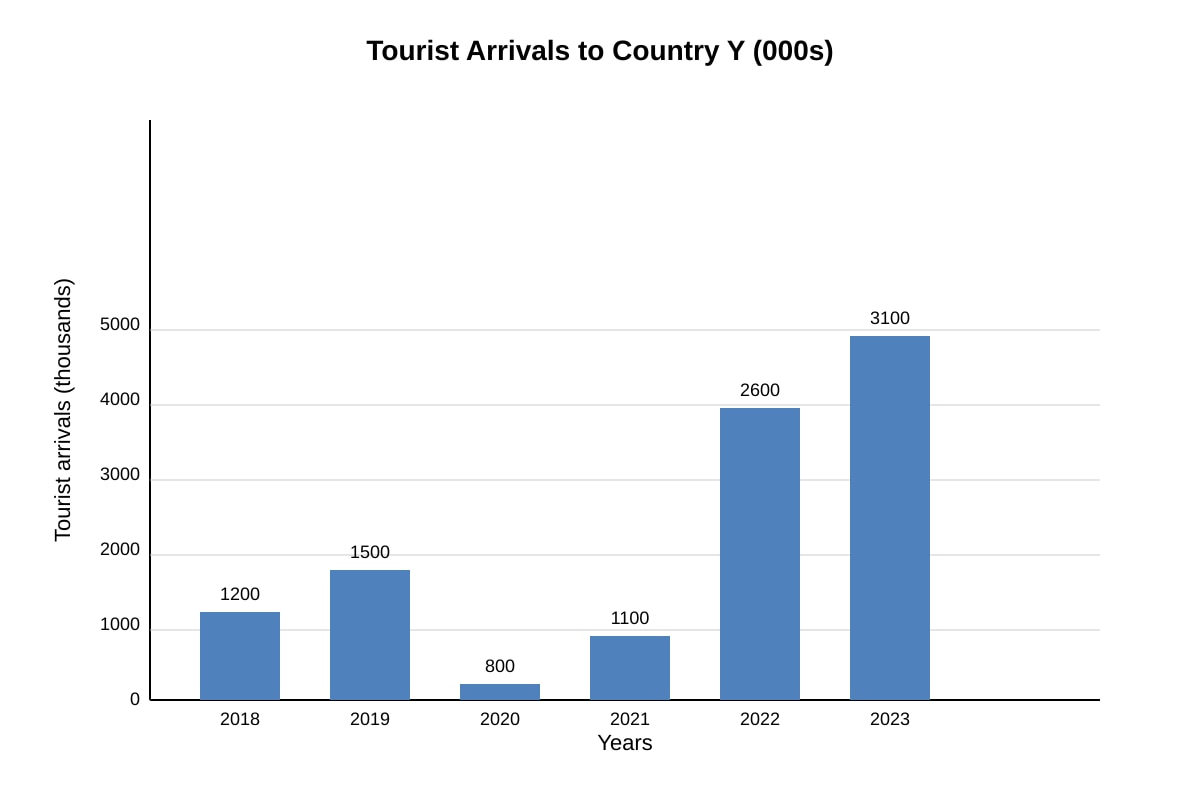
3. Study Figure 1, which shows a bar graph of tourist arrivals (in thousands) to Country Y from 2018 to 2023.
Image pending generation: graph for Q3.
With reference to Figure 1, state the year with the lowest tourist arrivals and give the value. [2]
4. Using Figure 1, calculate the percentage increase in tourist arrivals from 2021 to 2023. Show your working. [3]
5. Study the pie chart data below for energy use in Nation Z (2023): Coal 40%, Natural Gas 30%, Hydro 20%, Others 10%.
Plot a pie chart to represent this data. Show all angle calculations. [3]
6. A student drew a climate graph with temperature scale from 0°C to 40°C and rainfall scale from 0 mm to 300 mm. State one mistake the student may make when reading the graph if the scales are not clearly labelled. [1]
7. Study Table 2 showing population (millions) of three towns: Town A = 2.4, Town B = 5.1, Town C = 3.3.
| Town | Population (m) |
|---|---|
| A | 2.4 |
| B | 5.1 |
| C | 3.3 |
Construct a bar graph to represent this data on the grid provided. [2]
8. Explain why a line graph is more suitable than a pie chart for showing change in temperature over a year. [2]
Section B: Map and Photograph Skills (Questions 9–14) [12 marks]
9. Study Map 1 below showing a proposed protected forest reserve with zones: Core (shaded dark), Buffer (medium), Access (light).
Image pending generation: map for Q9.
With reference to Map 1, explain how zoning helps conserve the forest ecosystem. [3]
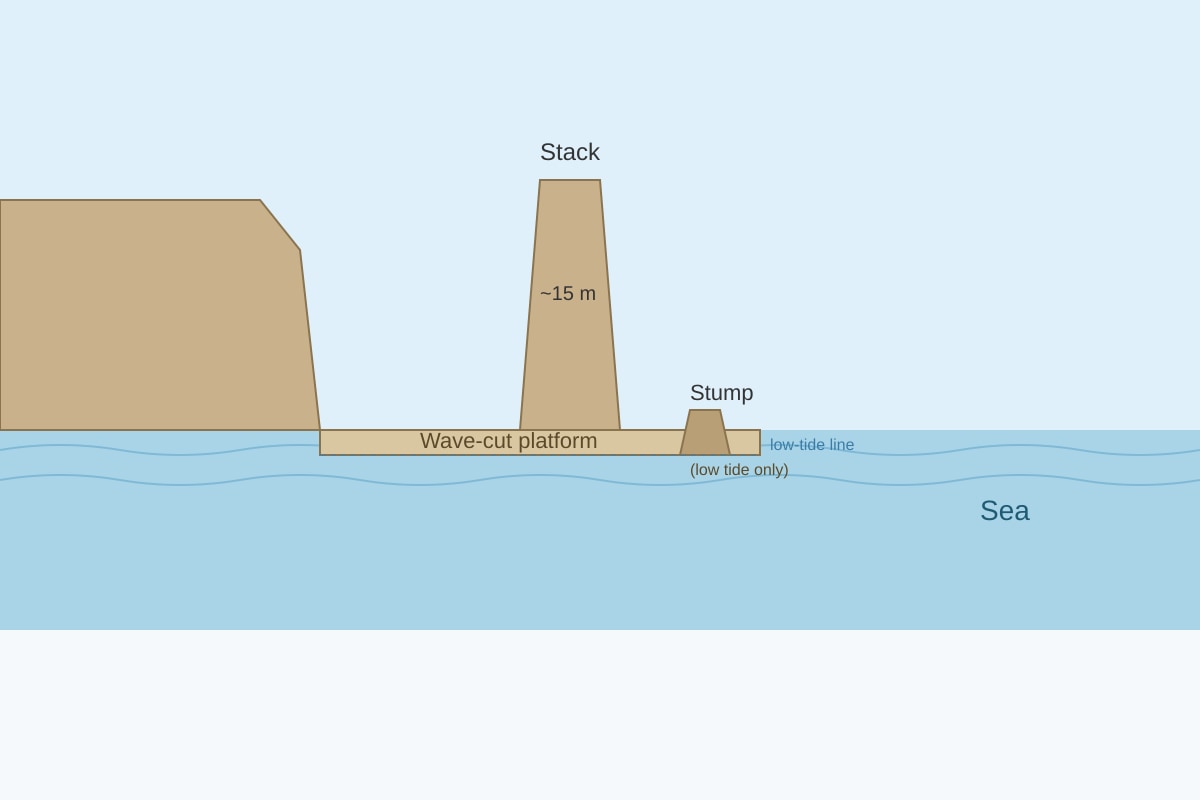
10. Study Photograph A (Figure 2) showing a coastal stack and stump.
Image pending generation: figure for Q10.
Describe two visible features of the coastal landform in Photograph A. [2]
11. Using Photograph A, account for the formation of the stack and stump. [3]
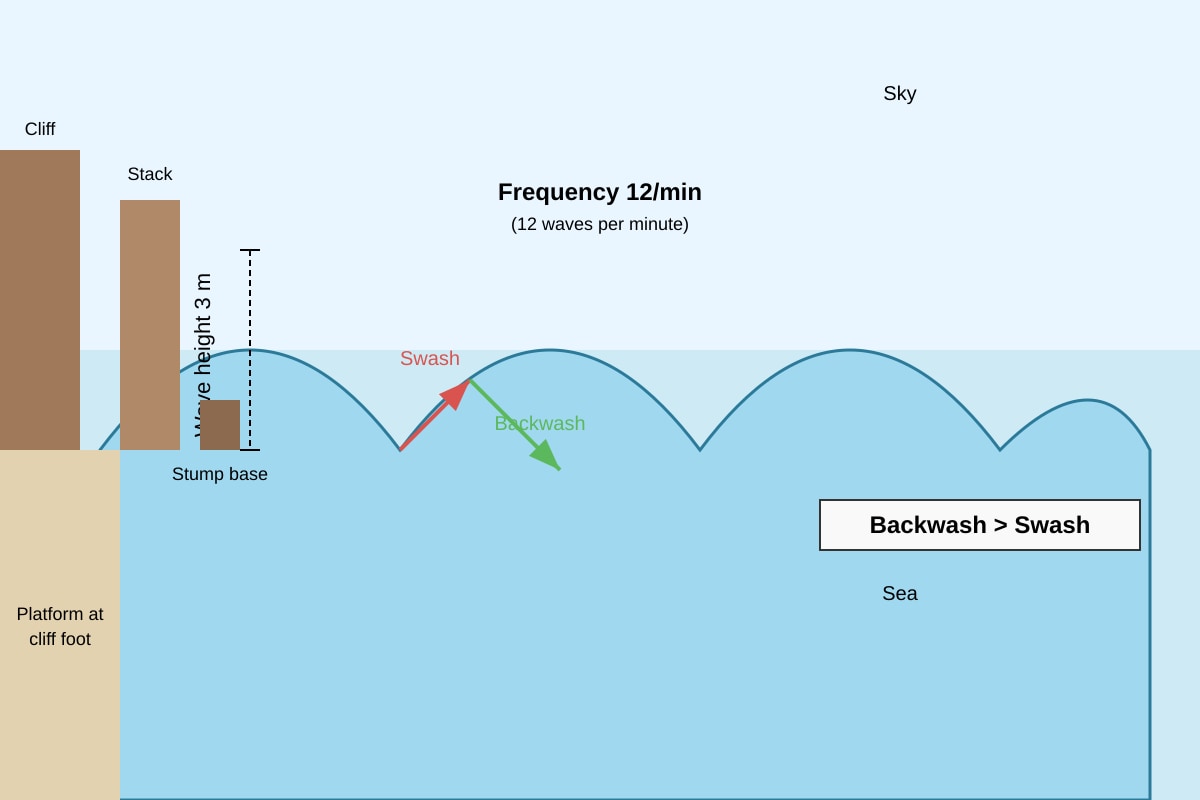
12. Study Figure 3, which shows wave characteristics: wave height 3 m, 12 waves per minute, backwash stronger than swash.
Image pending generation: diagram for Q12.
Describe the type of waves shown in Figure 3 and give two characteristics from the diagram. [2]
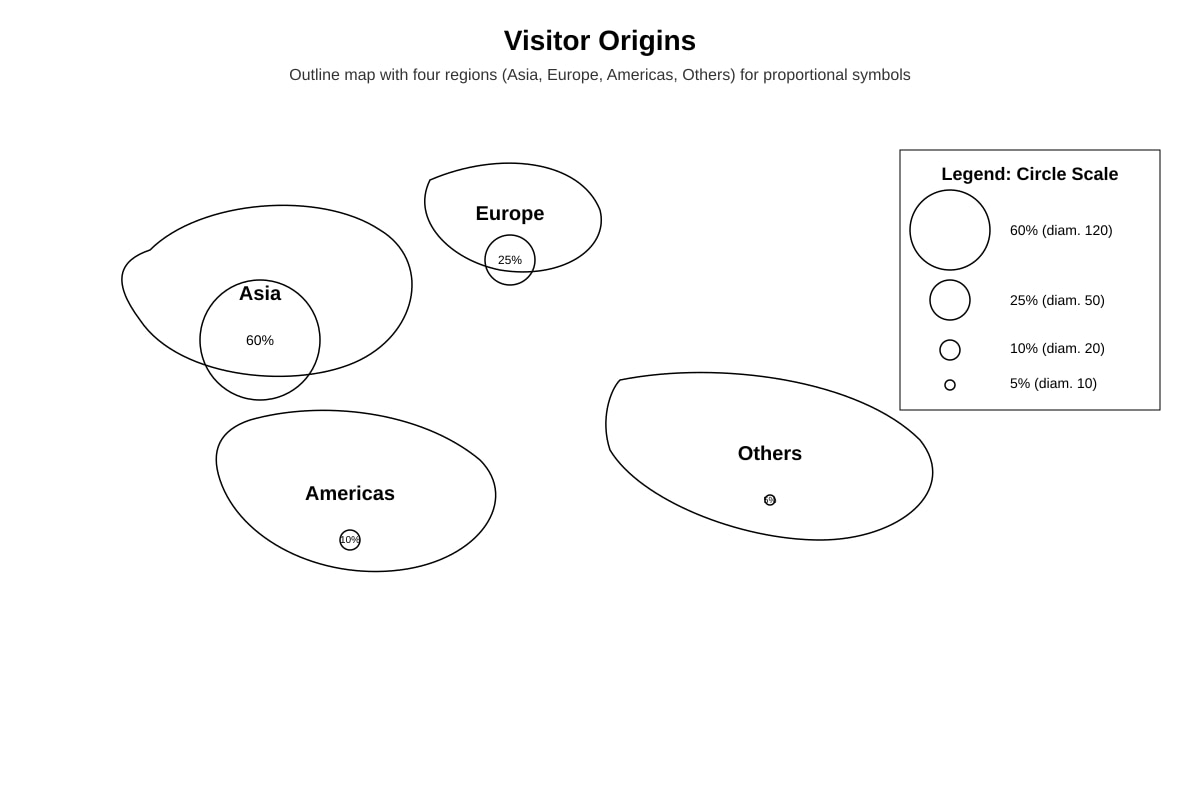
13. On the outline map (Figure 4), use the data in Table 3 to complete a proportional symbol map of visitor origins.
| Region | Visitors (%) |
|---|---|
| Asia | 60 |
| Europe | 25 |
| Americas | 10 |
| Others | 5 |
Image pending generation: map for Q13.
Complete the map by drawing circles with diameters proportional to the percentages. [1]
14. State one advantage of using a choropleth map instead of a bar graph to show population density by district. [1]
Section C: Fieldwork and Synthesis (Questions 15–20) [12 marks]
15. A student wants to investigate litter levels along East Coast Park. Describe a suitable sampling method and explain why it is appropriate. [2]
16. Give two reasons why a questionnaire is useful for collecting primary data on tourist satisfaction. [2]
17. Study Table 4 showing mean temperatures (°C) for two cities.
| City | Jan | Apr | Jul | Oct |
|---|---|---|---|---|
| P | 28 | 29 | 28 | 28 |
| Q | 5 | 12 | 22 | 11 |
With reference to Table 4, state one difference in temperature pattern between City P and City Q. [1]
18. Using Table 4, calculate the annual temperature range for City Q. Show your working. [2]
19. Explain how a scatter graph could be used to show the relationship between rainfall and crop yield in a geographical study. [2]
20. A field study found: 40% of respondents used buses, 35% trains, 25% cars. Plot a pie chart of this data with angle calculations. [3]
Answers
TuitionGoWhere Practice Paper — Geography Secondary 4 (Version 3) Answer Key
Total Marks: 40
Section A: 16 marks
Section B: 12 marks
Section C: 12 marks
Section A: Data Interpretation and Graph Skills (16 marks)
1. [2 marks]
Total = 20+35+60+120+200+250+240+210+180+90+40+25 = 1470 mm
Marking: 1 mark for correct sum, 1 mark for unit (mm).
Teaching note: Add all 12 monthly values. Always include units in final answer.
2. [2 marks]
Rainfall is low at start (20–35 mm Jan–Feb), rises to peak 250 mm in Jun, then decreases; bimodal or single peak with wet mid-year.
Marking: 1 mark for low start, 1 mark for mid-year peak / pattern.
Common mistake: describing only one month, not the pattern.
3. [2 marks]
Lowest: 2020 with 800 (thousand).
Marking: 1 mark year, 1 mark value.
Teaching: Read shortest bar from Figure 1.
4. [3 marks]
2021 = 1100, 2023 = 3100. Increase = 2000. % = (2000/1100)×100 = 181.8% ≈ 182%.
Marking: 1 mark values, 1 mark working, 1 mark answer.
Note: Formula % increase = (new−old)/old ×100.
5. [3 marks]
Angles: Coal 0.40×360=144°, Gas 0.30×360=108°, Hydro 0.20×360=72°, Others 0.10×360=36°. Draw sectors.
Marking: 1 calc, 1 plot, 1 title/legend.
Teaching: Total 360°; multiply fraction by 360.
6. [1 mark]
May misread temperature as rainfall if scales overlap / not labelled.
Accept any valid scale confusion.
7. [2 marks]
Bar graph with A=2.4, B=5.1, C=3.3 cm heights proportional.
Marking: 1 correct bars, 1 labels/scale.
Teaching: Choose scale e.g. 1 cm = 1 million.
8. [2 marks]
Line graph shows continuous change over time; pie shows proportion at one time.
Marking: 1 each point.
Section B: Map and Photograph Skills (12 marks)
9. [3 marks]
Core restricts access preserving wildlife; Buffer reduces edge effects; Access allows controlled use.
Marking: 1 per zone link (max 3).
Teaching: Zoning limits human impact progressively.
10. [2 marks]
Stack is column separated from cliff; stump is remnant at base; platform at foot.
Marking: 1 each feature.
11. [3 marks]
Hydraulic action + abrasion erode headland → arch → stack when roof collapses; stump remains after further erosion.
Marking: 1 process, 1 sequence, 1 link to photo.
Teaching: Wave erosion cuts through arch; stack = isolated; stump = base.
12. [2 marks]
Destructive waves; height 3 m, 12/min, backwash>swash.
Marking: 1 type, 1 two chars.
13. [1 mark]
Circles drawn with diameters Asia largest to Others smallest.
Marking: proportional symbols correct.
14. [1 mark]
Shows spatial variation across areas; bar graph cannot map space.
Section C: Fieldwork and Synthesis (12 marks)
15. [2 marks]
Systematic sampling at 50 m intervals; covers transect evenly.
Marking: 1 method, 1 reason.
16. [2 marks]
Captures opinion directly; standardised for comparison.
Marking: 1 each.
17. [1 mark]
P has little variation; Q has large seasonal range.
18. [2 marks]
Max 22 (Jul), Min 5 (Jan); range = 17°C.
Marking: 1 values, 1 answer.
19. [2 marks]
Plots pairs to show correlation; visual relationship.
Marking: 1 use, 1 benefit.
20. [3 marks]
Bus 0.40×360=144°, Train 0.35×360=126°, Car 0.25×360=90°.
Marking: 1 calc, 1 plot, 1 legend.
Free quiz and exam paper access
Enter your details to view this paper
Your access is remembered on this device.