AI Generated Exam Paper
Secondary 4 Geography Practice Paper 2
Free Sec 4 Geography Practice Paper 2, HY3 AI version, with questions, answers, and O Level-style practice for Singapore students.
These static practice materials are generated from the site's syllabus and paper-generation workflow, with source and model context shown so students and parents can evaluate the material before use.
Questions
TuitionGoWhere Practice Paper - Geography Secondary 4
TuitionGoWhere Practice Paper (AI) — Version 2
Subject: Geography
Level: Secondary 4
Paper: Practice Paper (Map Graph Data Skills)
Duration: 1 hour 15 minutes
Total Marks: 40
Name: ________________________
Class: ________
Date: ____________
Instructions:
- This practice paper contains 20 questions on Map, Graph & Data Skills.
- Answer all questions in the spaces provided.
- Use the data, figures, and tables given. For questions with image placeholders, assume the described diagram/map/chart has been drawn as specified.
- Marks for each question are shown in brackets.
- Section marks and question marks total exactly 40.
Section A: Data Interpretation (Questions 1–8) [16 marks]
1. Study the table below showing monthly rainfall (mm) for City X in 2023.
| Month | Jan | Feb | Mar | Apr | May | Jun | Jul | Aug | Sep | Oct | Nov | Dec |
|---|---|---|---|---|---|---|---|---|---|---|---|---|
| Rain (mm) | 20 | 35 | 60 | 120 | 200 | 250 | 230 | 180 | 140 | 90 | 45 | 25 |
State the two months with the highest rainfall. [2]
2. Using the data in Question 1, calculate the total annual rainfall for City X. Show your working. [2]
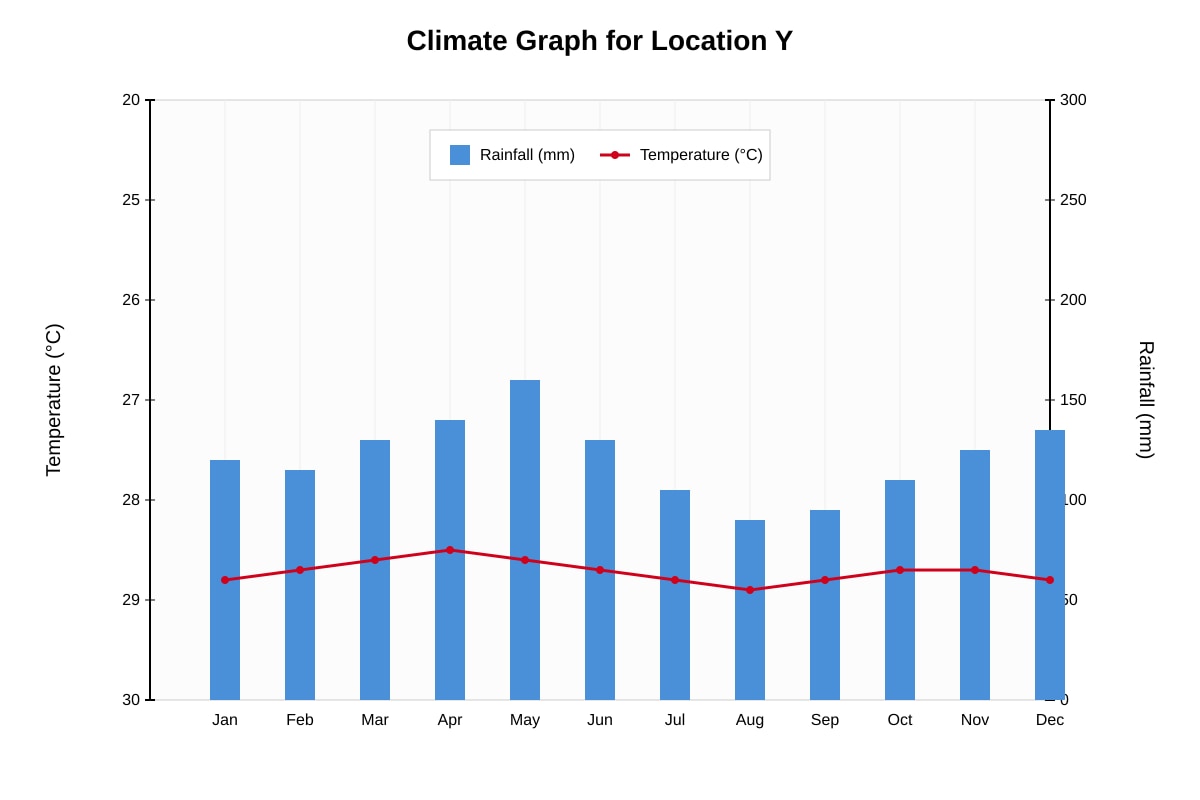
3. Study the climate graph described below.
Image pending generation: graph for Q3.
Describe the temperature pattern shown in the climate graph for Location Y. [2]
4. With reference to the climate graph in Q3, state the type of climate Location Y most likely has. [1]
5. Study the table below showing tourist arrivals (in thousands) to Country Z from three countries.
| Year | A | B | C |
|---|---|---|---|
| 2018 | 120 | 80 | 50 |
| 2019 | 140 | 95 | 65 |
| 2020 | 60 | 40 | 30 |
| 2021 | 100 | 70 | 55 |
Identify the year with the greatest percentage drop in total arrivals compared to the previous year. [2]
6. Using the data in Q5, calculate the total tourist arrivals from Country B over the four years. [1]
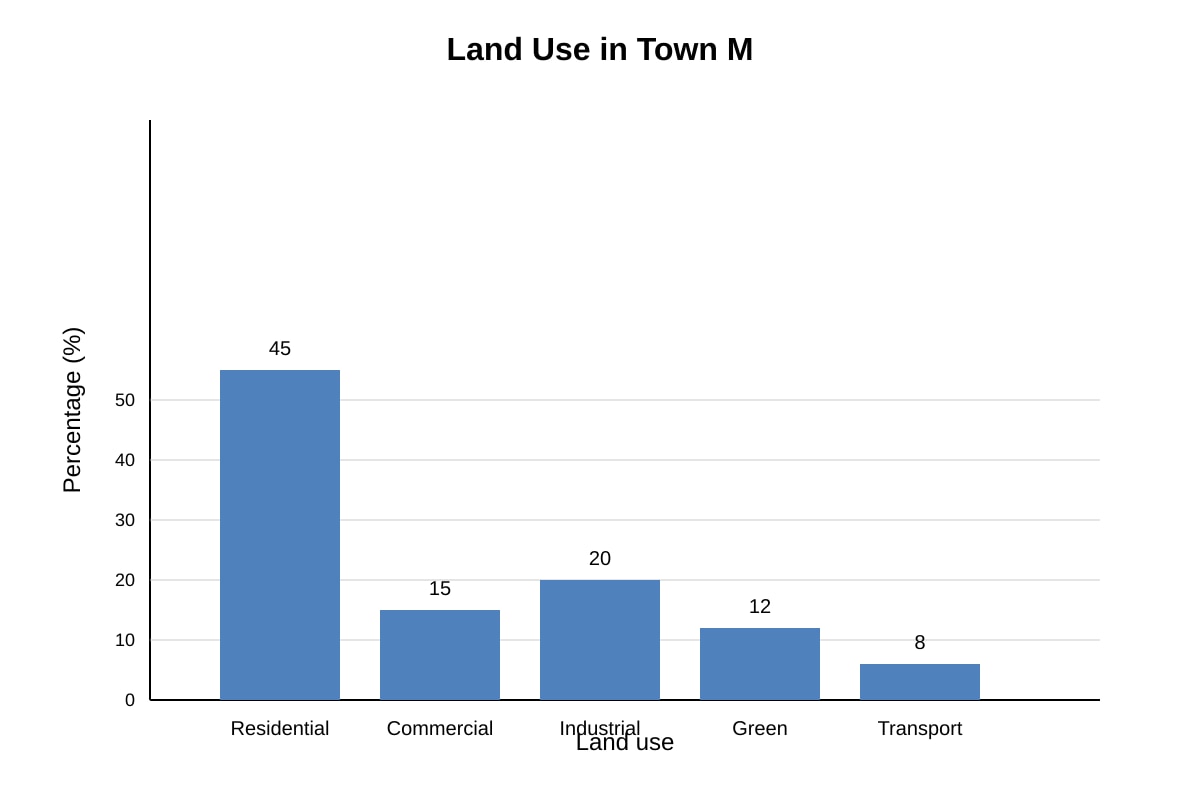
7. Study the bar chart described below.
Image pending generation: chart for Q7.
State the two largest land use categories in Town M. [2]
8. Using the bar chart in Q7, calculate the combined percentage of Industrial and Transport land use. [2]
Section B: Map and Graph Skills (Questions 9–14) [12 marks]
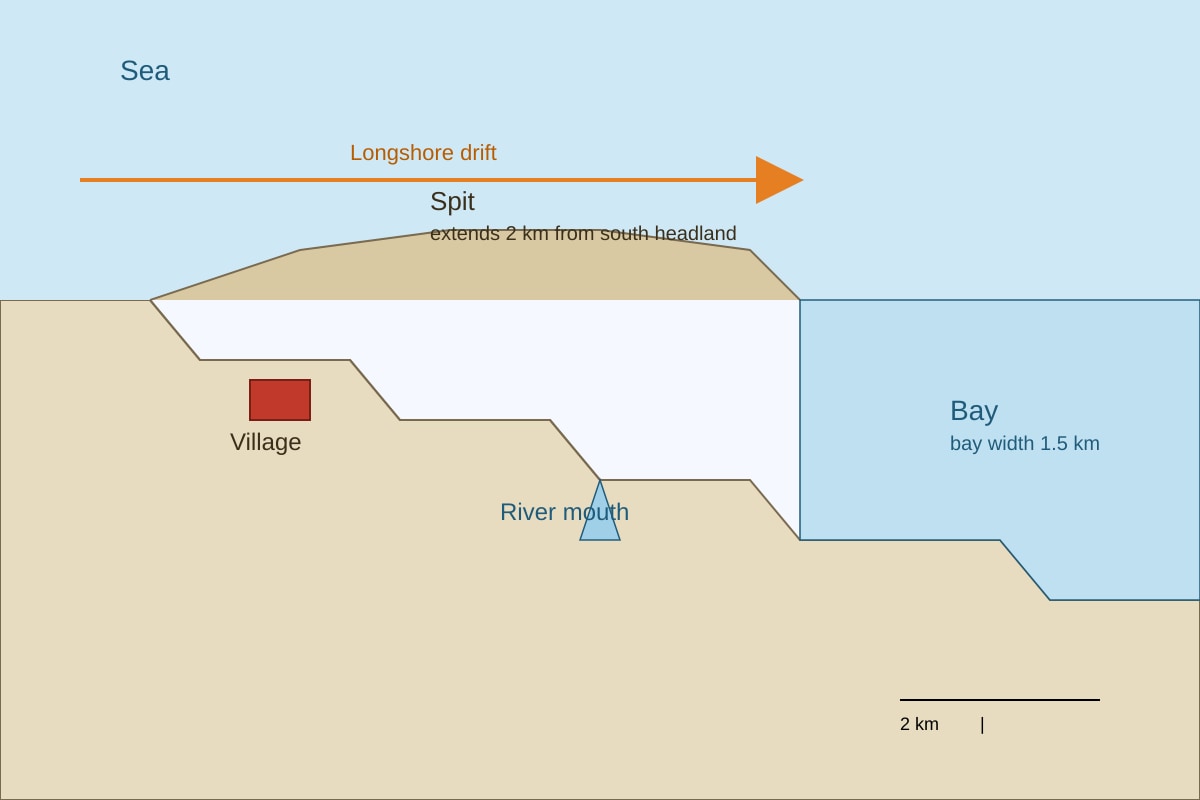
9. Study the map described below.
Image pending generation: map for Q9.
With reference to the map, name the coastal landform labelled "Spit" and explain one process that formed it. [2]
10. A student recorded the following data on mode of transport to school: Walk 40%, Bus 30%, MRT 20%, Car 10%. Calculate the angle for the "Bus" sector in a pie chart. [2]
11. Using the data in Q10, state the angle for the "Walk" sector. [1]
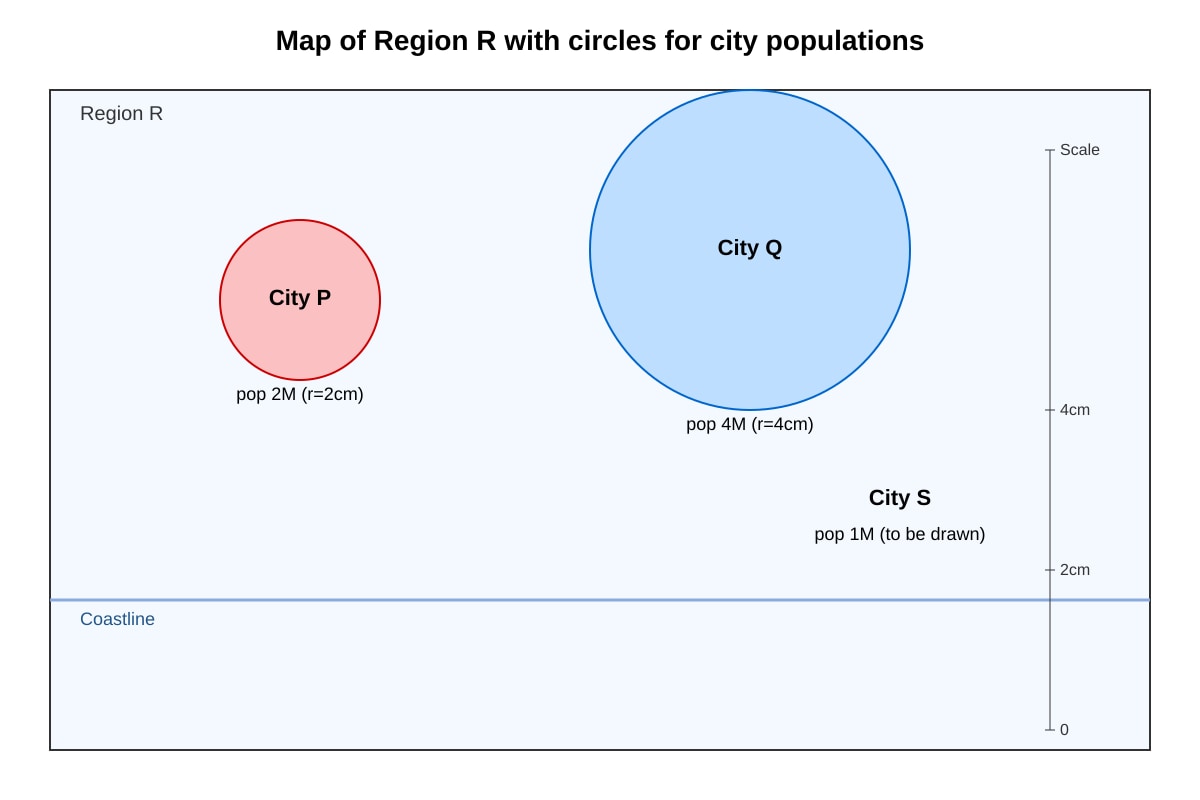
12. Study the incomplete proportional symbol map described below.
Image pending generation: map for Q12.
If City S has population 1 million, what should be the radius of its symbol circle? [1]
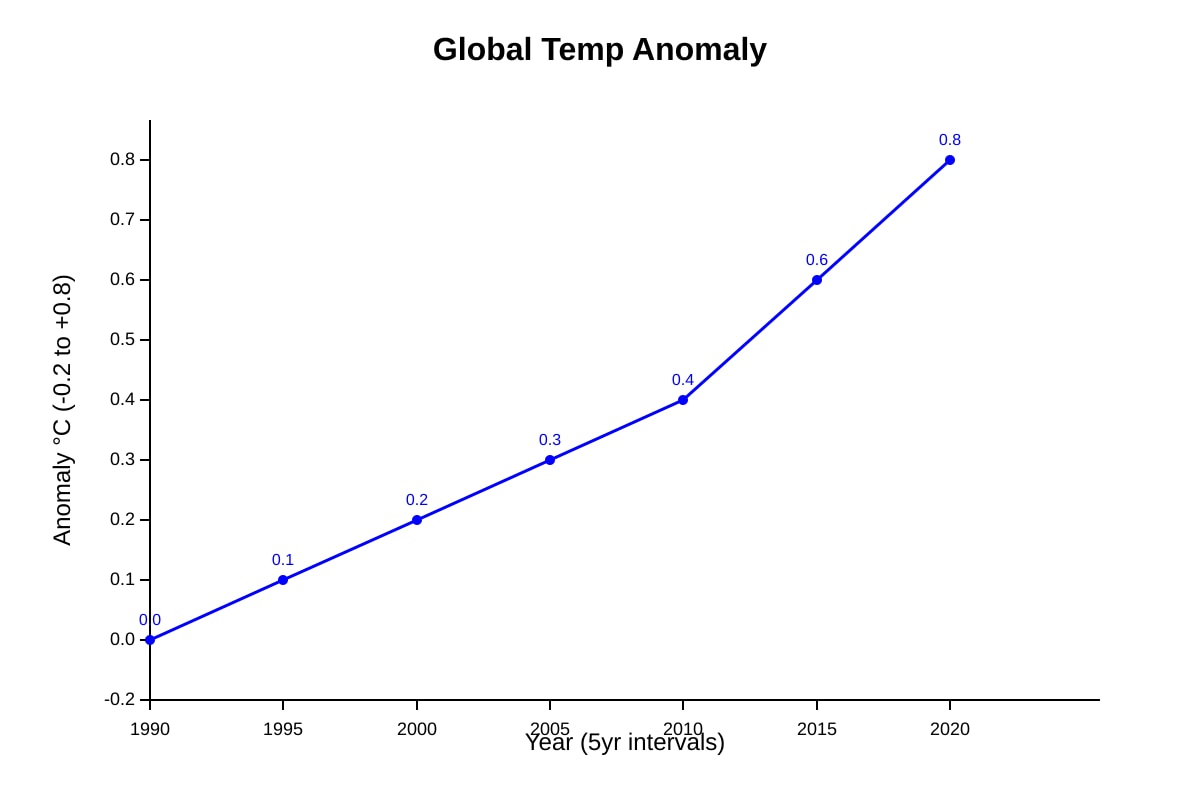
13. Study the line graph described below.
Image pending generation: graph for Q13.
Describe the trend shown in the line graph. [2]
14. Using the graph in Q13, suggest one possible reason for the trend. [2]
Section C: Applied Data Skills (Questions 15–20) [12 marks]
15. A fieldwork study uses systematic sampling along a 200 m transect at 20 m intervals. How many sample points are there? [2]
16. A questionnaire asks: "Tourism damages our environment, do you agree?" Give one reason why this is a poor question. [2]
17. Study the table below showing energy use (kWh) in two households.
| Household | Jan | Feb | Mar |
|---|---|---|---|
| H1 | 300 | 320 | 310 |
| H2 | 200 | 210 | 205 |
Calculate the mean energy use for H1 across the three months. [2]
18. Using the table in Q17, which household has lower consumption and by what average monthly difference? [2]
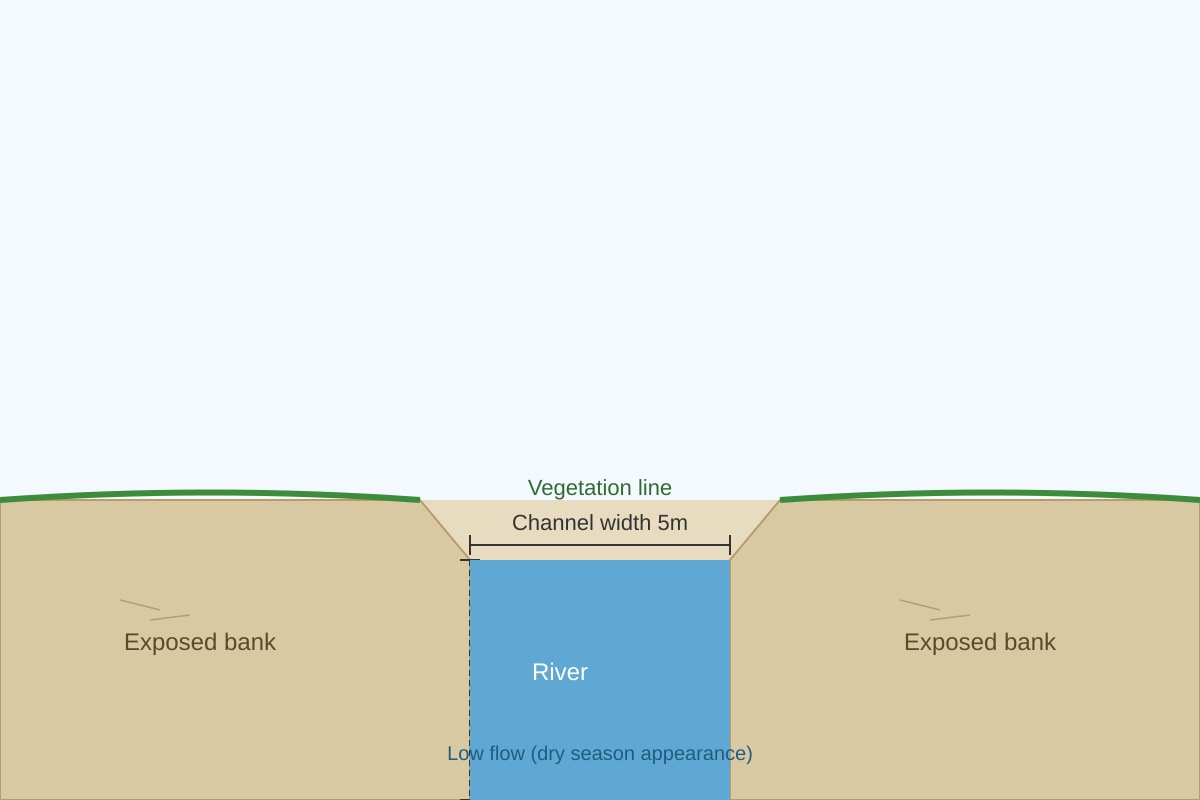
19. Study the photograph description below.
Image pending generation: figure for Q19.
With reference to the photograph, describe two observable features of the river channel. [2]
20. Using the photograph in Q19, suggest the season shown and explain your answer. [2]
Answers
TuitionGoWhere Practice Paper - Geography Secondary 4 (Answers)
Version 2 — Answer Key with Teaching Notes
Section A: Data Interpretation
Q1 [2]
Answer: June (250 mm) and May (200 mm).
Teaching: Read the table and find the highest values. June = 250, May = 200, Jul = 230. Top two are Jun and May.
Marking: 1 mark each correct month.
Q2 [2]
Working: 20+35+60+120+200+250+230+180+140+90+45+25 = 1395 mm.
Answer: 1395 mm.
Teaching: Add all 12 monthly values. Show sum clearly.
Marking: 1 for working, 1 for correct total.
Q3 [2]
Answer: Temperature is high throughout the year, ranging from 26.5°C to 28.5°C with little variation (about 2°C range).
Teaching: Read line values from graph; note small difference between min and max = equatorial stability.
Marking: 1 for high temp stated, 1 for low variation/values.
Q4 [1]
Answer: Equatorial climate.
Teaching: High year-round temp + high rain = equatorial (near equator).
Marking: 1 correct.
Q5 [2]
Working: Total 2018 = 250; 2019 = 300; 2020 = 130 (drop 57%); 2021 = 225. Drop 2019→2020 = (300-130)/300 = 56.7%.
Answer: 2020.
Teaching: Calculate total each year, then % drop. 2020 shows biggest fall due to likely pandemic.
Marking: 1 for identifying 2020, 1 for correct reasoning.
Q6 [1]
Answer: 80+95+40+70 = 285 thousand.
Teaching: Sum Country B column.
Marking: 1 correct.
Q7 [2]
Answer: Residential (45%) and Industrial (20%).
Teaching: Read bars; two tallest.
Marking: 1 each.
Q8 [2]
Working: 20% + 8% = 28%.
Answer: 28%.
Teaching: Add values from chart.
Marking: 1 working, 1 answer.
Section B: Map and Graph Skills
Q9 [2]
Answer: Spit; formed by longshore drift depositing sediment from south headland across bay.
Teaching: Spit = elongated deposit attached to land. Process = transportation by waves/currents.
Marking: 1 name, 1 process.
Q10 [2]
Working: (30/100) × 360° = 108°.
Answer: 108°.
Teaching: Pie angle = % × 3.6.
Marking: 1 formula, 1 answer.
Q11 [1]
Answer: 40% × 3.6 = 144°.
Teaching: Same method.
Marking: 1 correct.
Q12 [1]
Answer: 1 cm (half of P's 2 cm as pop half).
Teaching: Scale linear with radius.
Marking: 1 correct.
Q13 [2]
Answer: Temperature anomaly increases steadily from 0.0°C (1990) to 0.8°C (2020).
Teaching: Line rises; state start and end.
Marking: 1 trend, 1 values.
Q14 [2]
Answer: Global warming due to greenhouse gas emissions.
Teaching: Link to climate change.
Marking: 1 idea, 1 link.
Section C: Applied Data Skills
Q15 [2]
Working: 200 m / 20 m = 10 intervals + 1 start = 11 points.
Answer: 11.
Teaching: Systematic sampling includes both ends.
Marking: 1 method, 1 answer.
Q16 [2]
Answer: Leading question / biased (assumes damage).
Teaching: Good questions neutral.
Marking: 1 identify, 1 explain.
Q17 [2]
Working: (300+320+310)/3 = 930/3 = 310 kWh.
Answer: 310 kWh.
Teaching: Mean = sum ÷ count.
Marking: 1 working, 1 answer.
Q18 [2]
Answer: H2 lower; diff = (300+320+310 - 200+210+205)/3 = (930-615)/3 = 105 kWh.
Answer: H2, 105 kWh less per month.
Teaching: Compare totals then average.
Marking: 1 household, 1 difference.
Q19 [2]
Answer: Narrow channel (5m), exposed banks (2m high).
Teaching: Photo shows low flow.
Marking: 1 each feature.
Q20 [2]
Answer: Dry season; low flow, exposed banks indicate little rain.
Teaching: Rivers shrink in dry period.
Marking: 1 season, 1 reason.
Free quiz and exam paper access
Enter your details to view this paper
Your access is remembered on this device.