AI Generated Exam Paper
Secondary 4 Geography Practice Paper 1
Free Sec 4 Geography Practice Paper 1, HY3 AI version, with questions, answers, and O Level-style practice for Singapore students.
These static practice materials are generated from the site's syllabus and paper-generation workflow, with source and model context shown so students and parents can evaluate the material before use.
Questions
TuitionGoWhere Practice Paper - Geography Secondary 4
TuitionGoWhere Practice Paper (AI) — Version 1 of 5
Subject: Geography
Level: Secondary 4
Paper: Practice Paper (Map Graph Data Skills)
Duration: 1 hour 15 minutes
Total Marks: 40
Name: ___________________________
Class: ____________
Date: ____________
Instructions:
- This practice paper contains 20 questions across three sections.
- Answer all questions in the spaces provided.
- Use the data, maps, graphs, and photographs provided to support your answers with evidence.
- Marks for each question are shown in brackets [ ].
- Section subtotals and question marks add up to 40 marks.
Section A: Data Interpretation and Graph Skills (Questions 1–8) [16 marks]
1. Study the table below showing monthly rainfall (mm) for City X in 2023.
| Month | Jan | Feb | Mar | Apr | May | Jun | Jul | Aug | Sep | Oct | Nov | Dec |
|---|---|---|---|---|---|---|---|---|---|---|---|---|
| Rain (mm) | 20 | 35 | 60 | 120 | 200 | 240 | 210 | 180 | 150 | 90 | 45 | 25 |
State the wettest month and the total annual rainfall. [2]
2. Using the data in Question 1, calculate the mean monthly rainfall for City X. Show your working. [2]
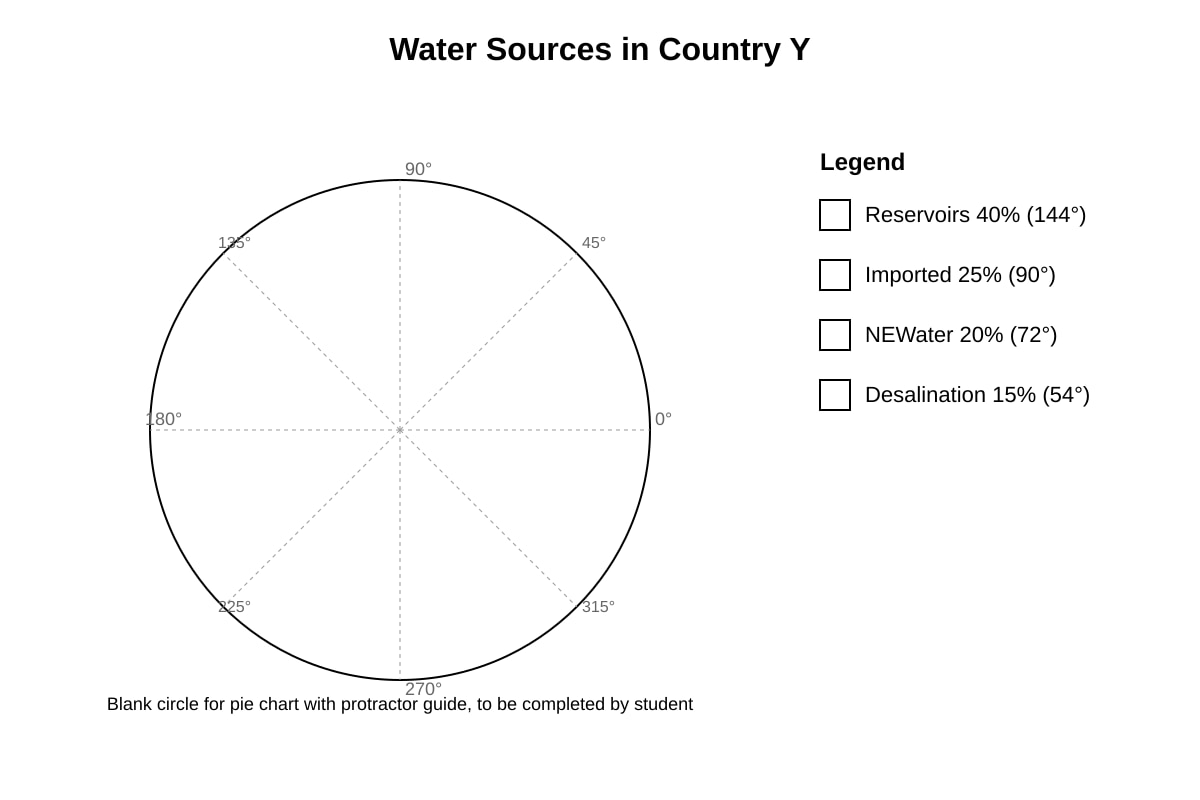
3. Study the pie chart data below for sources of water in Country Y.
| Source | Reservoirs | Imported | NEWater | Desalination |
|---|---|---|---|---|
| % | 40 | 25 | 20 | 15 |
Calculate the angle for "NEWater" in a pie chart. [1]
4. Plot a pie chart to represent the data in Question 3. Include title and legend. [3]
Image pending generation: chart for Q4.
5. Study Table 2 showing tourist arrivals (millions) to Singapore from 2015–2019.
| Year | 2015 | 2016 | 2017 | 2018 | 2019 |
|---|---|---|---|---|---|
| Arrivals | 15.2 | 16.4 | 17.4 | 18.5 | 19.1 |
With reference to the table, describe the trend in tourist arrivals. [2]
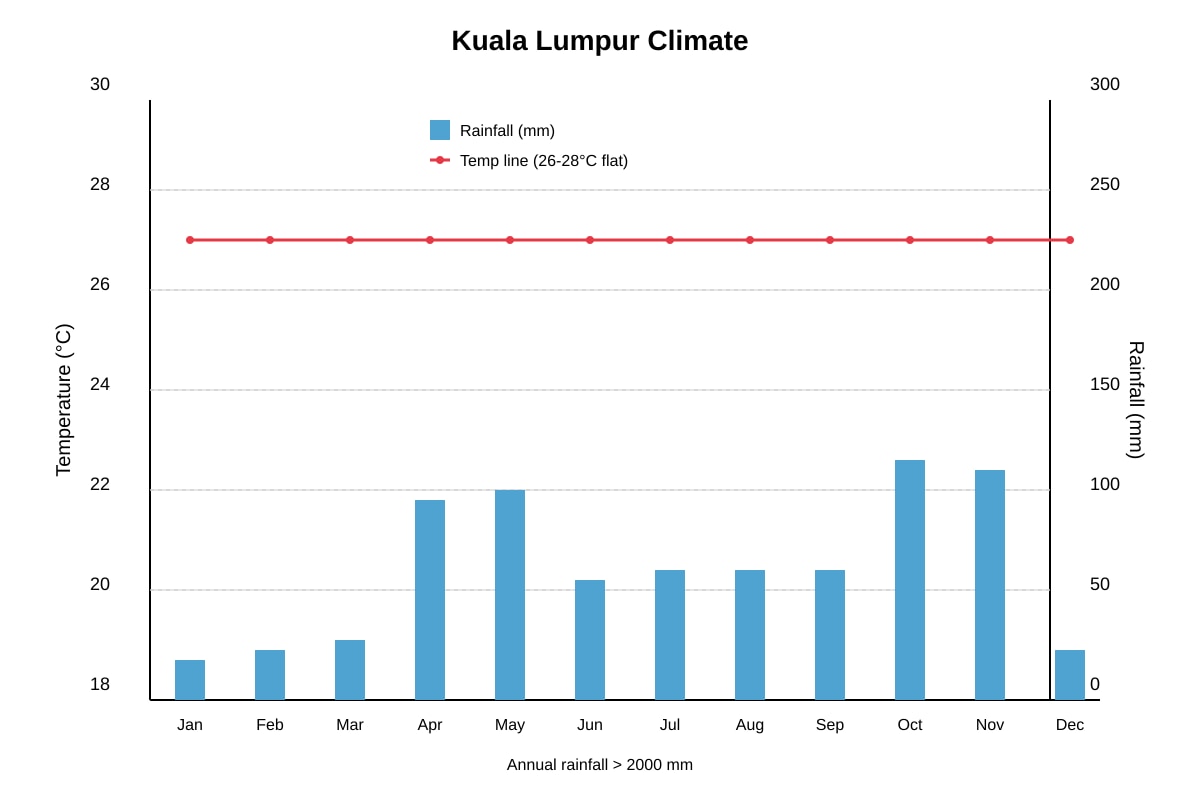
6. Study Figure 1, a climate graph for Kuala Lumpur.
Image pending generation: graph for Q6.
Describe the temperature and rainfall patterns shown. [3]
7. A student recorded litter count along a beach transect at 10 m intervals: 2, 5, 3, 8, 12, 7, 4, 6, 3, 2. Calculate the median litter count. Show working. [2]
8. Study Map 1 showing a protected forest area with zoning.
Image pending generation: map for Q8.
With reference to Map 1, explain how zoning helps conserve the forest. [2]
Section B: Map and Photograph Skills (Questions 9–14) [12 marks]
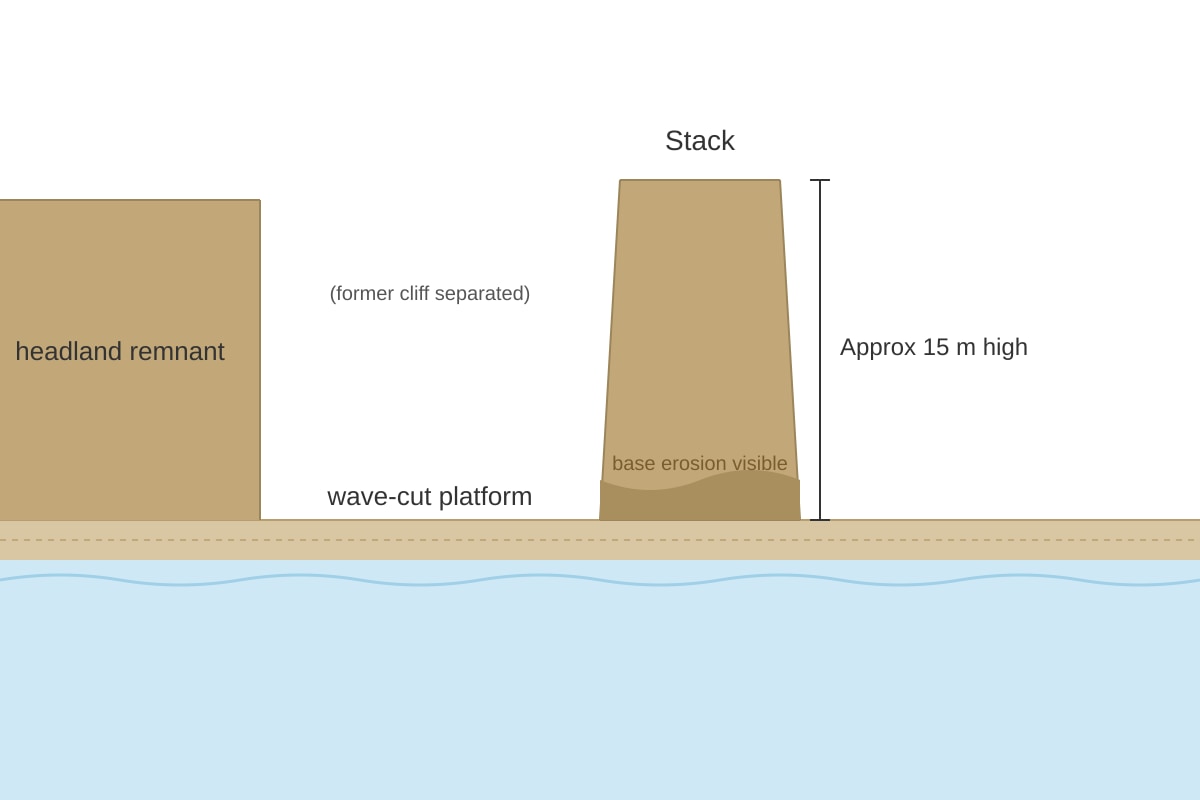
9. Study Photograph A showing a coastal stack.
Image pending generation: figure for Q9.
Describe the features of the coastal stack shown. [2]
10. Using Photograph A (Q9), account for the formation of the stack. [3]
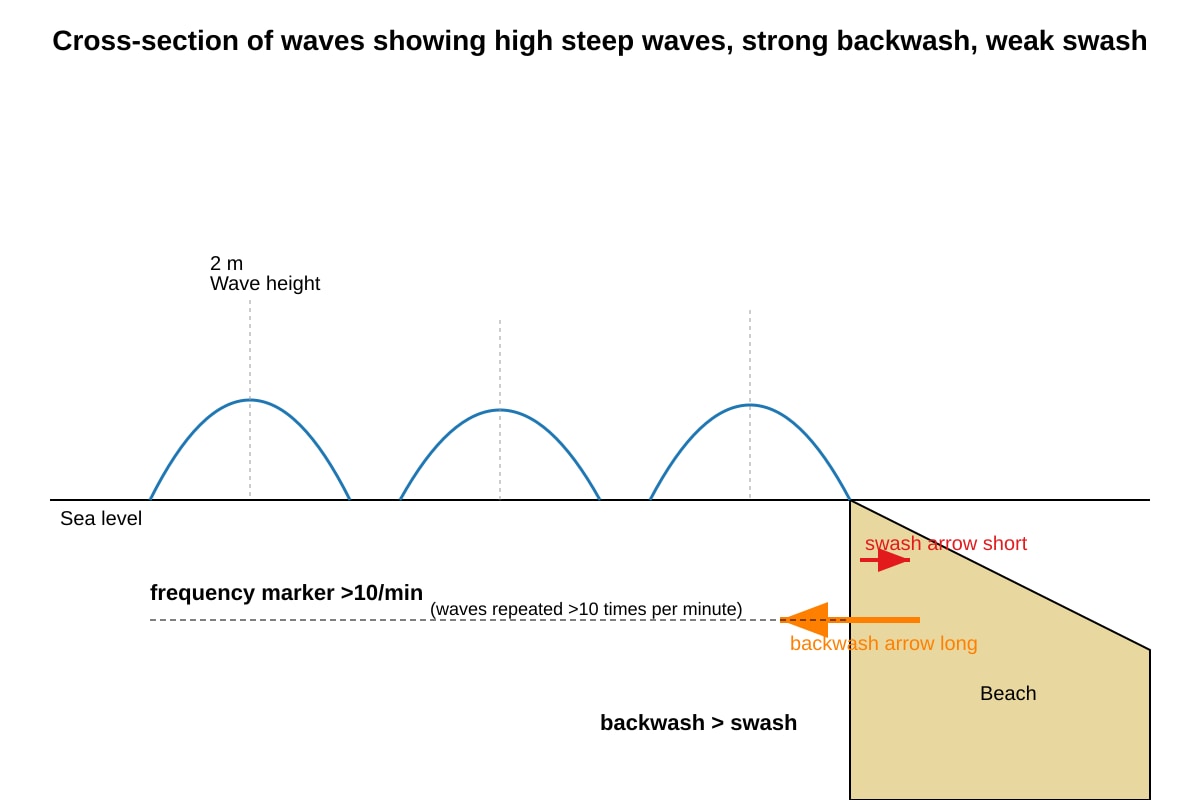
11. Study Figure 2 showing wave characteristics at a coast.
Image pending generation: diagram for Q11.
Describe the type of waves and give two characteristics. [3]
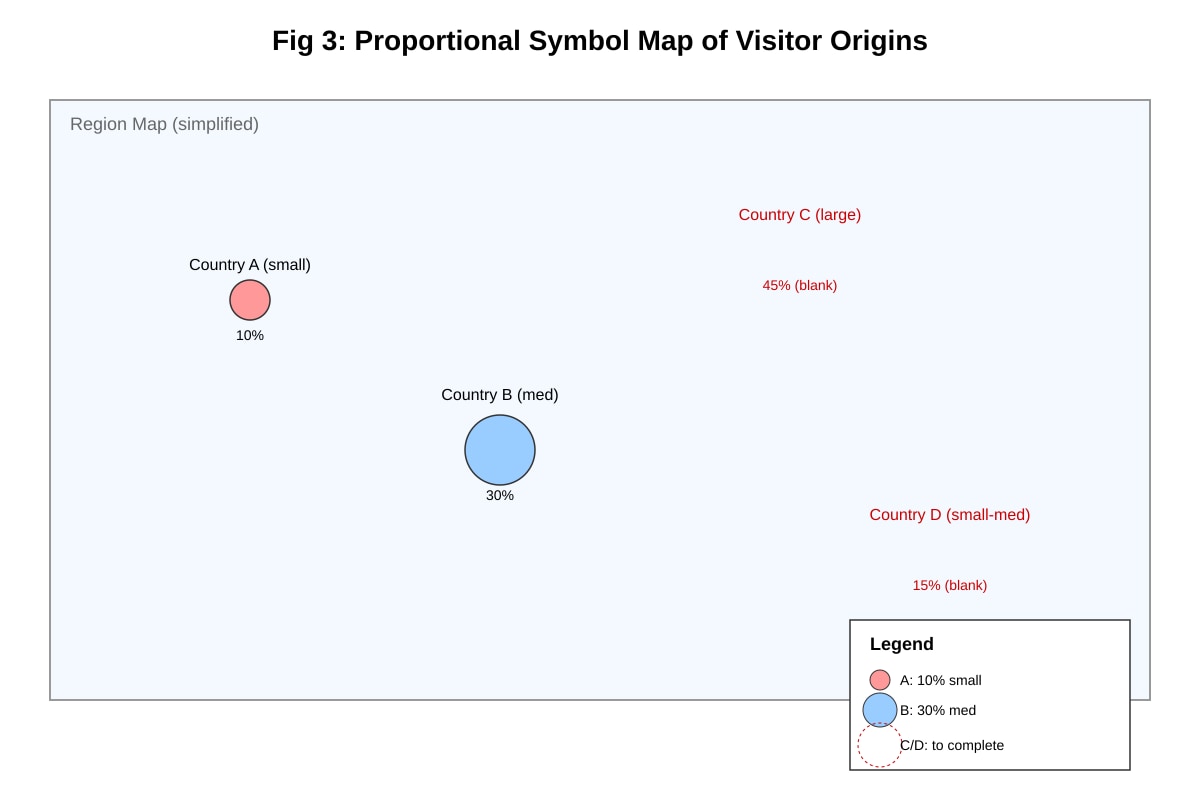
12. Table 3 shows visitor origins to a resort.
| Country | A | B | C | D |
|---|---|---|---|---|
| % | 10 | 30 | 45 | 15 |
Fig 3 is a partially completed proportional symbol map.
Image pending generation: map for Q12.
Use Table 3 to complete Fig 3 with correct symbol sizes for C and D. [2]
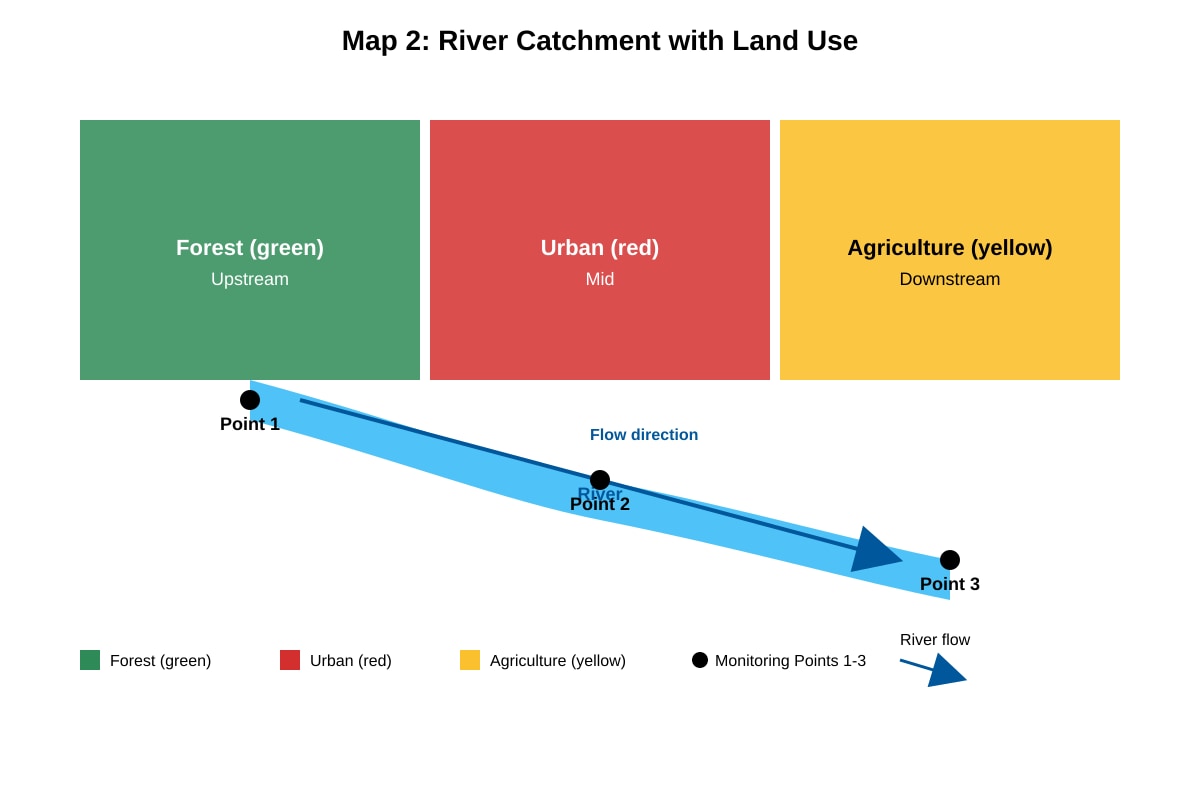
13. Study Map 2 of a river catchment with land use.
Image pending generation: map for Q13.
With reference to Map 2, suggest which monitoring point (1, 2, or 3) has highest pollution risk and why. [1]
14. A student drew a bar graph of temperature but swapped x and y axes. State one problem this causes for interpretation. [1]
Section C: Applied Data and Fieldwork Skills (Questions 15–20) [12 marks]
15. A student wants to investigate litter density at East Coast Park. Describe a suitable sampling method and data collection technique. [3]
16. Study Table 4 on energy use in a town.
| Type | Solar | Gas | Coal | Wind |
|---|---|---|---|---|
| % | 20 | 35 | 30 | 15 |
Calculate the angle for "Gas" in a pie chart. [1]
17. Using Table 4 (Q16), explain why a pie chart is appropriate for this data. [2]
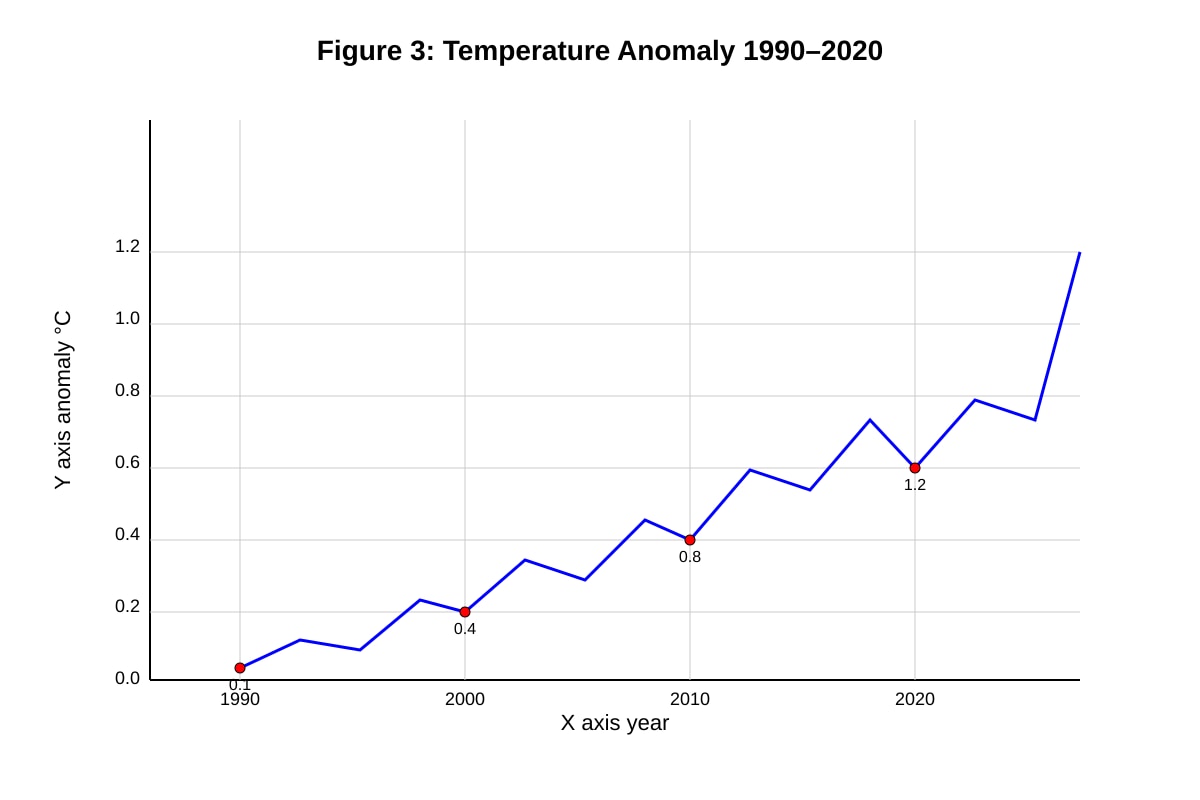
18. Study Figure 3, a line graph of temperature anomaly 1990–2020.
Image pending generation: graph for Q18.
With reference to Figure 3, describe the trend and state one possible cause. [2]
19. A questionnaire asks "Do you like parks? Yes/No". Give one improvement to make it more useful for geography fieldwork. [2]
20. Study Table 5 on rainfall and crop yield.
| Rain (mm) | 100 | 200 | 300 | 400 | 500 |
|---|---|---|---|---|---|
| Yield (t) | 1.0 | 2.2 | 3.0 | 2.8 | 2.0 |
State the relationship shown between rainfall and yield. [2]
End of Practice Paper
Answers
TuitionGoWhere Practice Paper - Geography Secondary 4 (Answer Key)
Version: 1 of 5
Total Marks: 40
Section A: Data Interpretation and Graph Skills (16 marks)
Q1 [2]
- Wettest month: June (240 mm) — 1 mark
- Total annual rainfall: 20+35+60+120+200+240+210+180+150+90+45+25 = 1375 mm — 1 mark
Teaching note: Always scan the table for max value first; sum all 12 months for total. Common mistake: misreading row.
Q2 [2]
Mean = Total / 12 = 1375 / 12 = 114.58 mm (accept 114.6)
Working: 1375 ÷ 12 = 114.58 — 2 marks (1 for method, 1 for answer)
Teaching note: Mean = sum of values ÷ number of items. Shows typical monthly value.
Q3 [1]
Angle = 20% × 360° = 0.20 × 360 = 72° — 1 mark
Teaching note: Pie angle = (category % ÷ 100) × 360°.
Q4 [3]
- Reservoirs 40% → 144°, Imported 25% → 90°, NEWater 20% → 72°, Desalination 15% → 54°
- Plot sectors accurately — 1 mark
- Title "Water Sources in Country Y" — 1 mark
- Legend with 4 categories — 1 mark
Teaching note: Check angles sum to 360°. Use protractor.
Q5 [2]
Trend: Increased from 15.2m (2015) to 19.1m (2019), steady rise, ~25% growth — 2 marks (1 describe increase, 1 quantify)
Teaching note: Use data values; avoid "up and down" vague.
Q6 [3]
- Temp: 26–28°C all year, low variation — 1 mark
- Rain: double peaks Apr–May & Oct–Nov, low Jun–Sep — 1 mark
- Annual >2000 mm — 1 mark
Teaching note: Read both axes separately.
Q7 [2]
Ordered: 2,2,3,3,4,5,6,7,8,12 (n=10) median = (5th+6th)/2 = (4+5)/2 = 4.5 — 2 marks
Teaching note: Median is middle after sorting.
Q8 [2]
Zoning limits access: core restricts humans, buffer allows controlled use, visitor centre outside core reduces impact — 2 marks (1 for map ref, 1 explain)
Teaching note: Link map features to conservation.
Section B: Map and Photograph Skills (12 marks)
Q9 [2]
- Isolated rock pillar ~15 m high — 1 mark
- Wave-cut platform at base, detached from headland — 1 mark
Teaching note: Identify landform + observable features.
Q10 [3]
- Hydraulic action + abrasion erode headland, form arch — 1
- Arch collapses leaving stack — 1
- Wave-cut platform from continued erosion — 1
Teaching note: Process chain: erosional processes → arch → collapse.
Q11 [3]
- Destructive waves — 1
- High steep waves (2 m) — 1
- Backwash > swash, freq >10/min — 1
Teaching note: Destructive = erodes coast.
Q12 [2]
- C: largest symbol (45%) — 1
- D: small-med (15%) — 1
Teaching note: Size ∝ %.
Q13 [1]
Point 3 (downstream of urban + farm) — 1 mark
Teaching note: Pollutants flow downstream.
Q14 [1]
Bars/values unreadable or misleads variable relationship — 1 mark
Section C: Applied Data and Fieldwork Skills (12 marks)
Q15 [3]
- Systematic sampling at 20 m intervals — 1
- Litter count in quadrats — 1
- Record on sheet, repeat weekends/weekdays — 1
Teaching note: Match method to question.
Q16 [1]
35% × 360 = 126° — 1 mark
Q17 [2]
- Shows parts of whole (100%) — 1
- Categories exclusive — 1
Teaching note: Pie for composition.
Q18 [2]
- Rising 0.1→1.2°C — 1
- Cause: greenhouse gases — 1
Teaching note: Trend + link.
Q19 [2]
- Use Likert scale (1–5) — 1
- Ask frequency of visit — 1
Teaching note: Better data than yes/no.
Q20 [2]
Yield rises to 300 mm then falls — 2 marks
Teaching note: Non-linear, optimum ~300 mm.
End of Answer Key
Free quiz and exam paper access
Enter your details to view this paper
Your access is remembered on this device.