From Real Exams Exam Paper
Secondary 4 Geography Preliminary Examination Paper 5
Free Sec 4 Geography Prelim Paper 5, HY3 Exam version, with questions, answers, and O Level-style practice for Singapore students.
These static practice materials are generated from the site's syllabus and paper-generation workflow, with source and model context shown so students and parents can evaluate the material before use.
Questions
TuitionGoWhere Exam Practice (AI) — Preliminary Practice Paper
Geography Secondary 4 — Version 5 of 5
School: TuitionGoWhere Secondary School (AI)
Subject: Geography
Level: Secondary 4
Paper: Preliminary Practice (Map, Graph & Data Skills)
Version: 5 of 5
Duration: 60 minutes
Total Marks: 60
Name: ________________________
Class: ____________
Date: ____________
Instructions:
- Answer ALL questions in the spaces provided.
- Use the data, maps, graphs, and photographs provided to support your answers.
- For drawing questions, use a ruler and protractor where needed.
- Marks for each question are shown in brackets [ ].
Section A: Data Interpretation and Graph Construction (Questions 1–8) [24 marks]
1. Table 1 shows the mode of transport used by visitors to a nature reserve in Singapore. Plot a pie chart to represent the data. [3]
| Mode of Transport | Number of Visitors |
|---|---|
| MRT | 120 |
| Bus | 80 |
| Car | 60 |
| Cycling | 40 |
2. Study the data in Table 2 showing monthly rainfall (mm) in Singapore for the first half of the year. Calculate the mean monthly rainfall. [2]
| Month | Rainfall (mm) |
|---|---|
| Jan | 200 |
| Feb | 150 |
| Mar | 180 |
| Apr | 170 |
| May | 190 |
| Jun | 160 |
3. A student recorded the following temperature readings at 2-hour intervals: 26°C, 28°C, 31°C, 33°C, 30°C, 27°C. Construct a line graph of temperature against time (first reading at 0800h). [3]
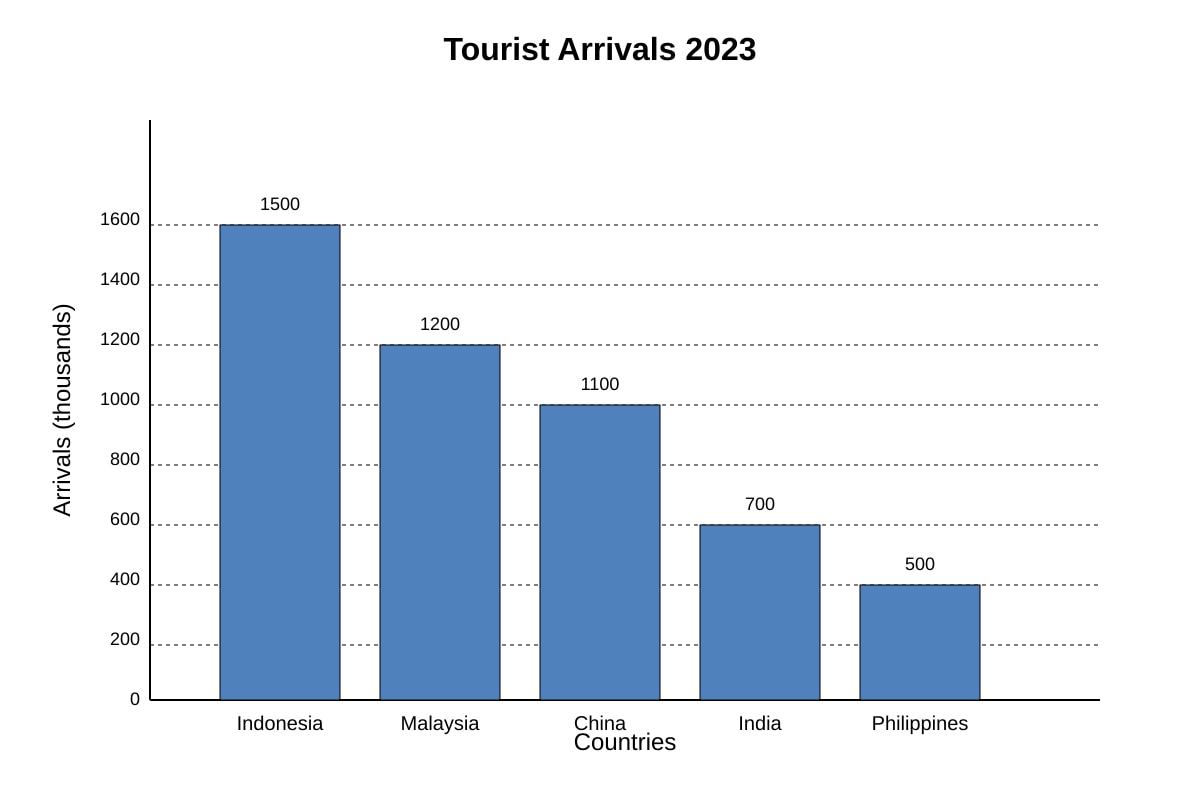
4.
Image pending generation: chart for 4.
Study the bar chart in Q4-fig1. State the two countries with the highest and lowest tourist arrivals. [2]
5. Table 3 shows land use in a town. Draw a divided bar chart to represent the data. [3]
| Land Use | Area (km²) |
|---|---|
| Residential | 12 |
| Industrial | 8 |
| Green Space | 5 |
| Commercial | 3 |
6. The population of a district grew from 50 000 in 2018 to 65 000 in 2023. Calculate the percentage increase. [2]
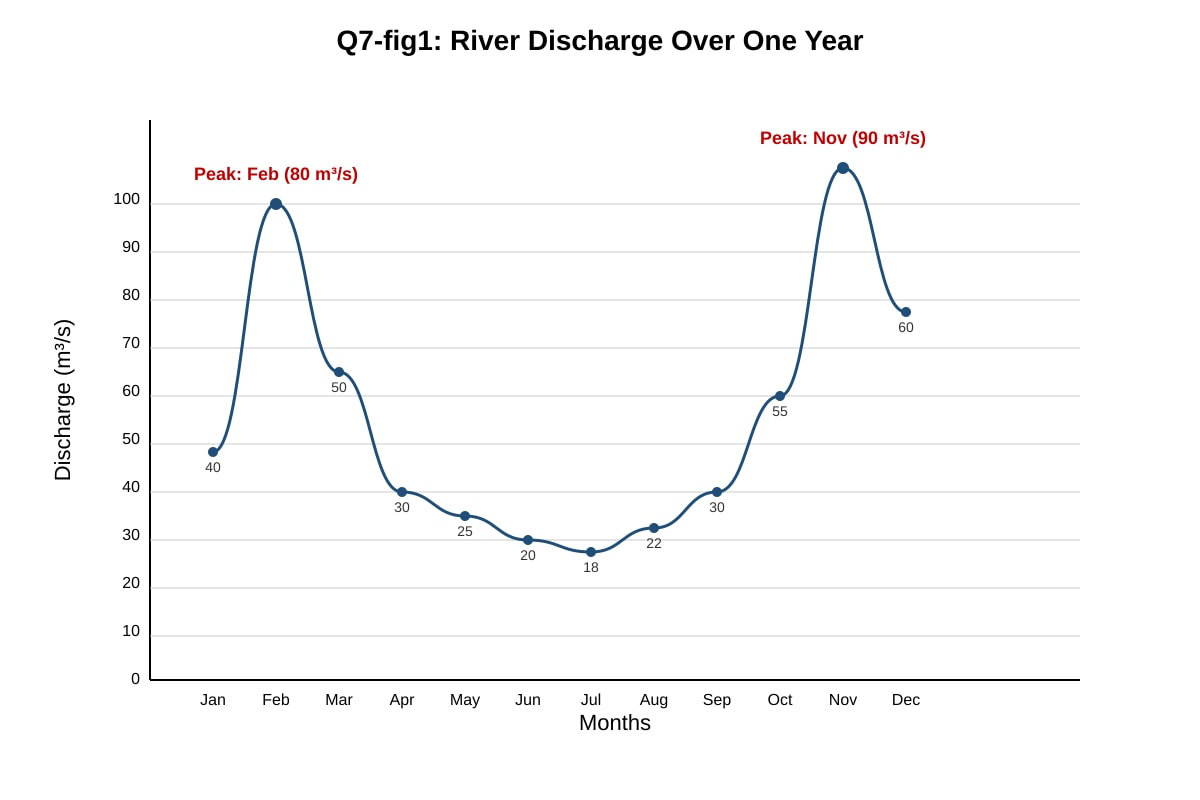
7.
Image pending generation: graph for 7.
With reference to Q7-fig1, describe the pattern of river discharge across the year. [3]
8. A survey shows 45% of residents walk to school, 30% take bus, 15% take MRT, 10% cycle. Convert these percentages into angles for a pie chart. [3]
Section B: Map and Photograph Analysis (Questions 9–14) [18 marks]
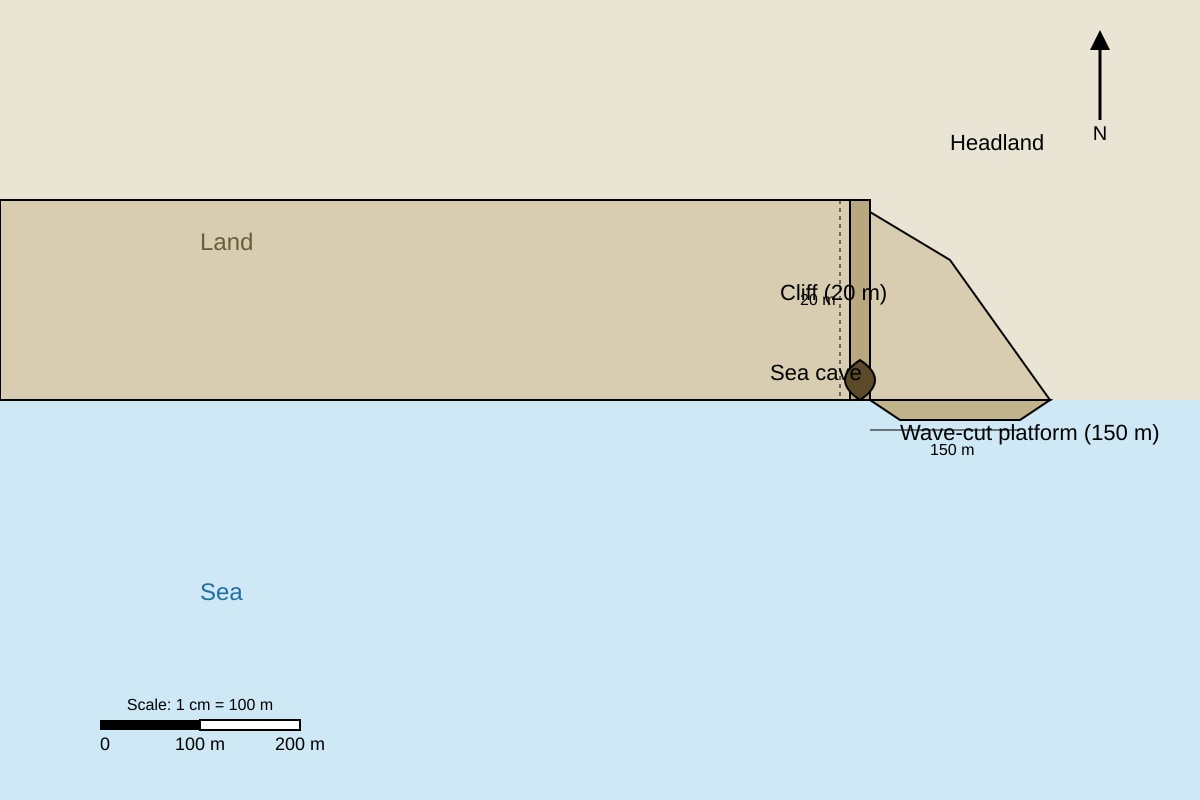
9.
Image pending generation: map for 9.
Study Map Q9-fig1. Identify TWO coastal landforms shown and describe one observable feature of each. [4]
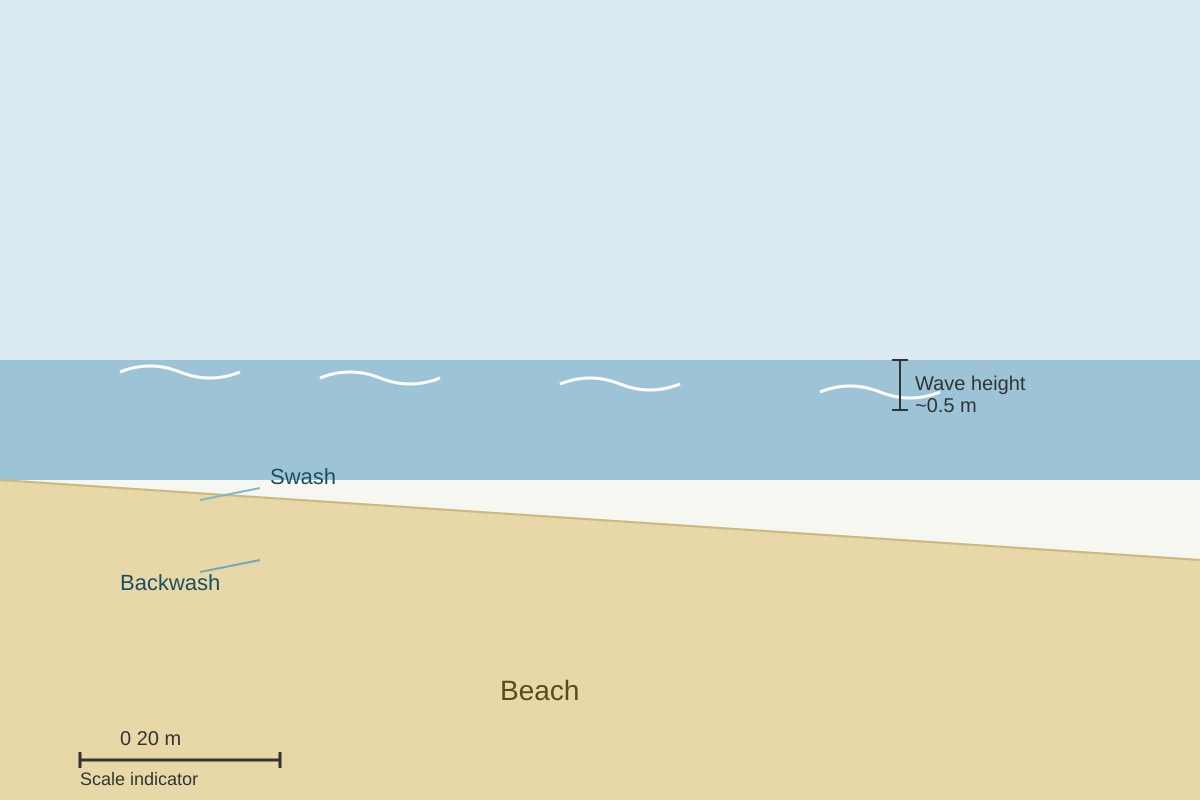
10.
Image pending generation: photograph for 10.
With reference to Photograph Q10-fig1, describe the type of waves shown and explain one characteristic. [3]
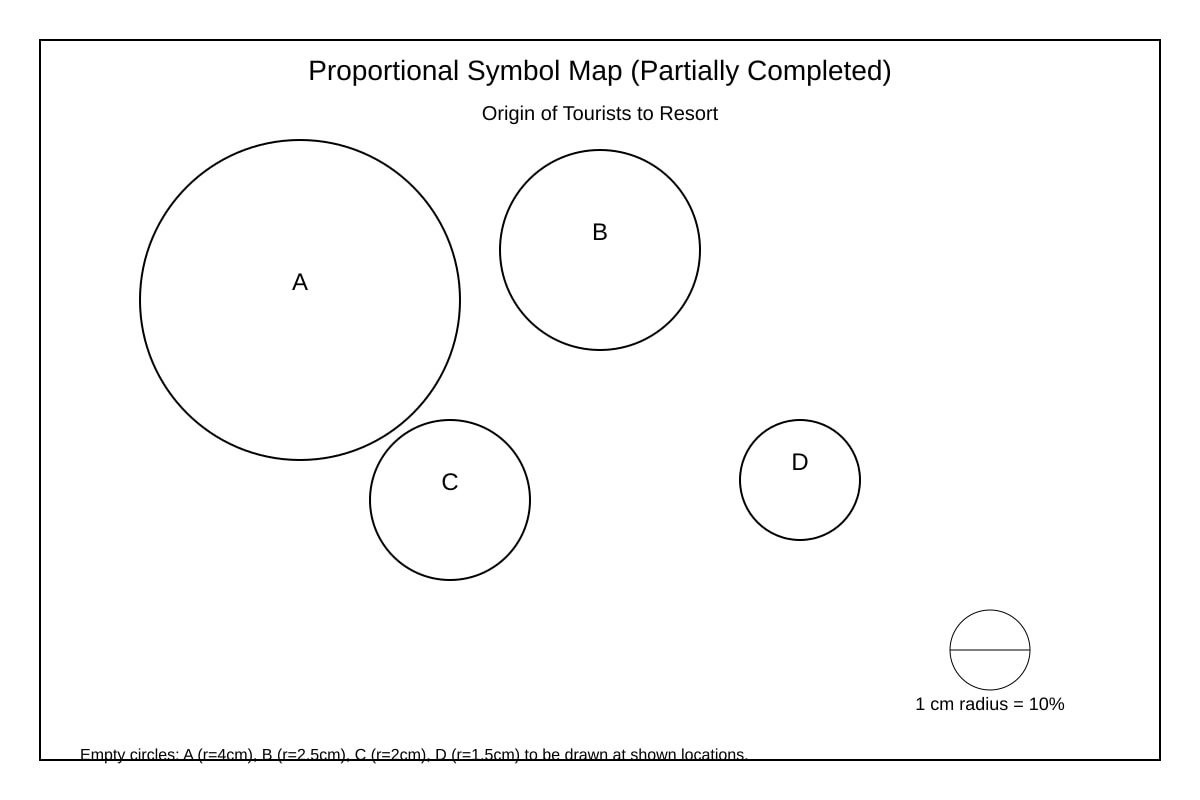
11. Table 4 shows origin of tourists to a resort. Fig Q11-fig1 is a partially completed proportional symbol map. Use Table 4 to complete the map with correct symbol sizes. [3]
| Country | Tourists (%) |
|---|---|
| A | 40 |
| B | 25 |
| C | 20 |
| D | 15 |
Image pending generation: map for 11.
12.
Image pending generation: map for 12.
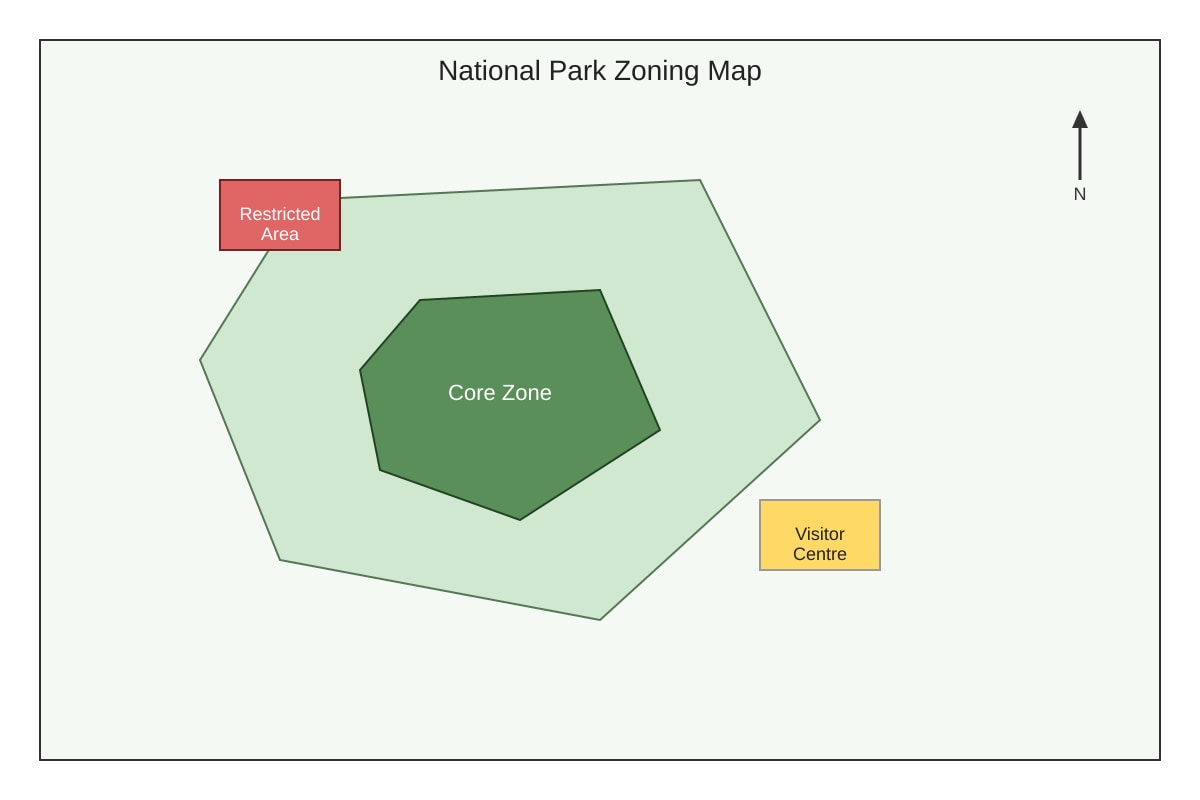
With reference to Map Q12-fig1, explain how zoning helps conserve the ecosystem. [3]
13. A student uses a topographic map with contour interval 10 m. Point X is at 50 m, Point Y at 110 m, map distance 4 cm, scale 1:25 000. Calculate the gradient between X and Y. [3]
14.
Image pending generation: photograph for 14.
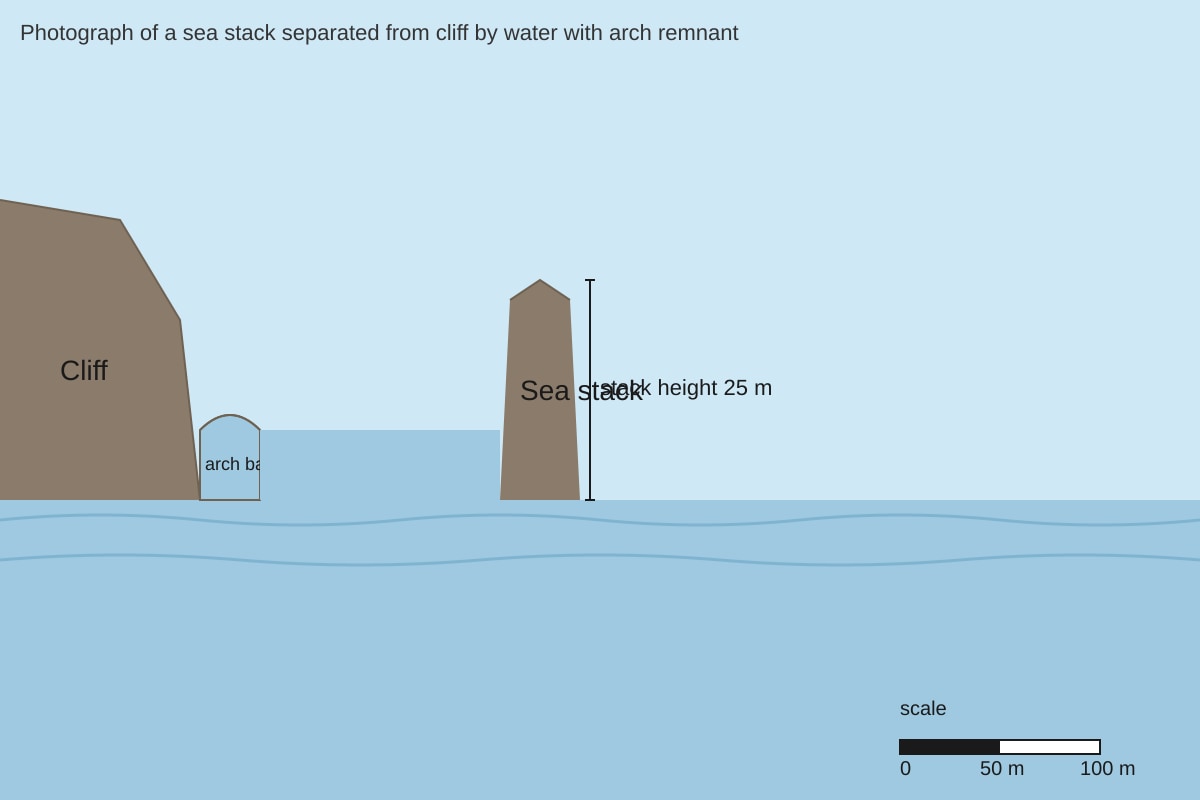
Study Photograph Q14-fig1. Name the landform and account for its formation. [2]
Section C: Integrated Data Skills (Questions 15–20) [18 marks]
15. Table 5 shows energy use in a household. Draw a pie chart and calculate the angle for air-con use. [3]
| Appliance | kWh/month |
|---|---|
| Air-con | 300 |
| Fridge | 150 |
| Lighting | 50 |
| Others | 100 |
16.
Image pending generation: graph for 16.
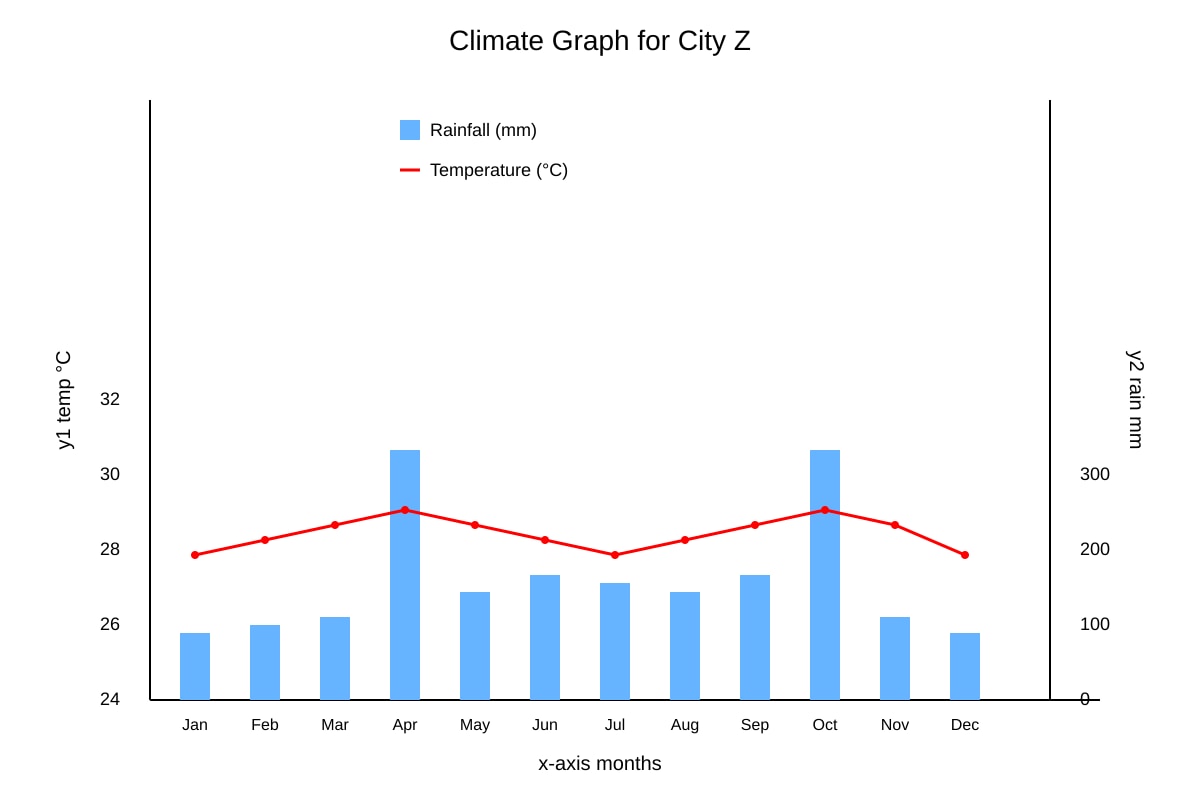
Using Q16-fig1, state the climate type and give one evidence point from the graph. [3]
17. A field study sampled 200 students on transport mode. 80 took bus, 60 walked, 40 cycled, 20 car. What percentage walked? Show working. [2]
18.
Image pending generation: table for 18.
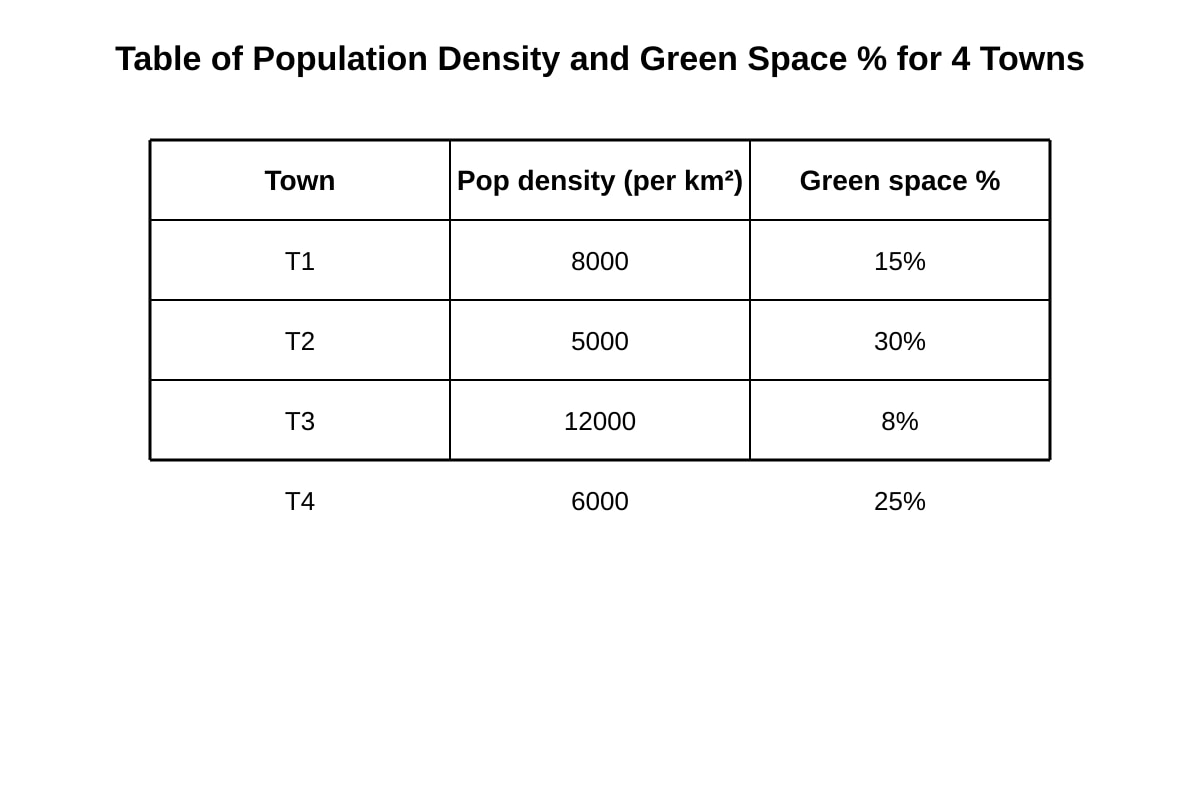
Using Q18-fig1, describe the relationship between population density and green space. [3]
19. Construct a scatter plot for the following data of temperature (°C) and ice-cream sales ($): (28, 40), (30, 55), (32, 70), (34, 85), (36, 100). [4]
20. A map scale is 1:50 000. Two points are 5 cm apart on map. What is the actual distance in km? Show working. [3]
Answers
Answer Key — TuitionGoWhere Exam Practice (AI) Preliminary Practice Paper
Geography Secondary 4 — Version 5 of 5 (Map, Graph & Data Skills)
Total Marks: 60
Section A Answers (24 marks)
Q1 [3]
- Total visitors = 120+80+60+40 = 300.
- Angles: MRT (120/300)×360 = 144°; Bus (80/300)×360 = 96°; Car (60/300)×360 = 72°; Cycling (40/300)×360 = 48°.
- Marking: 1 mark angle calc, 1 mark accurate plot, 1 mark title+legend.
- Teaching: Pie chart angles sum to 360°. Divide each value by total then ×360.
Q2 [2]
- Sum = 200+150+180+170+190+160 = 1050 mm.
- Mean = 1050 ÷ 6 = 175 mm.
- Marks: 1 for sum, 1 for mean. Common mistake: dividing by 5.
Q3 [3]
- Time: 0800, 1000, 1200, 1400, 1600, 1800.
- Plot points (0800,26), (1000,28), (1200,31), (1400,33), (1600,30), (1800,27).
- Marks: 1 scale+labels, 1 correct points, 1 line joined.
- Teaching: Line graph shows change over time; x-axis is time.
Q4 [2]
- Highest: Indonesia (1500 thousand). Lowest: Philippines (500 thousand).
- Marks: 1 each. Use bar heights from Q4-fig1.
Q5 [3]
- Total = 28 km². Draw bar divided into segments: Res 12 (42.9%), Ind 8 (28.6%), Green 5 (17.9%), Com 3 (10.7%).
- Marks: 1 total/scale, 1 segments, 1 labels.
Q6 [2]
- Increase = 65 000 – 50 000 = 15 000.
- % = (15 000 / 50 000) × 100 = 30%.
- Marks: 1 calc, 1 answer.
Q7 [3]
- Pattern: Low discharge Jan–Sep (18–55), peaks Nov (90) and Feb (80), secondary rise Oct–Dec.
- Marks: 1 low period, 1 peaks identified, 1 overall description. Ref Q7-fig1.
Q8 [3]
- Angles: Walk 45%→162°, Bus 30%→108°, MRT 15%→54°, Cycle 10%→36°. (×3.6 per %)
- Marks: 1 each for correct conversions (or all 3 at 1 mark each grouped).
Section B Answers (18 marks)
Q9 [4]
- Landforms: Cliff, wave-cut platform, sea cave, headland (any 2).
- Features: Cliff 20 m high; platform 150 m long; cave at base.
- Marks: 1 id + 1 desc each (2 pairs). Use Q9-fig1 labels.
Q10 [3]
- Type: Constructive waves (low height 0.5 m, gentle swash > backwash).
- Characteristic: Low angle, build beach.
- Marks: 1 type, 2 chars. Photo Q10-fig1 shows small waves.
Q11 [3]
- Radii: A 4 cm, B 2.5 cm, C 2 cm, D 1.5 cm (10% = 1 cm).
- Marks: 1 each correct symbol (or 3 total). Complete Q11-fig1.
Q12 [3]
- Core zone restricts access → protects wildlife; buffer allows limited use; visitor centre educates.
- Marks: 1 core, 1 buffer, 1 centre. Map Q12-fig1 shows zones.
Q13 [3]
- Vertical diff = 110–50 = 60 m.
- Map dist 4 cm = 4×25000 = 100 000 cm = 1000 m.
- Gradient = 60/1000 = 1:16.7 or 6%.
- Marks: 1 vert, 1 horiz, 1 ratio.
Q14 [2]
- Landform: Sea stack.
- Formation: Arch collapsed after erosion, leaving stack.
- Marks: 1 name, 1 process. Photo Q14-fig1.
Section C Answers (18 marks)
Q15 [3]
- Total = 600 kWh. Air-con angle = (300/600)×360 = 180°.
- Marks: 1 total, 1 angle, 1 pie drawn.
- Teaching: Air-con half of total → semicircle.
Q16 [3]
- Type: Tropical rainforest (or equatorial).
- Evidence: Temp 26–30 all months, rain >200 mm peaks.
- Marks: 1 type, 2 evidence from Q16-fig1.
Q17 [2]
- Walked = 60/200 × 100 = 30%.
- Marks: 1 working, 1 answer.
Q18 [3]
- Relationship: Higher density → lower green space (T3 12000/8% vs T2 5000/30%).
- Marks: 1 trend, 2 examples from Q18-fig1.
Q19 [4]
- Plot 5 points, axis temp x, sales y. Positive correlation.
- Marks: 1 axes, 1 points, 1 trend, 1 label.
Q20 [3]
- Actual = 5 cm × 50 000 = 250 000 cm = 2.5 km.
- Marks: 1 mult, 1 convert, 1 unit.
Free quiz and exam paper access
Enter your details to view this paper
Your access is remembered on this device.