From Real Exams Exam Paper
Secondary 4 Geography Preliminary Examination Paper 4
Free Sec 4 Geography Prelim Paper 4, HY3 Exam version, with questions, answers, and O Level-style practice for Singapore students.
These static practice materials are generated from the site's syllabus and paper-generation workflow, with source and model context shown so students and parents can evaluate the material before use.
Questions
TuitionGoWhere Practice Paper - Geography Secondary 4 (PRELIM)
School: TuitionGoWhere Exam Practice (AI)
Subject: Geography
Level: Secondary 4
Paper: Prelim Practice (Version 4 of 5)
Duration: 60 minutes
Total Marks: 60
Name: ___________________________
Class: ____________
Date: ____________
Instructions:
- This paper contains 20 questions on Map, Graph & Data Skills.
- Section A: Data Interpretation (Questions 1–8)
- Section B: Graph Construction & Mapping (Questions 9–14)
- Section C: Source-Based Data Analysis (Questions 15–20)
- Write your answers in the spaces provided.
- Use the data and figures given. For visual questions, the required diagram details are stated.
Section A: Data Interpretation (16 marks)
1. Study the table below showing visitor arrivals to a coastal town from different regions in 2023.
| Region | Number of Visitors |
|---|---|
| North | 1200 |
| South | 800 |
| East | 1500 |
| West | 500 |
What is the total number of visitors? [1]
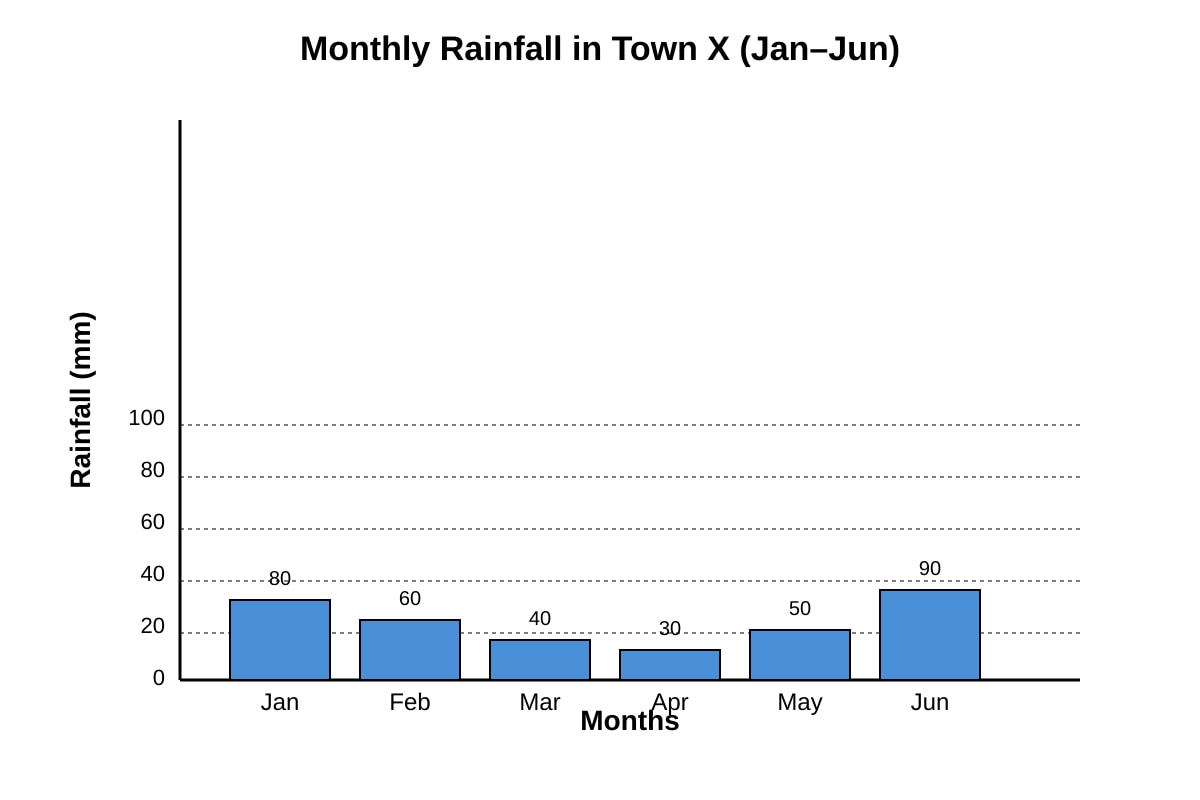
2. Study the bar graph described below.
Image pending generation: graph for Q2.
State the month with the highest rainfall. [1]
3. Using the bar graph in Q2, calculate the range of rainfall from January to June. [2]
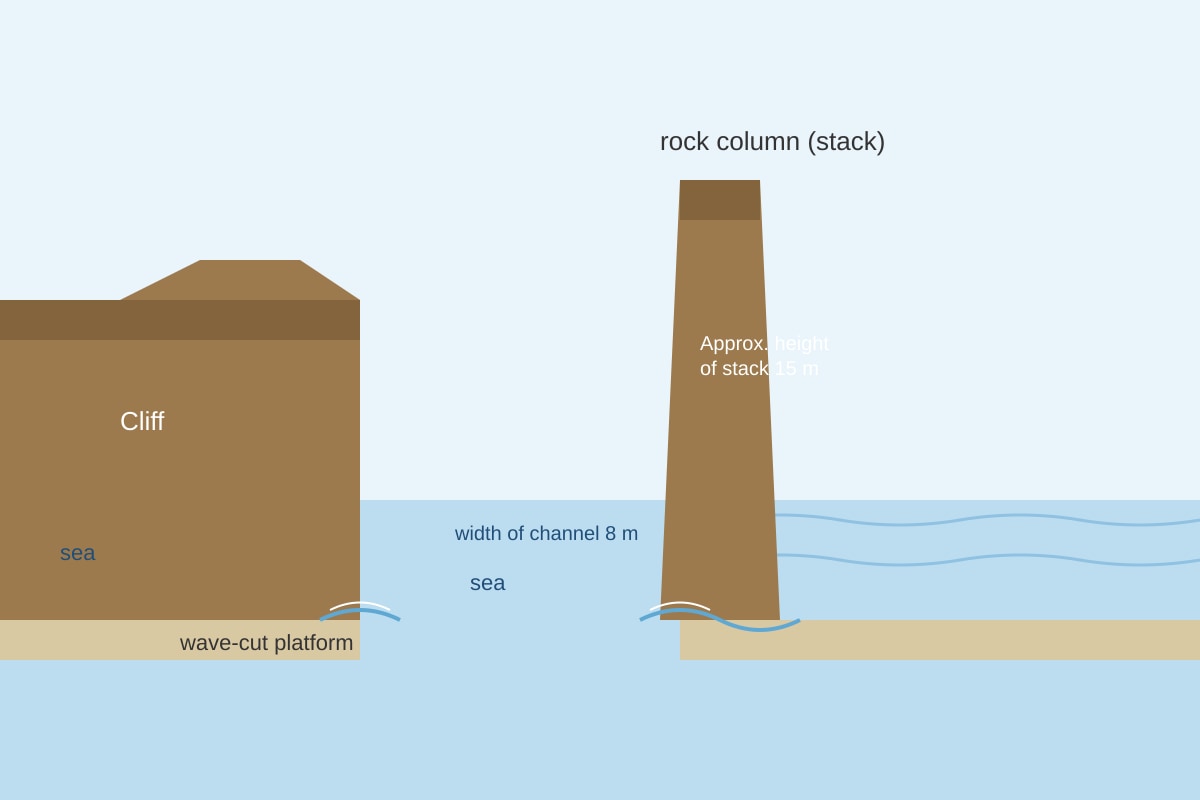
4. Study Photograph A below.
Image pending generation: figure for Q4.
Identify the coastal landform shown in Photograph A. [1]
5. With reference to Photograph A (Q4), describe TWO observable features of the landform. [2]
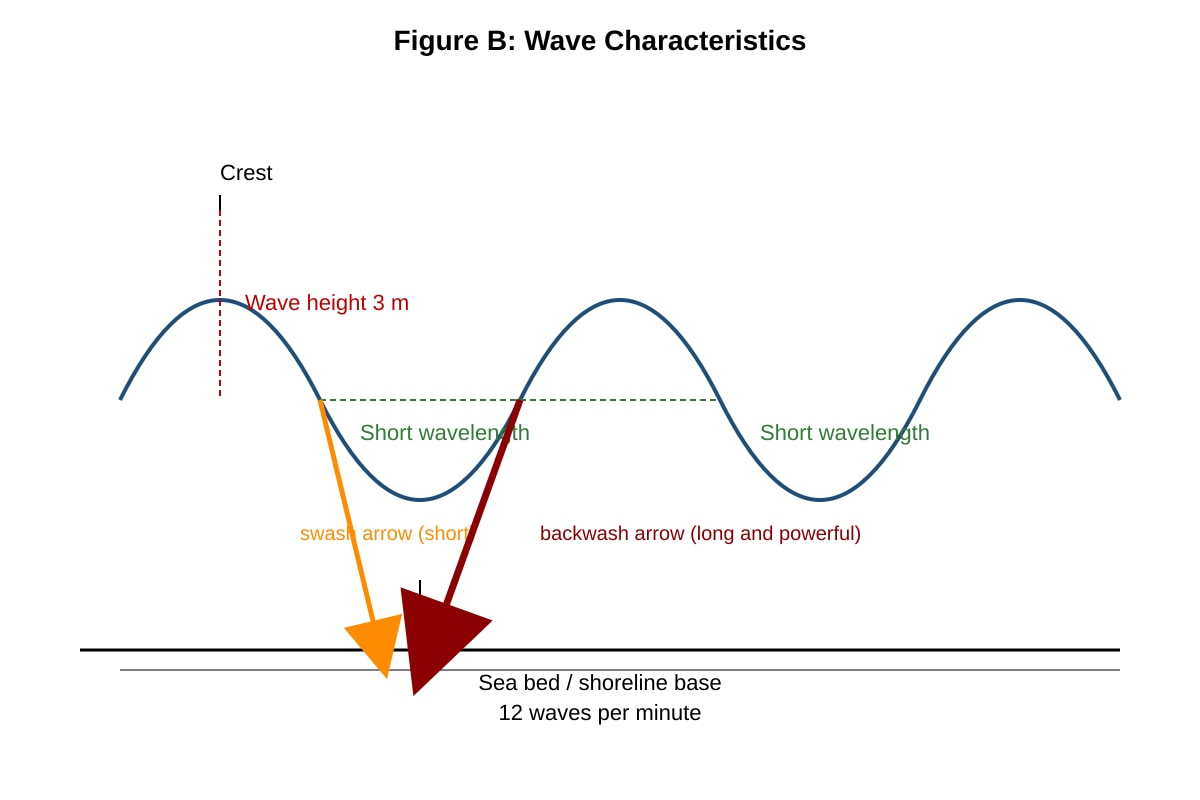
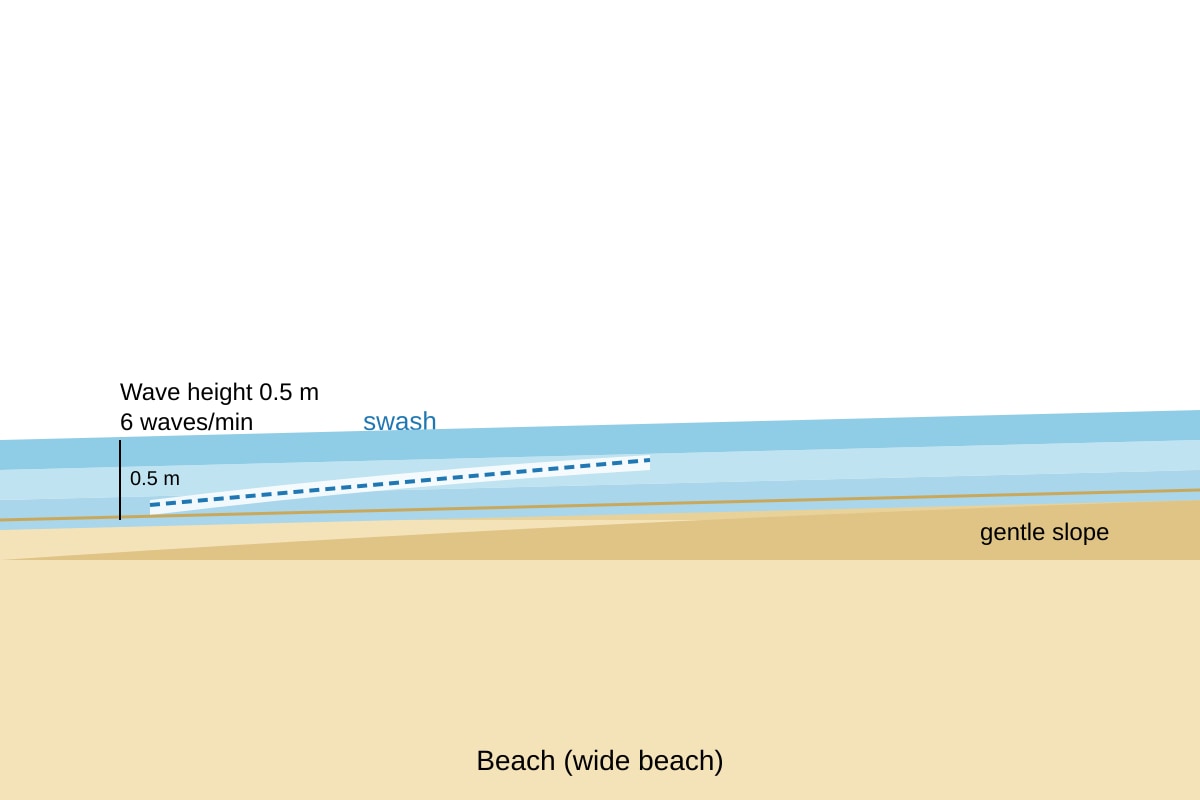
6. Study Figure B showing wave characteristics.
Image pending generation: diagram for Q6.
Describe the type of waves shown in Figure B. [3]
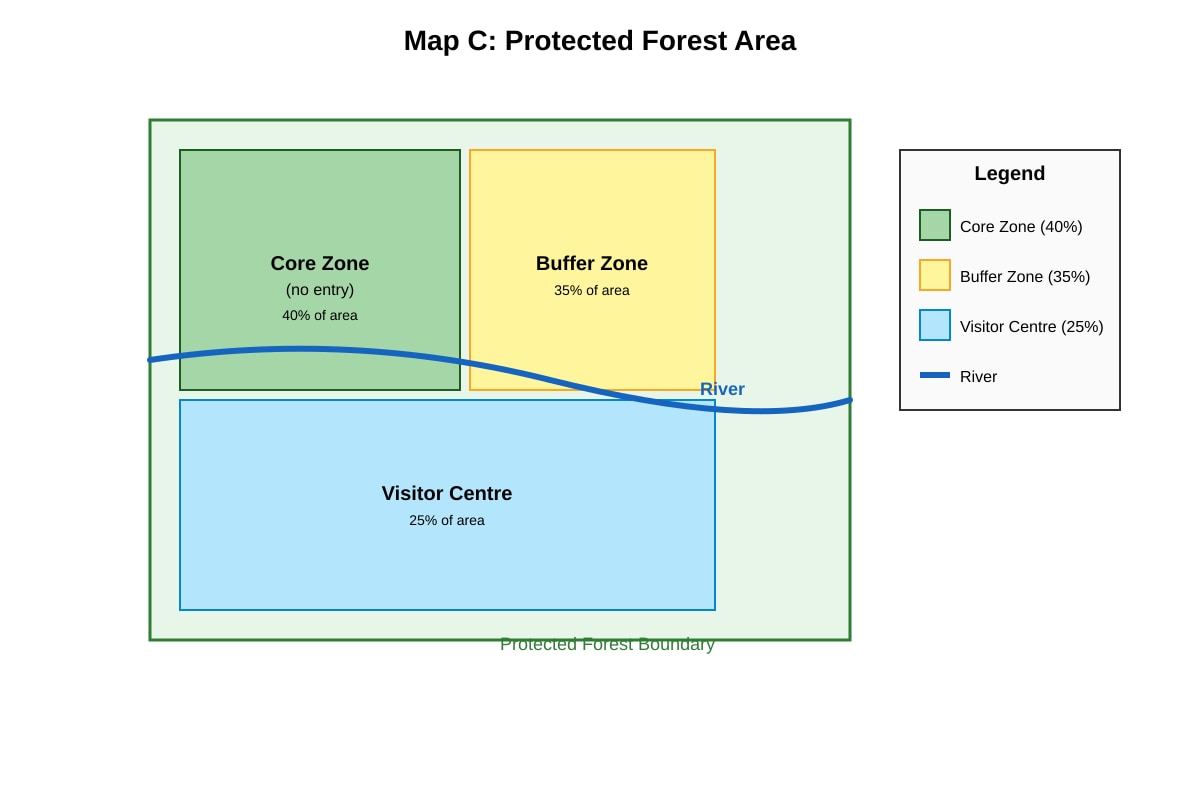
7. Study Map C.
Image pending generation: map for Q7.
With reference to Map C, explain how zoning helps conserve the forest. [4]
8. A table shows temperature (°C) at 2-hour intervals: 24, 26, 29, 31, 30, 27. What is the mean temperature? [2]
Section B: Graph Construction & Mapping (18 marks)
9. Table below shows modes of transport used by students.
| Mode | Students |
|---|---|
| Bus | 40 |
| Train | 30 |
| Cycle | 20 |
| Walk | 10 |
Plot a pie chart to represent the data. Show all angle calculations. [3]
10. Using the table in Q9, what percentage of students took the bus? [1]
11. Study Table D showing tourist origins.
| Country | Visitors |
|---|---|
| A | 500 |
| B | 300 |
| C | 200 |
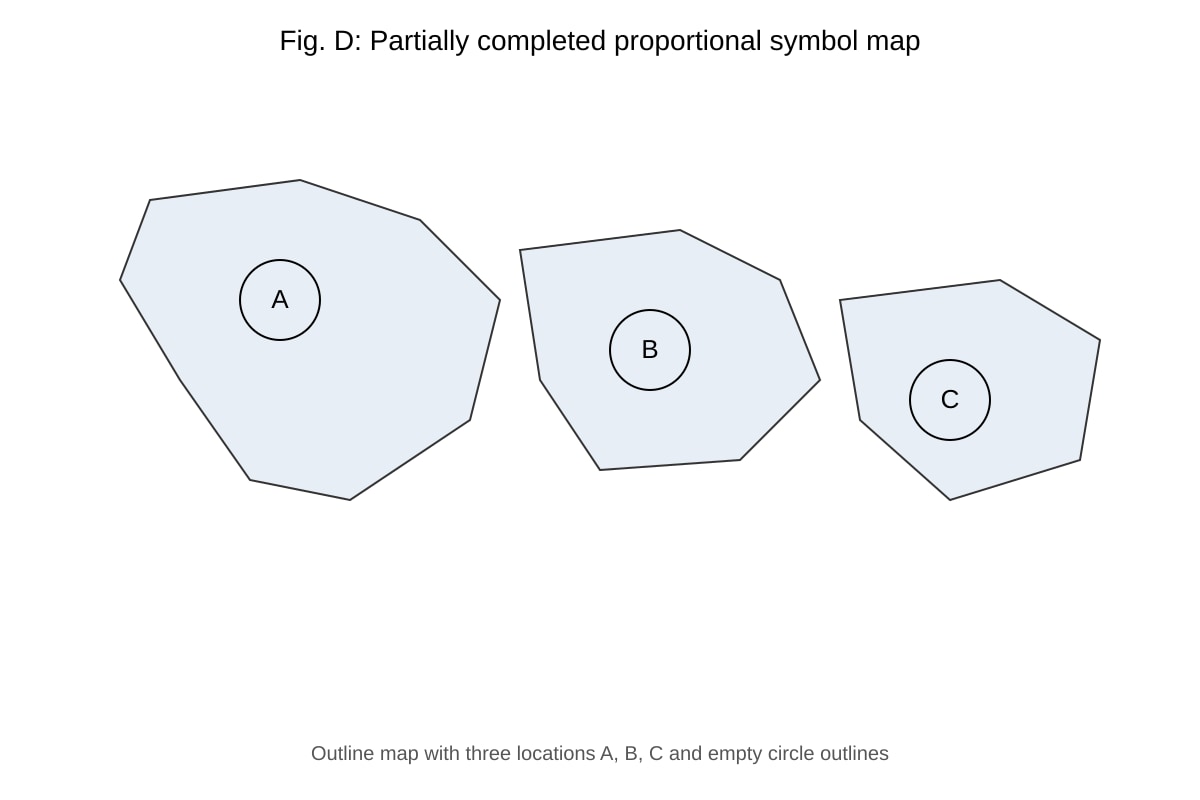
Fig. D is a partially completed map with circles for A, B, C but no sizes.
Image pending generation: map for Q11.
Use Table D to complete the proportional symbol map (use 1 cm = 100 visitors). [3]
12. A student recorded river depth (cm) at sites: 20, 35, 50, 65. Construct a line graph of depth against site number (1–4). [3]
13. From the line graph in Q12, state the trend in depth downstream. [2]
14. Study the incomplete choropleth map description: Regions 1–4 have values 10, 20, 30, 40. Shade Region 3 with the correct intensity (darker = higher). Describe the shading you would use. [3]
Section C: Source-Based Data Analysis (26 marks)
15. Study Table E on water usage in litres per day.
| Household | Usage |
|---|---|
| H1 | 200 |
| H2 | 250 |
| H3 | 150 |
| H4 | 300 |
| H5 | 100 |
Calculate the total and mean usage. [3]
16. Using Table E (Q15), draw a bar chart of the five households. [3]
17. Study Photograph F of a beach.
Image pending generation: figure for Q17.
Describe the wave type and explain how it builds the beach. [4]
18. Map G shows a national park with restricted zones and roads.
Image pending generation: map for Q18.
With reference to Map G, explain how the park design reduces human impact. [4]
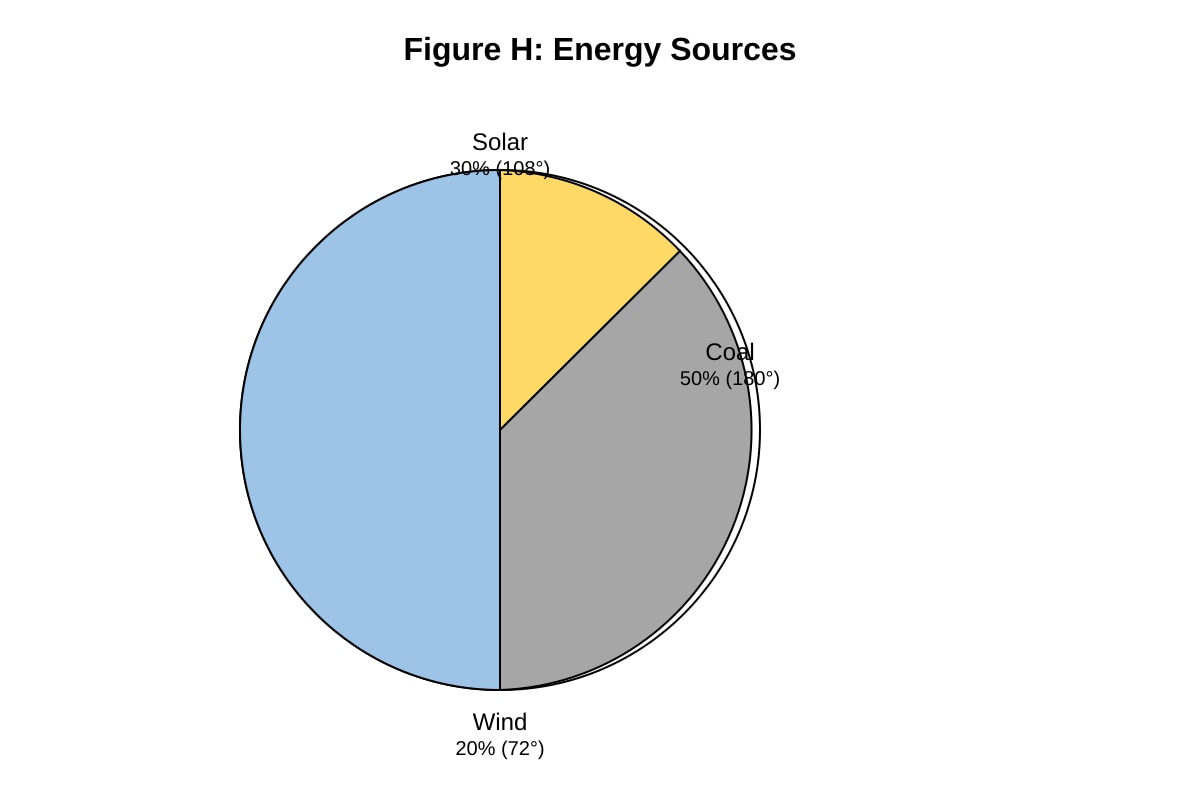
19. Figure H shows a pie chart of energy sources: Solar 30%, Coal 50%, Wind 20%.
Image pending generation: chart for Q19.
State the most used source and calculate its angle. [2]
20. A fieldwork study collected 100 responses on transport to school: Bus 45, MRT 35, Walk 20. Construct a pie chart and write a conclusion on dominant mode. [7]
Answers
Answer Key: TuitionGoWhere Practice Paper - Geography Secondary 4 (PRELIM) Version 4
Total Marks: 60
Section A: Data Interpretation (16 marks)
Q1 [1]
Total = 1200 + 800 + 1500 + 500 = 4000 visitors.
Teaching note: Add all values from the table. Common mistake: miscopying a number.
Q2 [1]
June (90 mm).
Teaching note: Read the highest bar from the graph values given.
Q3 [2]
Range = Max – Min = 90 – 30 = 60 mm.
[1] for identifying max 90, [1] for min 30 and subtraction.
Teaching note: Range shows spread of data.
Q4 [1]
Stack (coastal stack).
Teaching note: Isolated rock column from cliff = stack.
Q5 [2]
Any two: (1) tall rock column ~15 m; (2) separated by 8 m channel; (3) wave-cut platform at base.
[1] each.
Teaching note: Use photograph evidence.
Q6 [3]
Destructive waves. [1]
Characteristics: large height (3 m), high frequency (12/min), backwash stronger than swash. [2]
Teaching note: Destructive waves erode coast; backwash > swash.
Q7 [4]
Core zone no entry protects 40% area; buffer reduces edge effect; visitor centre concentrates humans. [1] each point.
Teaching note: Zoning limits access to sensitive parts.
Q8 [2]
Mean = (24+26+29+31+30+27)/6 = 167/6 = 27.8°C. [1] sum, [1] divide.
Section B: Graph Construction & Mapping (18 marks)
Q9 [3]
Total = 100. Angles: Bus 40/100×360=144°, Train 108°, Cycle 72°, Walk 36°. [1] calc, [1] plot, [1] title/legend.
Q10 [1]
40/100×100 = 40%.
Q11 [3]
A: 5 cm, B: 3 cm, C: 2 cm circles. [1] each.
Q12 [3]
Plot points (1,20)(2,35)(3,50)(4,65); join line. [1] axes, [1] points, [1] line.
Q13 [2]
Depth increases downstream. [2] or [1] partial.
Q14 [3]
Region 3 (30) medium shading, darker than 10/20, lighter than 40. [1] describe, [2] correct order.
Section C: Source-Based Data Analysis (26 marks)
Q15 [3]
Total = 200+250+150+300+100 = 1000 L. [1]
Mean = 1000/5 = 200 L. [2]
Q16 [3]
Bar chart with H1–H5, heights 200,250,150,300,100. [1] axes, [1] bars, [1] labels.
Q17 [4]
Constructive waves (0.5 m, 6/min). [1]
Swash > backwash deposits sediment widening beach. [3]
Q18 [4]
Core 50% restricted; roads limit access; entrance controls flow; lake protected. [1] each.
Q19 [2]
Coal most used. Angle = 50%×360 = 180°. [1] source, [1] angle.
Q20 [7]
Total 100. Angles: Bus 162°, MRT 126°, Walk 72°. [3]
Pie chart drawn. [2]
Conclusion: Bus dominant (45%). [2]
Marking: calc 3, graph 2, conclusion 2.
Free quiz and exam paper access
Enter your details to view this paper
Your access is remembered on this device.