From Real Exams Exam Paper
Secondary 4 Geography Preliminary Examination Paper 3
Free Sec 4 Geography Prelim Paper 3, HY3 Exam version, with questions, answers, and O Level-style practice for Singapore students.
These static practice materials are generated from the site's syllabus and paper-generation workflow, with source and model context shown so students and parents can evaluate the material before use.
Questions
TuitionGoWhere Practice Paper - Geography Secondary 4 (PRELIM)
TuitionGoWhere Exam Practice (AI)
Subject: Geography
Level: Secondary 4
Paper: Prelim Practice (Version 3 of 5)
Duration: 60 minutes
Total Marks: 60
Name: ___________________________
Class: ________
Date: ____________
Instructions:
- This paper contains 20 questions on Map, Graph & Data Skills.
- Answer all questions in the spaces provided.
- Use the data, maps, and diagrams given to support your answers with evidence.
- Marks for each question are shown in brackets [ ].
Section A: Data Interpretation and Graph Construction (Questions 1–7) [21 marks]
1. The table below shows the mode of transport used by visitors to a nature reserve in Singapore.
| Mode of Transport | Number of Visitors |
|---|---|
| MRT | 120 |
| Bus | 80 |
| Car | 60 |
| Cycling | 40 |
Plot a pie chart to represent the data shown in the table. [3]
2. Study the table below showing the origin of tourists to Country X in 2023.
| Region | Percentage |
|---|---|
| Asia | 55% |
| Europe | 20% |
| Americas | 15% |
| Africa | 10% |
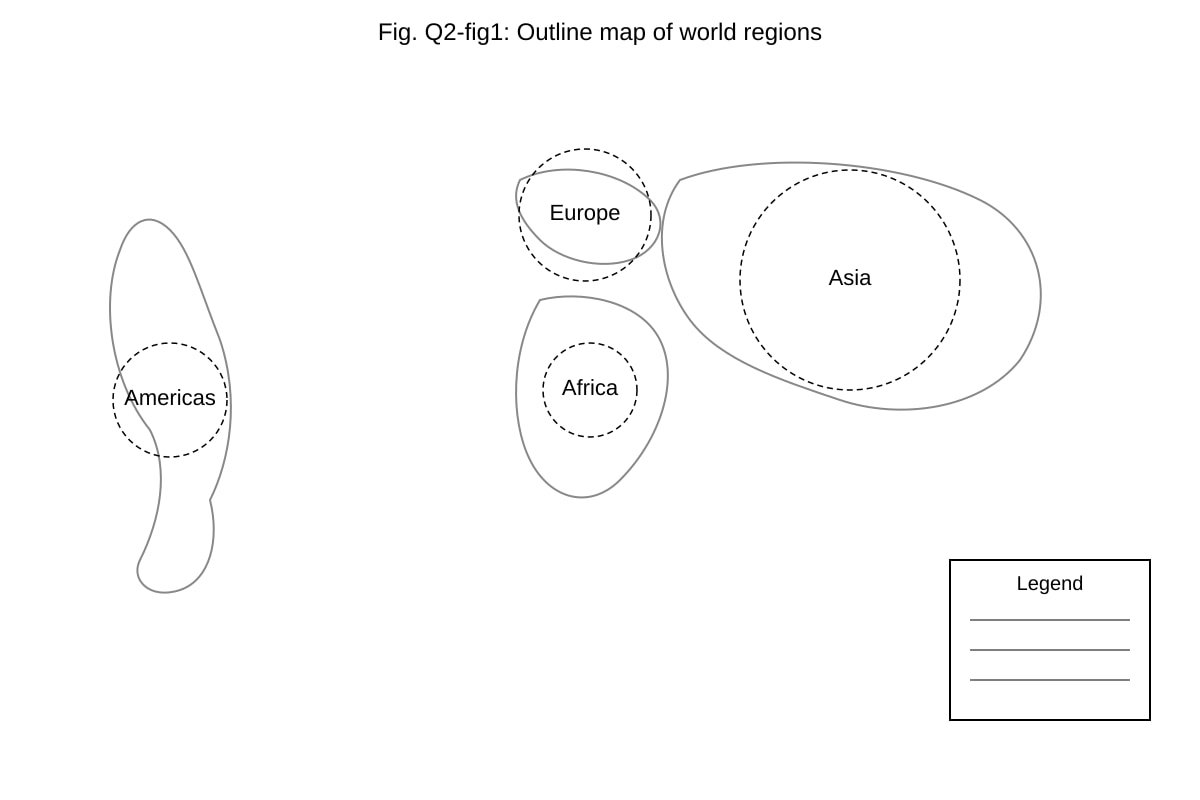
Image pending generation: map for Q2.
Fig. Q2-fig1 is a partially completed map. Use the data in the table to complete the map by drawing proportional symbols and filling in the legend. [3]
3. A student recorded the temperature (°C) at a weather station from 0800 to 1200 hours:
| Time | Temperature (°C) |
|---|---|
| 0800 | 26 |
| 0900 | 28 |
| 1000 | 30 |
| 1100 | 31 |
| 1200 | 33 |
Describe the trend shown in the table. [2]
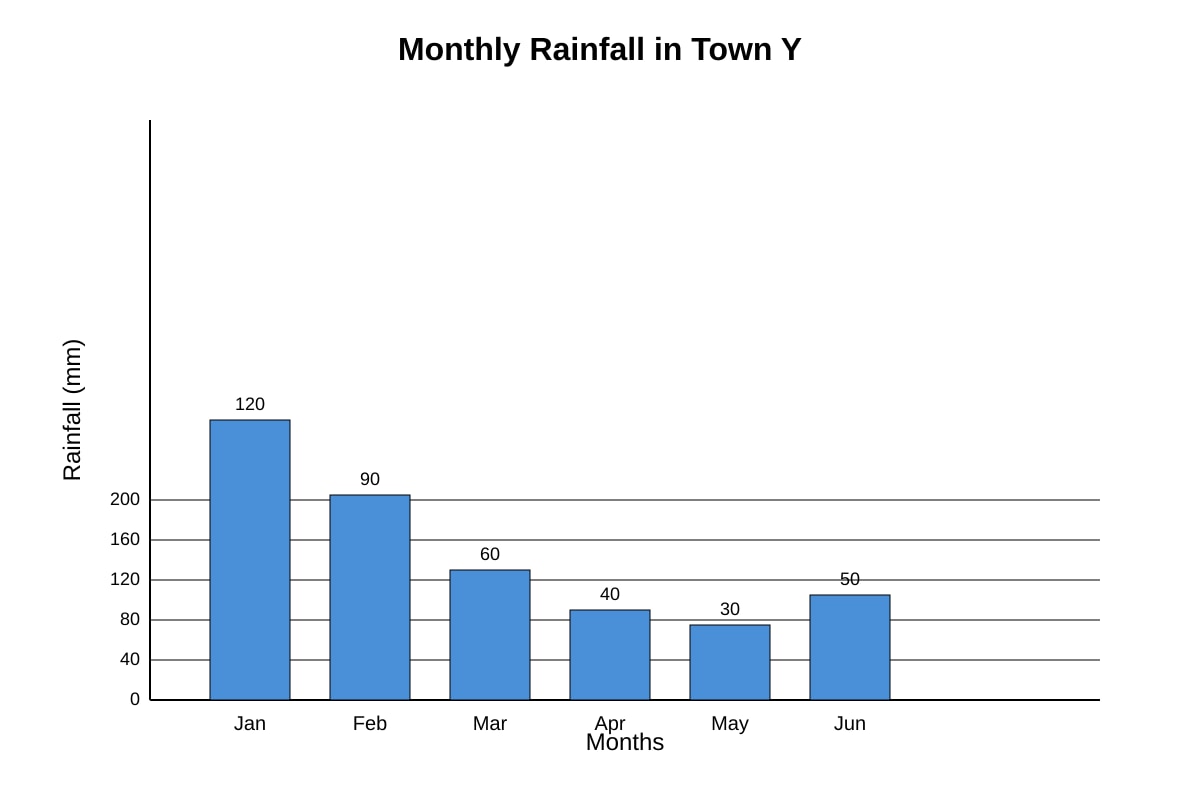
4. The bar chart below shows the monthly rainfall (mm) for Town Y.
Image pending generation: bar_chart for Q4.
With reference to Fig. Q4-fig1, calculate the mean monthly rainfall for the first half of the year. Show your working. [3]
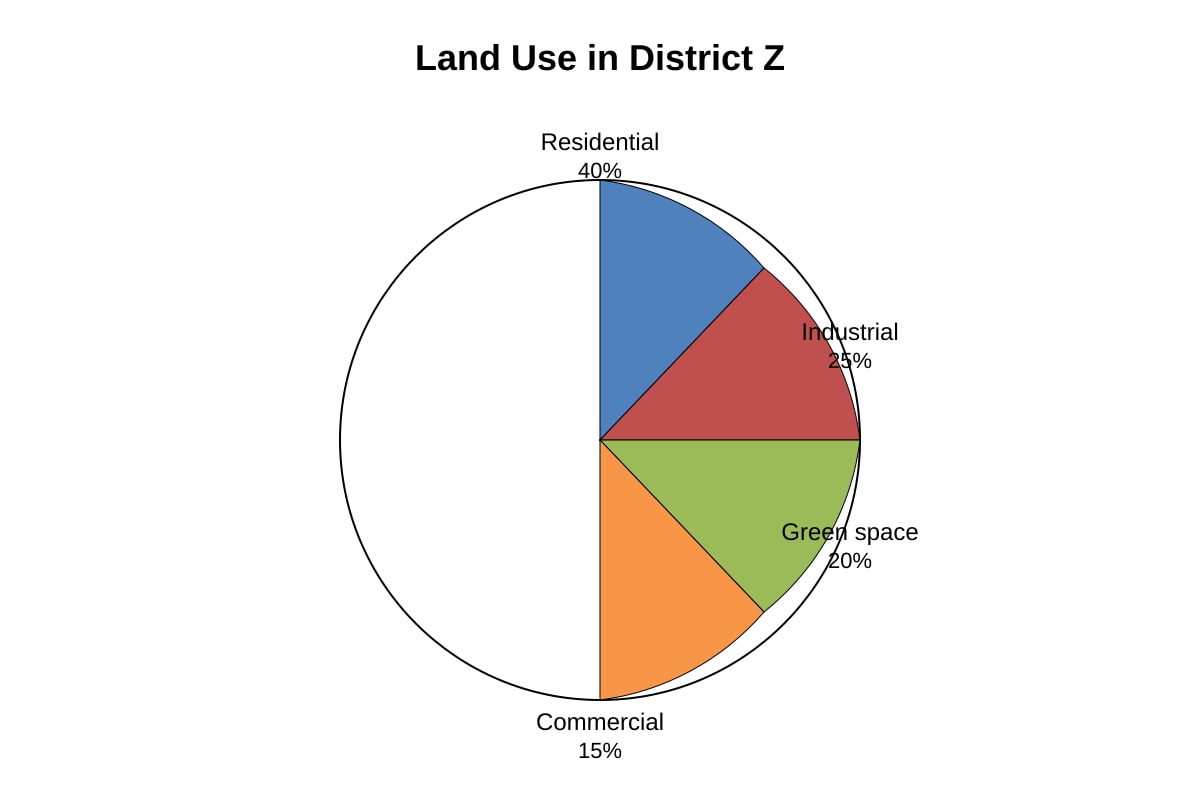
5. Study the pie chart in Fig. Q5-fig1 showing land use in District Z.
Image pending generation: pie_chart for Q5.
State the two largest categories of land use shown in Fig. Q5-fig1. [2]
6. The table shows the population density (people/km²) of three towns.
| Town | Density (people/km²) |
|---|---|
| A | 5000 |
| B | 3000 |
| C | 8000 |
Construct a bar graph to represent the data. Include a title and axis labels. [3]
7. A line graph shows the number of tourists visiting Island R from 2019 to 2023: 2019=100k, 2020=40k, 2021=60k, 2022=120k, 2023=150k.
Identify the year with the greatest increase in tourist numbers compared to the previous year. [2]
Section B: Map and Photograph Analysis (Questions 8–14) [21 marks]
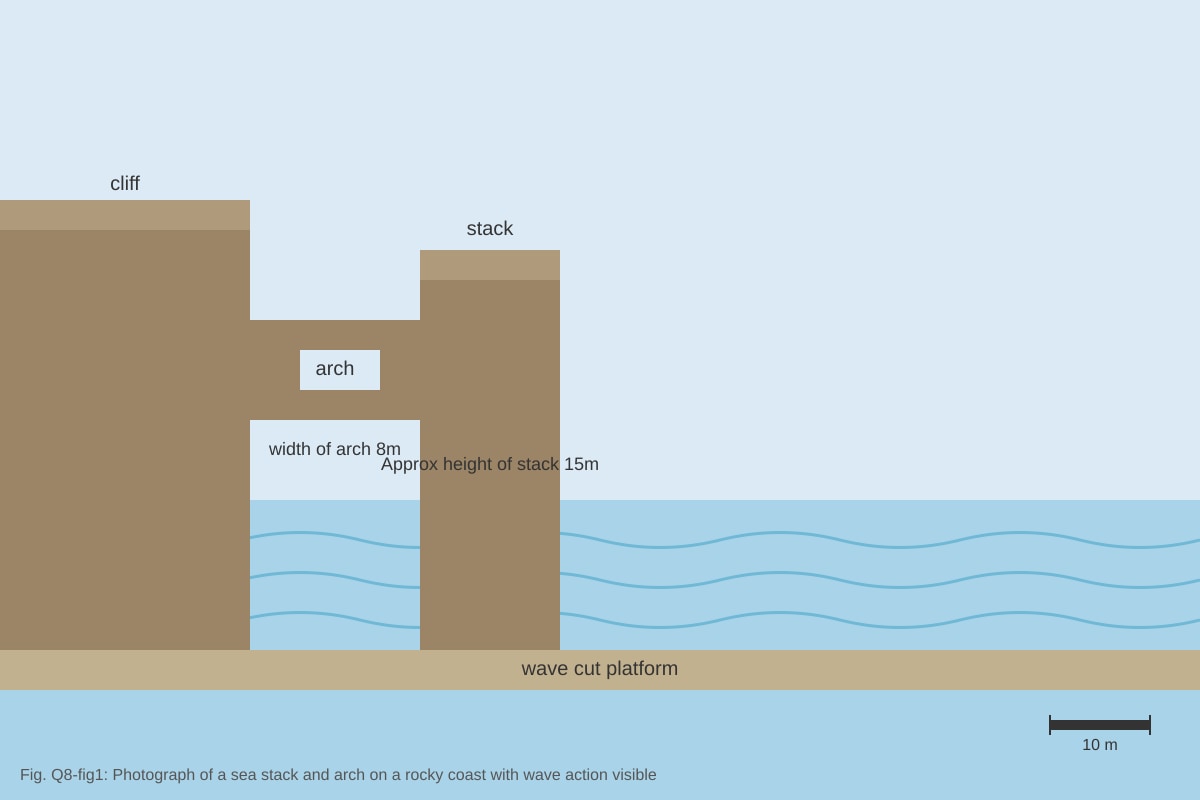
8. Study Photograph A (Fig. Q8-fig1) which shows a coastal landform.
Image pending generation: source_image for Q8.
Describe the features of the coastal landform and account for its formation. [5]
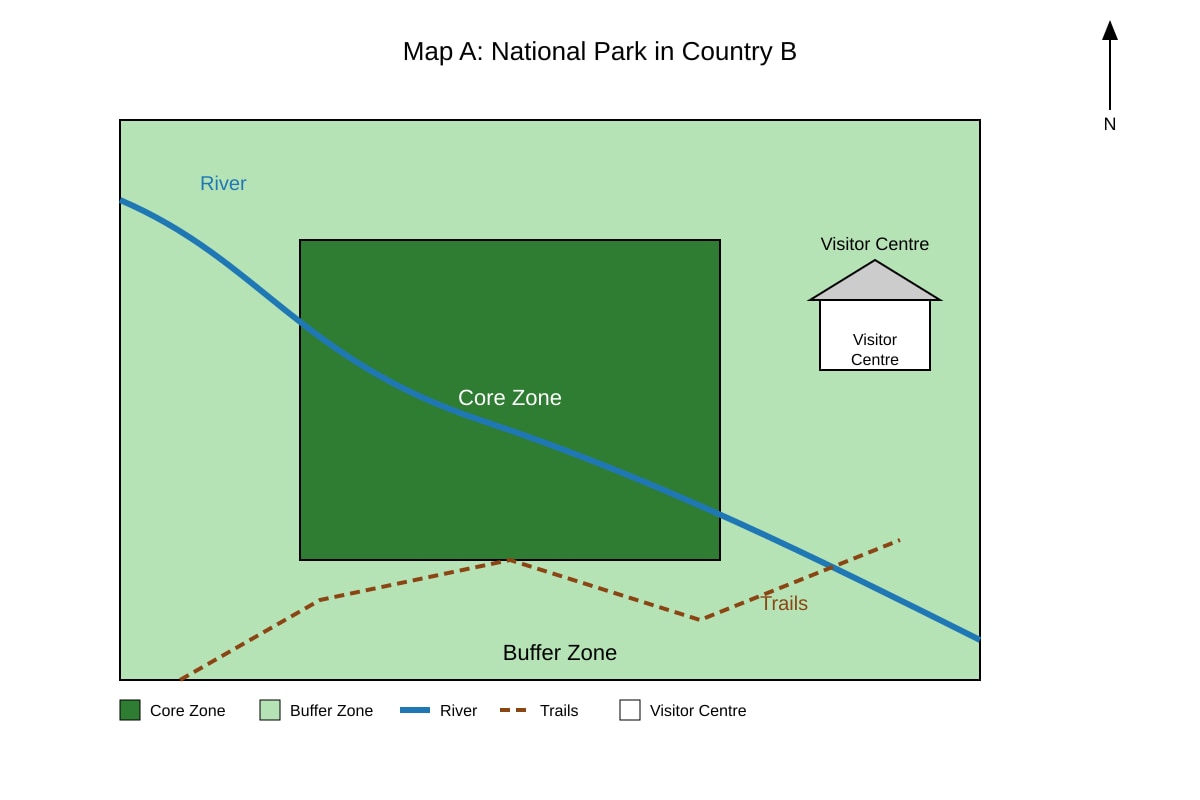
9. Study Map A (Fig. Q9-fig1) showing a national park in Country B.
Image pending generation: map for Q9.
With reference to Map A, explain how creating a National Park helps to conserve the quality of the forest ecosystem. [4]
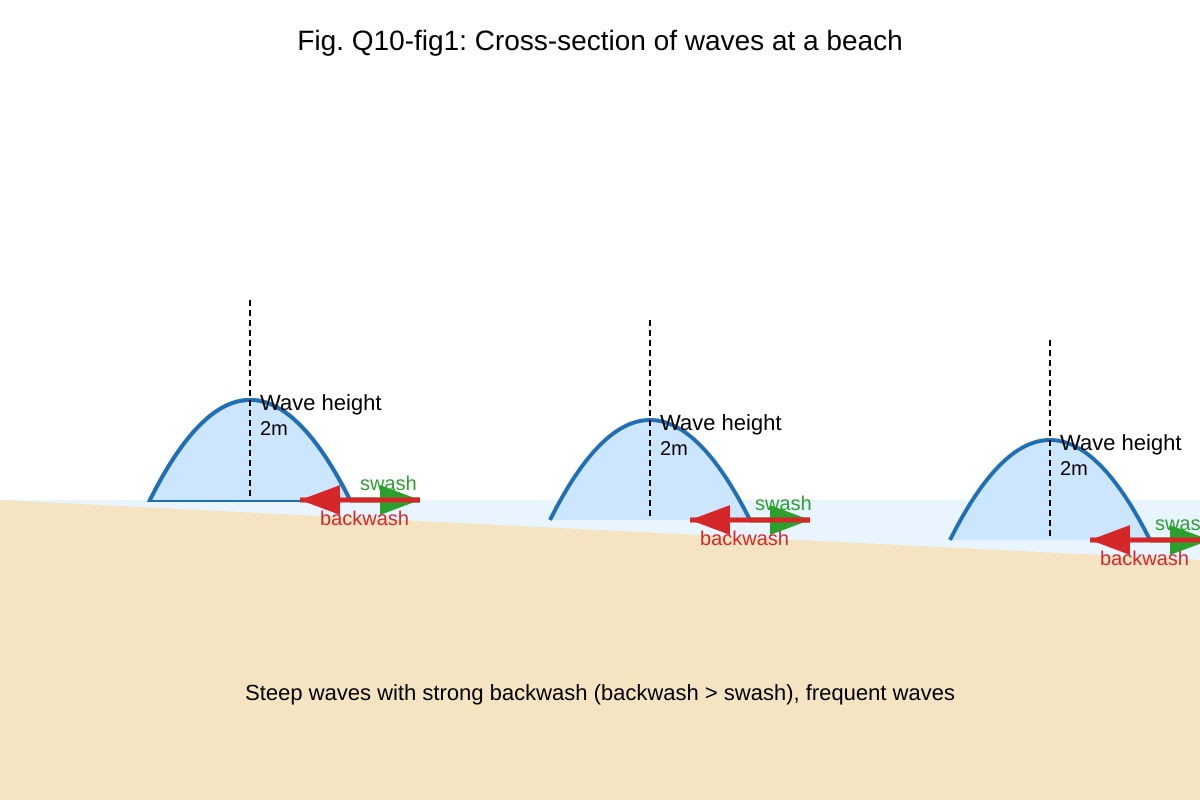
10. Fig. Q10-fig1 shows a diagram of waves at a beach.
Image pending generation: diagram for Q10.
Describe the type of waves associated with the signs seen in Fig. Q10-fig1. [3]
11. A choropleth map shows population density by district: North (dark), South (light), East (medium), West (medium).
State which district has the highest population density. [1]
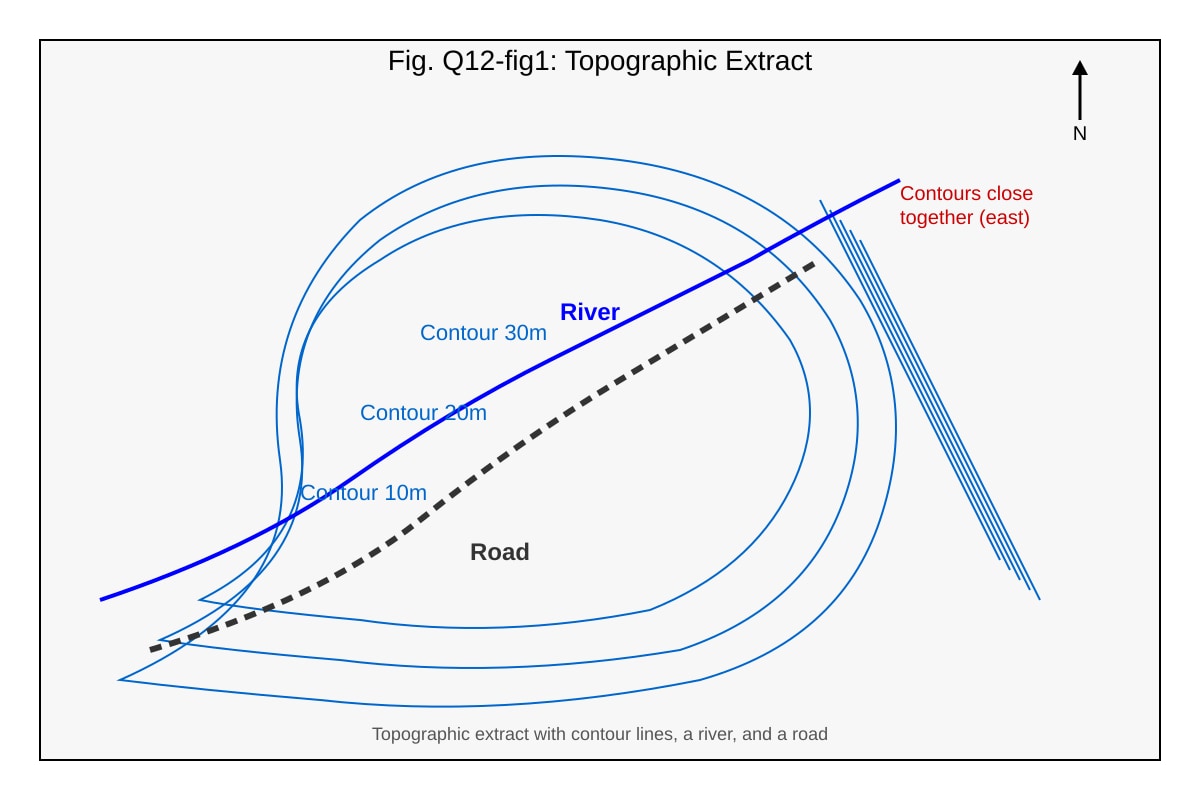
12. Study the extract from a topographic map below.
Image pending generation: map for Q12.
With reference to Fig. Q12-fig1, describe the slope of the eastern part of the map. [2]
13. The table shows the distance of towns from a city centre.
| Town | Distance (km) |
|---|---|
| P | 5 |
| Q | 12 |
| R | 20 |
On a map, these are to be shown as proportional circles. Which town should have the smallest circle? [1]
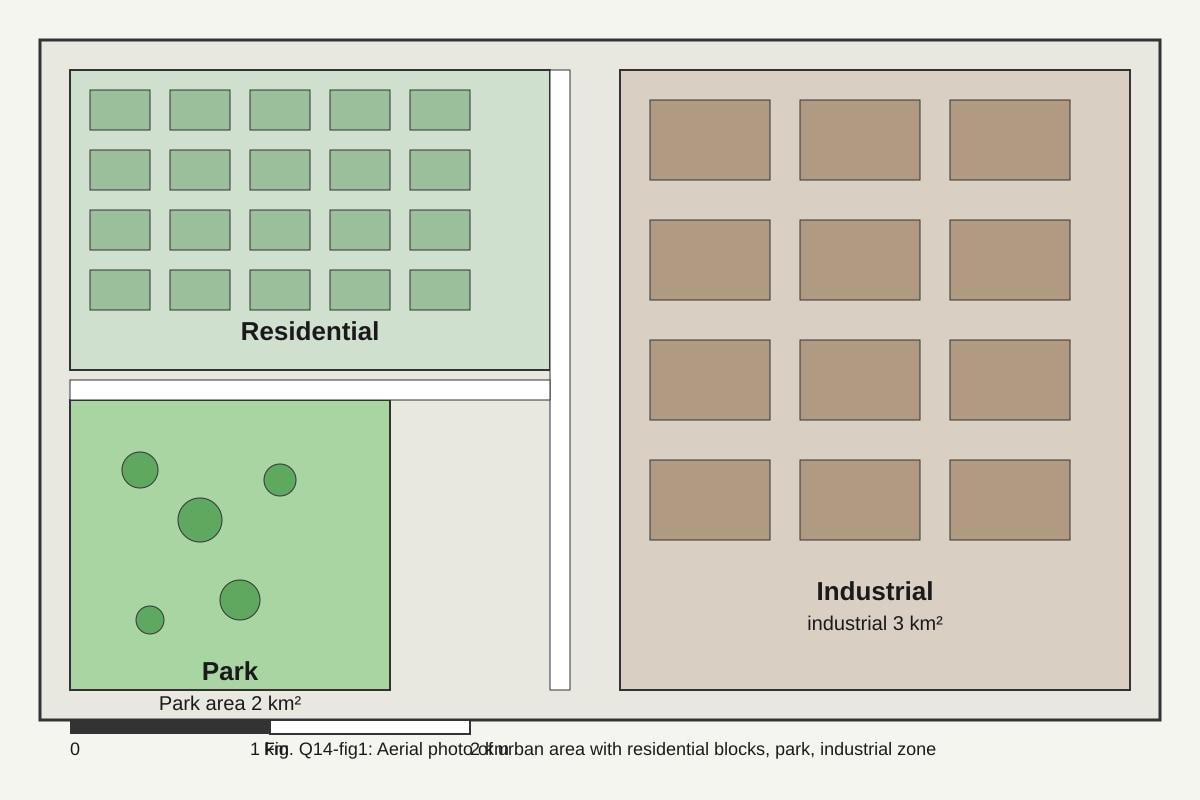
14. Study Photograph B (Fig. Q14-fig1) showing an urban area.
Image pending generation: source_image for Q14.
With reference to Photograph B, state two types of land use visible and one feature that shows sustainable planning. [3]
Section C: Data Skills and Synthesis (Questions 15–20) [18 marks]
15. A survey of 200 students asked their preferred fieldwork method. Results: Questionnaire 90, Observation 60, Mapping 50.
Calculate the percentage for each method. Show your working. [3]
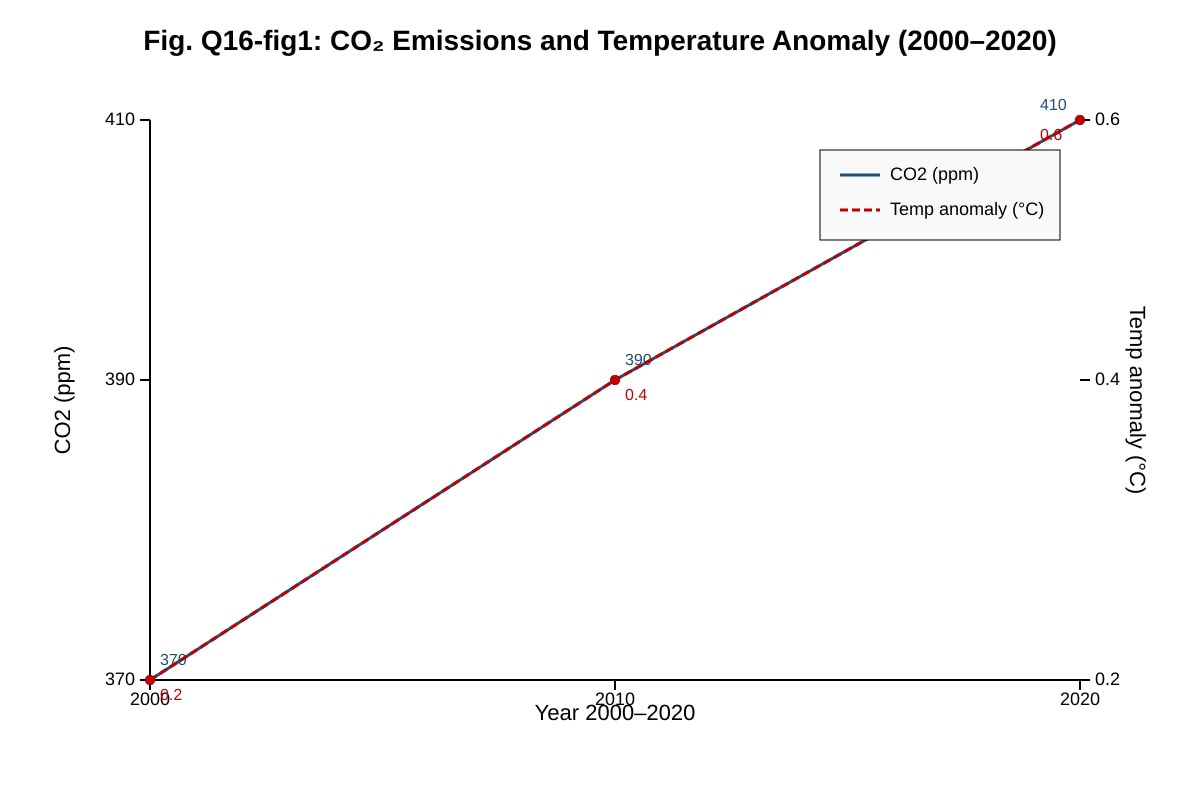
16. Study the graph in Fig. Q16-fig1 showing CO₂ emissions and temperature anomaly.
Image pending generation: graph for Q16.
With reference to Fig. Q16-fig1, describe the relationship between CO₂ emissions and temperature anomaly. [3]
17. The table below shows forest area (km²) in a country over time.
| Year | Forest Area |
|---|---|
| 2000 | 1000 |
| 2010 | 800 |
| 2020 | 600 |
Plot a line graph to show the change. Include title and labels. [3]
18. A map shows flood risk zones: High (red), Medium (yellow), Low (green). A new school is planned in a yellow zone.
State one reason why this may be a concern. [2]
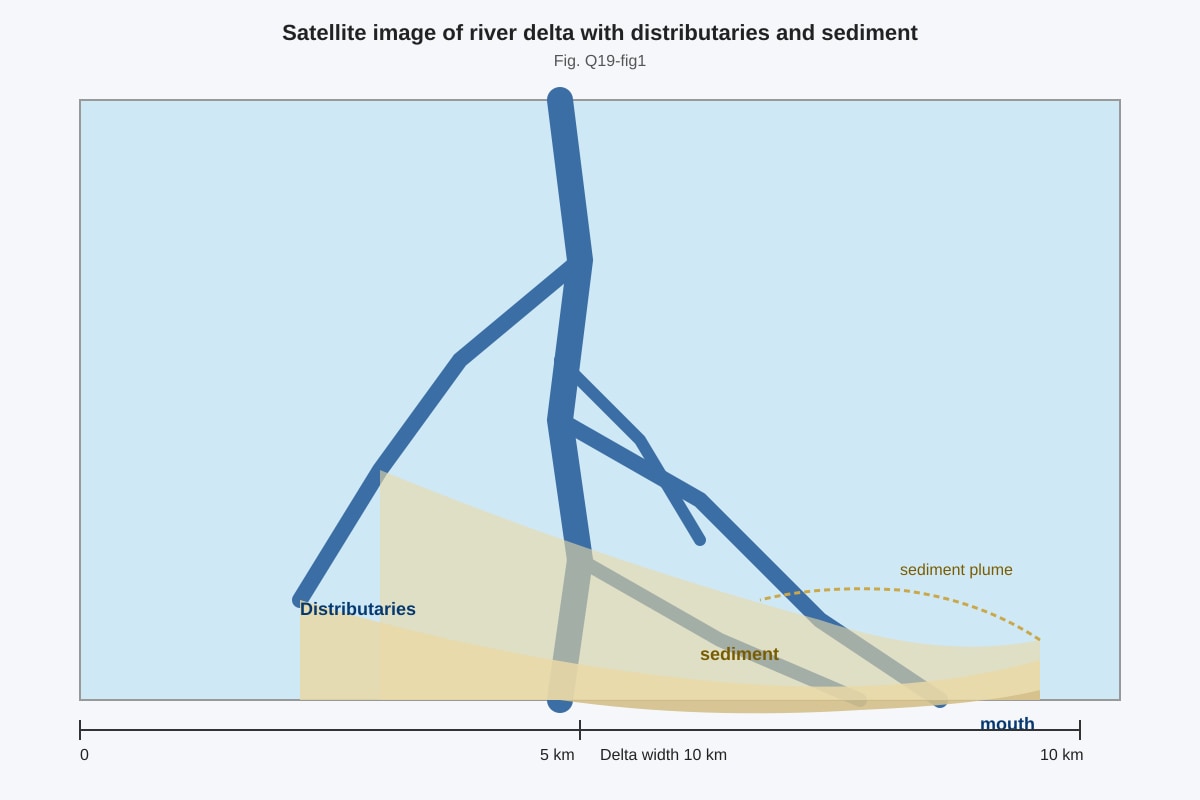
19. Fig. Q19-fig1 is a photograph of a river delta.
Image pending generation: source_image for Q19.
With reference to Fig. Q19-fig1, describe two features of the delta formed by deposition. [3]
20. The data below shows waste recycled (tonnes) in Town M: 2018=50, 2019=70, 2020=90, 2021=110.
Explain whether the town is meeting a target of increasing recycling by 15 tonnes per year. Use data to support. [4]
Answers
Answer Key: TuitionGoWhere Practice Paper - Geography Secondary 4 (PRELIM) Version 3
Total Marks: 60
Section A: Data Interpretation and Graph Construction
1. [3 marks]
- Calculate angles: Total = 120+80+60+40 = 300.
- MRT: (120/300)×360° = 144°
- Bus: (80/300)×360° = 96°
- Car: (60/300)×360° = 72°
- Cycling: (40/300)×360° = 48°
- Plot accurately with protractor (1 mark)
- Add title "Mode of Transport to Nature Reserve" and legend (1 mark)
- Correct angles (1 mark) Teaching note: Pie chart angles always sum to 360°. Divide each value by total then multiply by 360°.
2. [3 marks]
- Draw circles: Asia largest (55%), Europe 20%, Americas 15%, Africa 10% (1 mark for correct relative sizes)
- Place on correct regions on map (1 mark)
- Complete legend with percentages (1 mark) Common mistake: Using absolute numbers instead of %.
3. [2 marks]
- Temperature increases steadily from 26°C at 0800 to 33°C at 1200 (1 mark)
- Rise of 7°C over 4 hours, warming trend (1 mark)
4. [3 marks]
- Sum = 120+90+60+40+30+50 = 390 mm (1 mark)
- Mean = 390 ÷ 6 = 65 mm (1 mark for division, 1 mark for answer with unit)
- Answer: 65 mm
5. [2 marks]
- Residential (40%) and Industrial (25%) (1 mark each) Note: Two largest sectors by percentage.
6. [3 marks]
- Bar graph with Town A 5000, B 3000, C 8000 (1 mark data)
- Title "Population Density of Towns" (1 mark)
- Axis labels (x: Town, y: Density people/km²) (1 mark)
7. [2 marks]
- 2022 (from 60k to 120k = +60k) vs 2023 (+30k), 2021 (+20k) (1 mark identify 2022, 1 mark reason)
- Answer: 2022
Section B: Map and Photograph Analysis
8. [5 marks]
- Identify landform: sea stack and arch (1 mark)
- Features: stack ~15m high separated from cliff, arch 8m wide, wave cut platform (2 marks)
- Formation: hydraulic action and abrasion eroded cliff, arch formed then collapsed leaving stack (2 marks) Marking: Description 2, process 2, identification 1.
9. [4 marks]
- Core zone restricts access preserving forest (1)
- Buffer zone reduces edge effects (1)
- Visitor centre concentrates impact (1)
- Trails limit trampling (1) Link to map features required.
10. [3 marks]
- Destructive waves (1)
- High steep waves 2m (1)
- Backwash > swash, frequent (1)
11. [1 mark]
- North (dark shading = highest density)
12. [2 marks]
- Steep slope (1) because contours close together (1)
13. [1 mark]
- R (20 km, largest distance = largest circle; smallest is P at 5 km) → P
14. [3 marks]
- Land uses: residential, industrial (1 each)
- Sustainable: park provides green space (1)
Section C: Data Skills and Synthesis
15. [3 marks]
- Total 200
- Questionnaire: (90/200)×100 = 45% (1)
- Observation: (60/200)×100 = 30% (1)
- Mapping: (50/200)×100 = 25% (1)
16. [3 marks]
- Both increase over time (1)
- CO₂ 370→410 ppm, temp 0.2→0.6°C (1)
- Positive relationship (1)
17. [3 marks]
- Plot points 2000(1000), 2010(800), 2020(600) (1)
- Title "Forest Area Decline" (1)
- Labels (1)
18. [2 marks]
- Medium flood risk may damage school (1), evacuation needed (1)
19. [3 marks]
- Distributaries split channel (1)
- Sediment plume at mouth (1)
- Deposition builds land (1)
20. [4 marks]
- Target: +15 each year from 50 → 65, 80, 95, 110 (2 marks calculation)
- Actual: 70, 90, 110 → meets 2021 but not exact earlier (1)
- Conclusion with data (1)
Free quiz and exam paper access
Enter your details to view this paper
Your access is remembered on this device.