From Real Exams Exam Paper
Secondary 4 Geography Preliminary Examination Paper 2
Free Sec 4 Geography Prelim Paper 2, HY3 Exam version, with questions, answers, and O Level-style practice for Singapore students.
These static practice materials are generated from the site's syllabus and paper-generation workflow, with source and model context shown so students and parents can evaluate the material before use.
Questions
TuitionGoWhere Exam Practice (AI) — Preliminary Practice Paper
Geography Secondary 4 — Map Graph Data Skills (Version 2 of 5)
School: TuitionGoWhere Secondary School (AI)
Subject: Geography
Level: Secondary 4
Paper: Prelim Practice (Map Graph Data Skills)
Version: 2
Duration: 60 minutes
Total Marks: 60
Name: ______________________
Class: ________
Date: ____________
Instructions:
- Answer all questions in the spaces provided.
- Use the data, maps, graphs, and photographs provided to support your answers.
- For drawing tasks, use a ruler and protractor where needed.
- Marks for each question are shown in brackets [ ].
Section A: Data Interpretation and Graph Construction (Questions 1–8) [24 marks]
1. Table 1 shows the mode of transport used by visitors to a nature reserve in Singapore. Plot a pie chart to represent the data. [3]
| Mode of Transport | Number of Visitors |
|---|---|
| MRT | 120 |
| Bus | 80 |
| Car | 60 |
| Cycling | 40 |
Total = 300
Space for pie chart:
2. Study the data in Table 2 showing monthly rainfall (mm) in Singapore for Jan–Jun.
| Month | Rainfall (mm) |
|---|---|
| Jan | 240 |
| Feb | 160 |
| Mar | 190 |
| Apr | 210 |
| May | 180 |
| Jun | 150 |
Calculate the mean monthly rainfall for the first half of the year. [2]
Answer: __________ mm
3. Using the same data in Table 2, describe the trend of rainfall from January to June. [2]
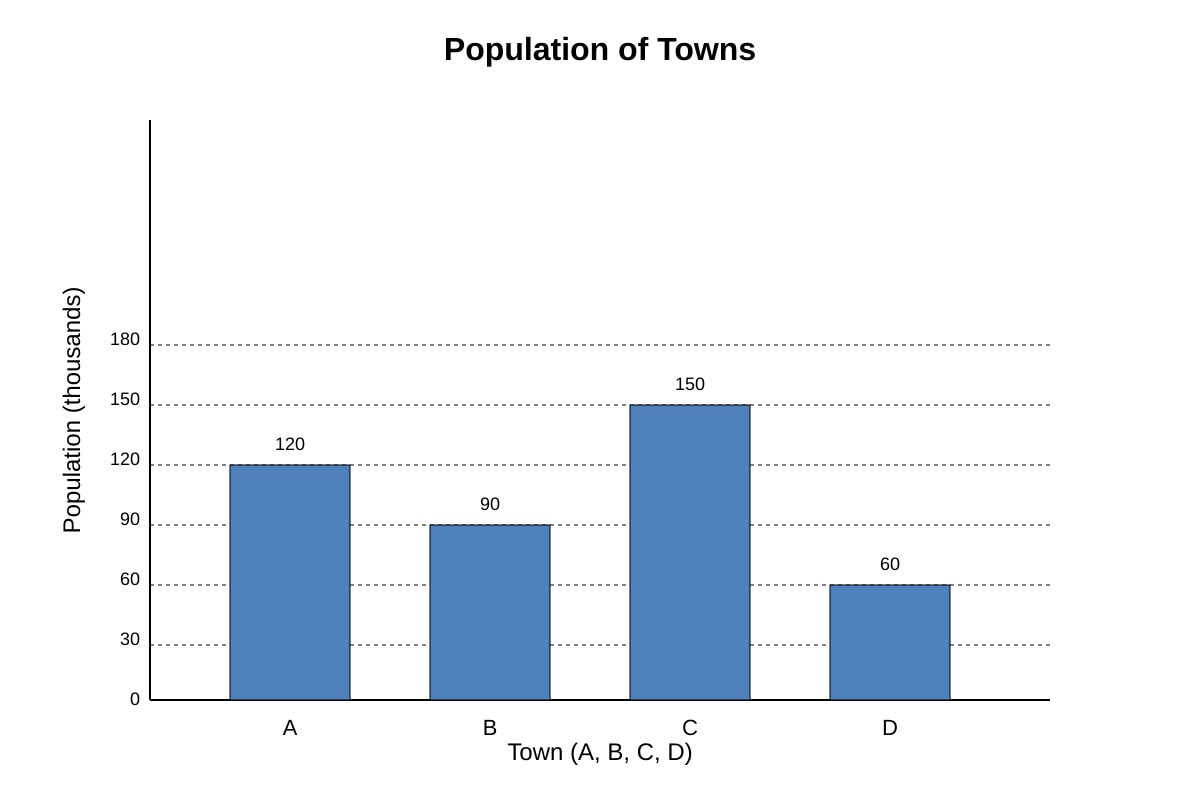
4. Figure 1 below is a bar chart showing the population of four towns A, B, C, D.
Image pending generation: graph for Q4.
Which town has the largest population? [1]
Answer: __________
5. With reference to Figure 1, calculate the difference in population between Town C and Town D. [2]
Answer: __________ thousand
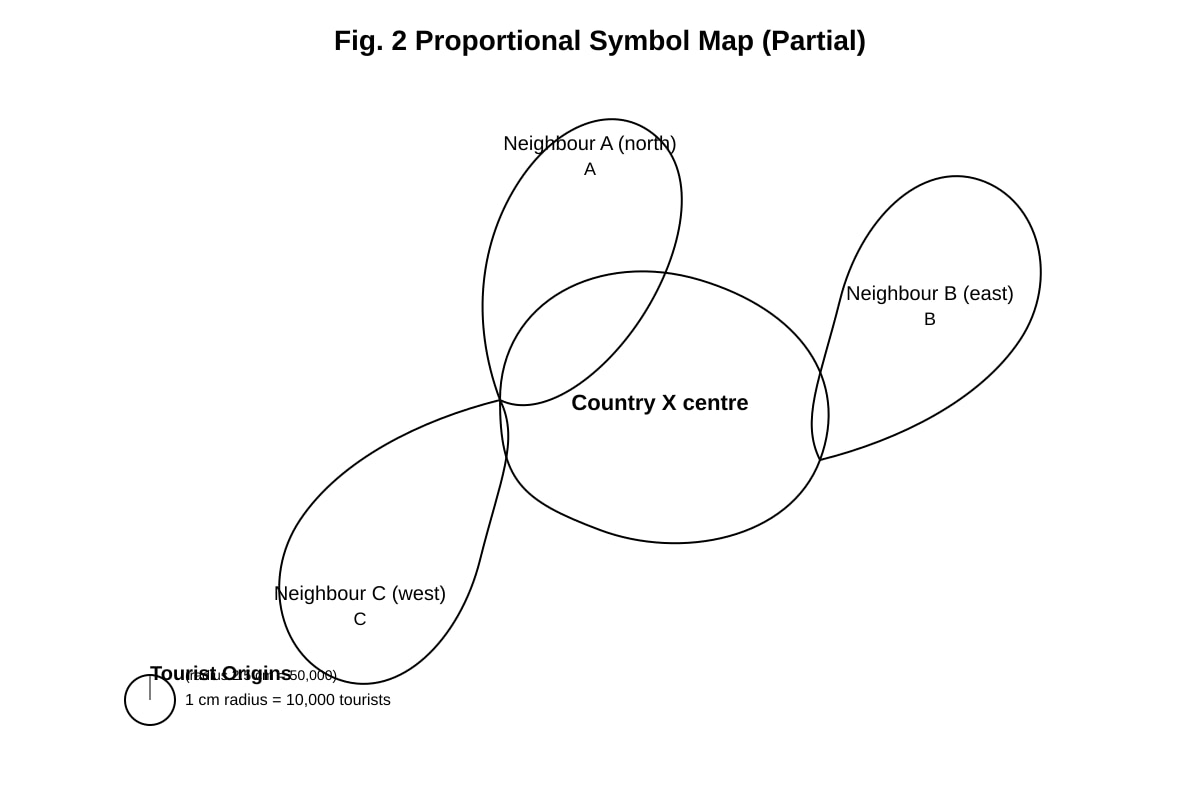
6. Table 3 shows the origin of tourists to Country X. Fig. 2 is a partially completed proportional symbol map. Use Table 3 to complete Fig. 2 by drawing the correct circle sizes. [3]
| Country of Origin | Number of Tourists (000) |
|---|---|
| Neighbour A | 50 |
| Neighbour B | 30 |
| Neighbour C | 20 |
Image pending generation: map for Q6.
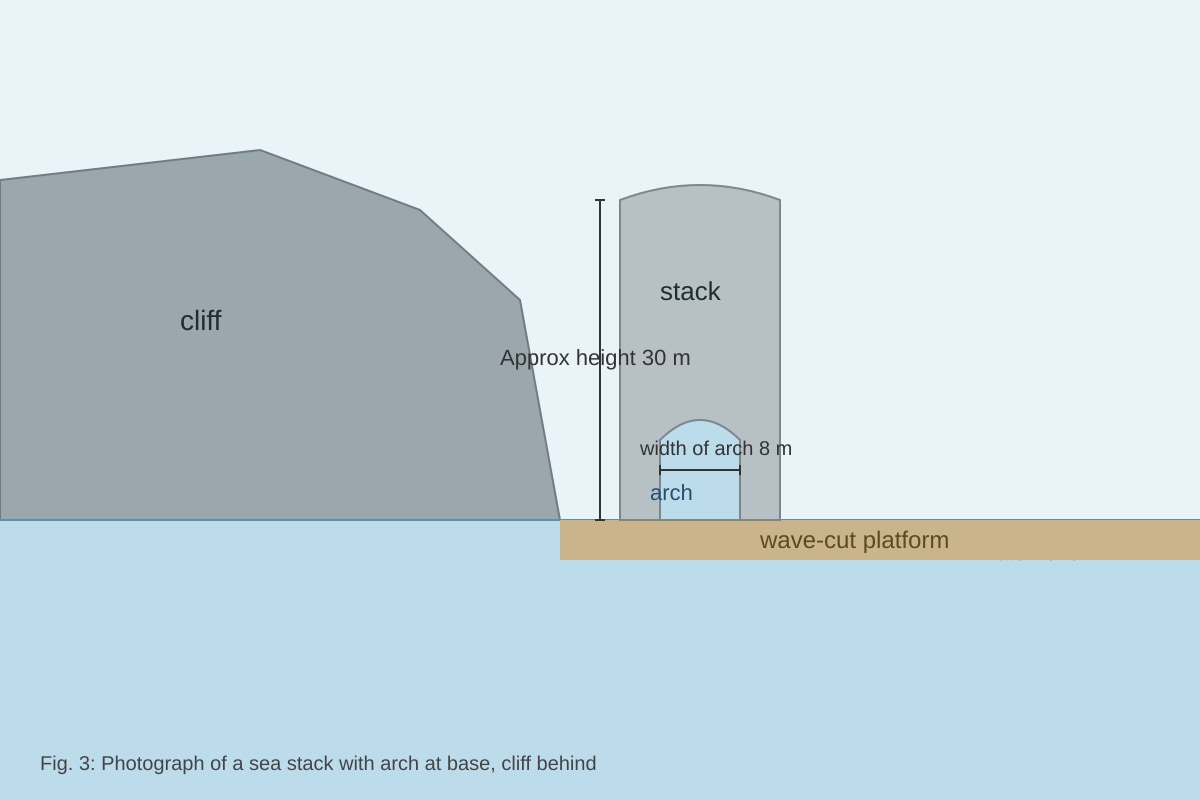
7. Study Photograph A (Fig. 3) showing a coastal landform.
Image pending generation: source_image for Q7.
Identify the coastal landform shown. [1]
Answer: __________
8. With reference to Photograph A, describe two features of the landform. [2]
Section B: Map and Photograph Analysis (Questions 9–14) [18 marks]
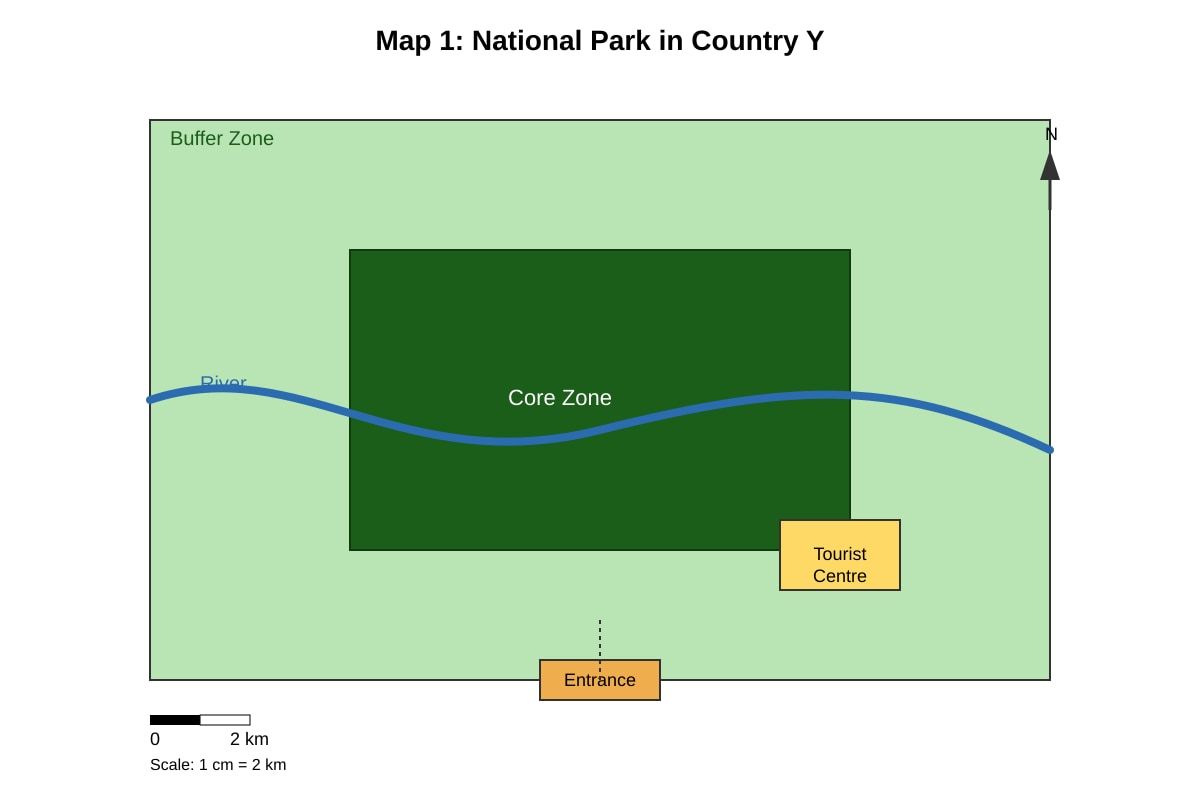
9. Study Map 1 (Fig. 4) showing a national park in Country Y with zoning.
Image pending generation: map for Q9.
With reference to Map 1, explain how zoning helps conserve the ecosystem. [3]
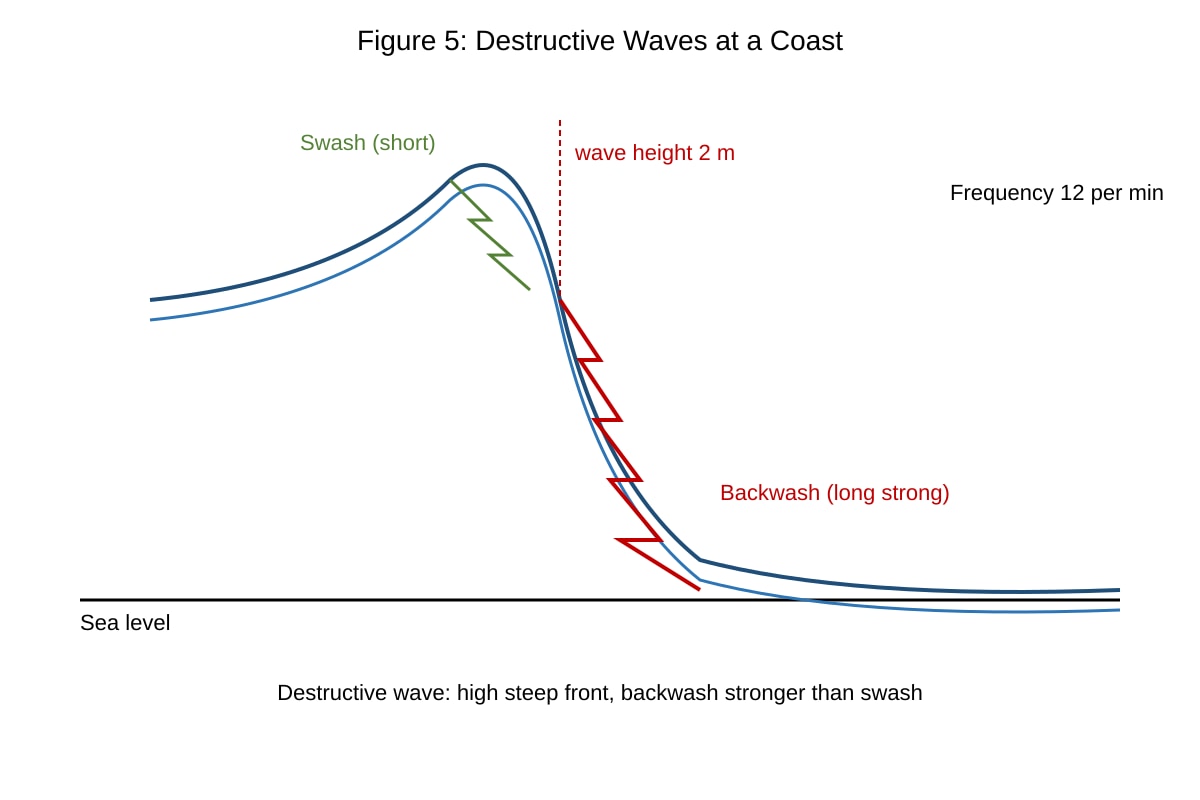
10. Figure 5 shows wave characteristics at a coast.
Image pending generation: diagram for Q10.
Describe the type of waves shown and give two characteristics. [3]
11. Table 4 shows land use in a Singapore town. Construct a divided bar graph using the data. [3]
| Land Use | % |
|---|---|
| Residential | 45 |
| Commercial | 25 |
| Green Space | 20 |
| Industrial | 10 |
Space for graph:
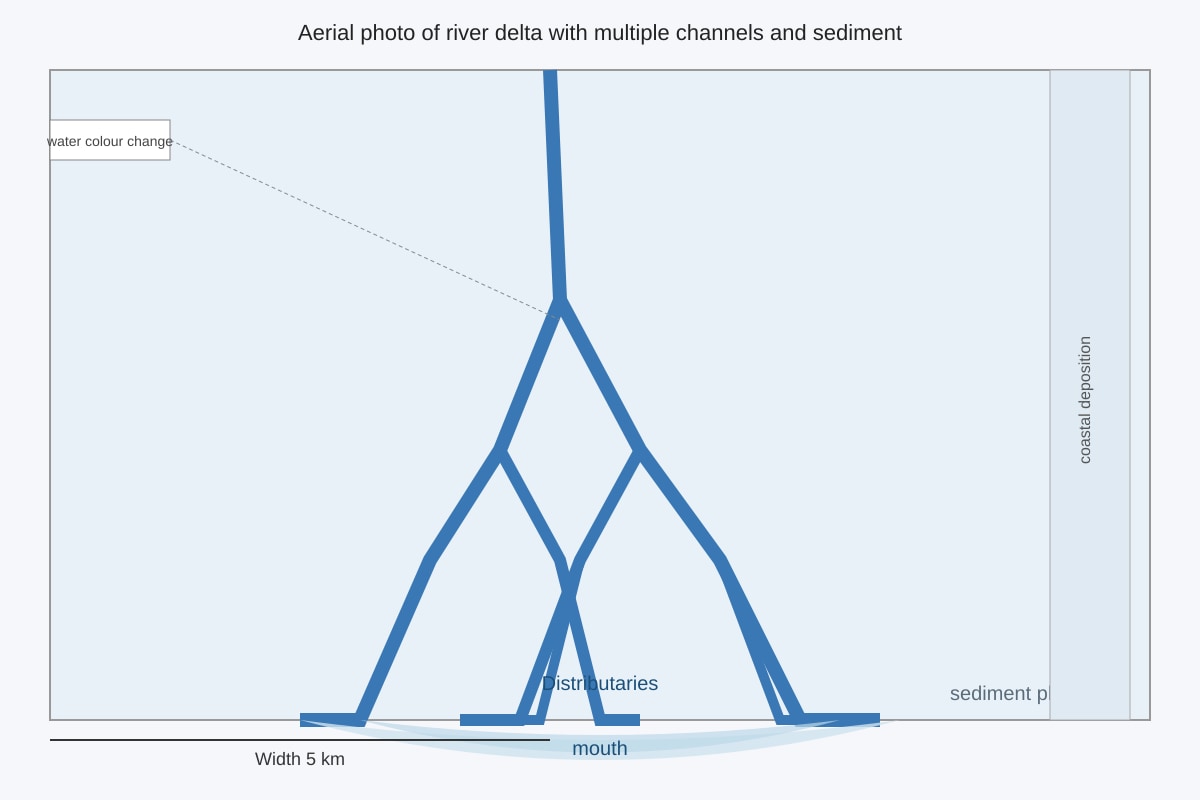
12. Study Photograph B (Fig. 6) of a river delta.
Image pending generation: source_image for Q12.
Describe the pattern of the river channels. [2]
13. Using Map 1 (Fig. 4), suggest one reason why the Tourist Centre is located at the buffer zone edge. [2]
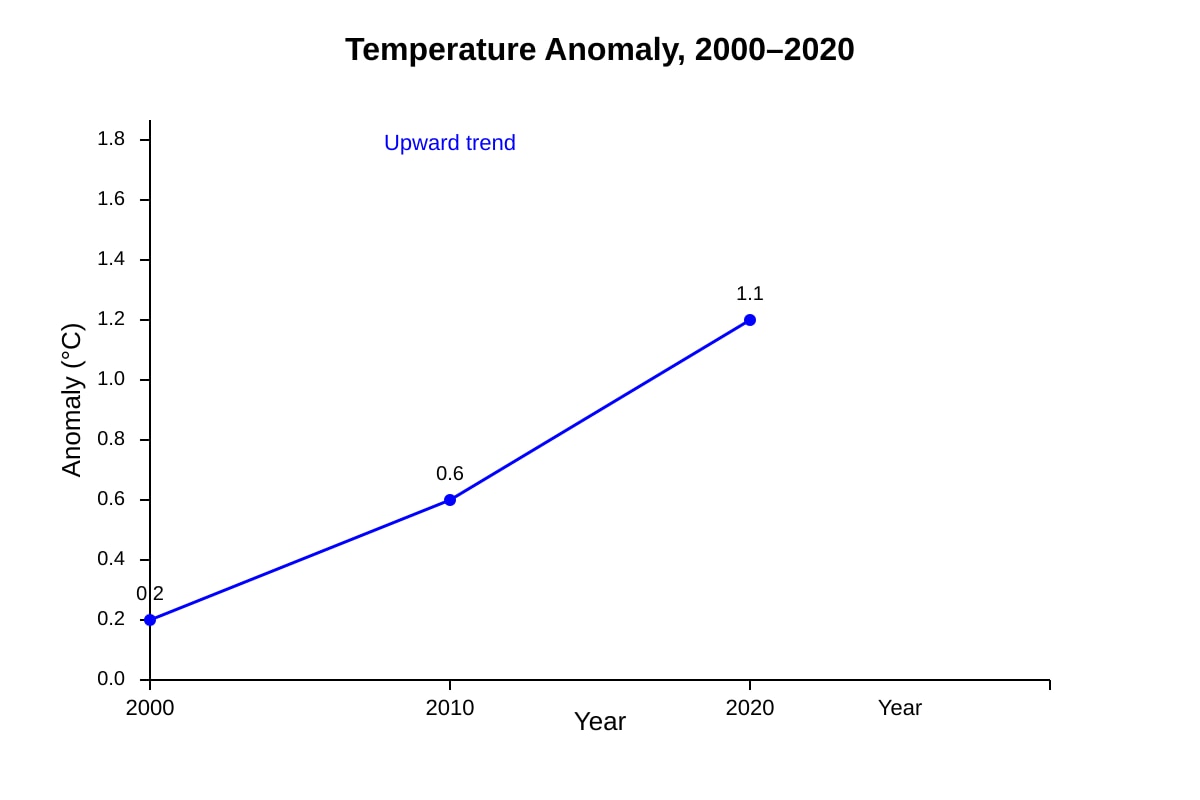
14. Figure 7 is a line graph of temperature anomaly 2000–2020.
Image pending generation: graph for Q14.
State the overall trend shown. [2]
Section C: Integrated Data Skills (Questions 15–20) [18 marks]
15. Table 5 gives earthquake magnitudes and affected districts. Draw a scatter plot of magnitude (x) vs number of districts (y). [3]
| Magnitude | Districts Affected |
|---|---|
| 5.0 | 2 |
| 6.0 | 4 |
| 7.0 | 7 |
| 8.0 | 9 |
Space for plot:
16. From your scatter plot in Q15, describe the relationship. [2]
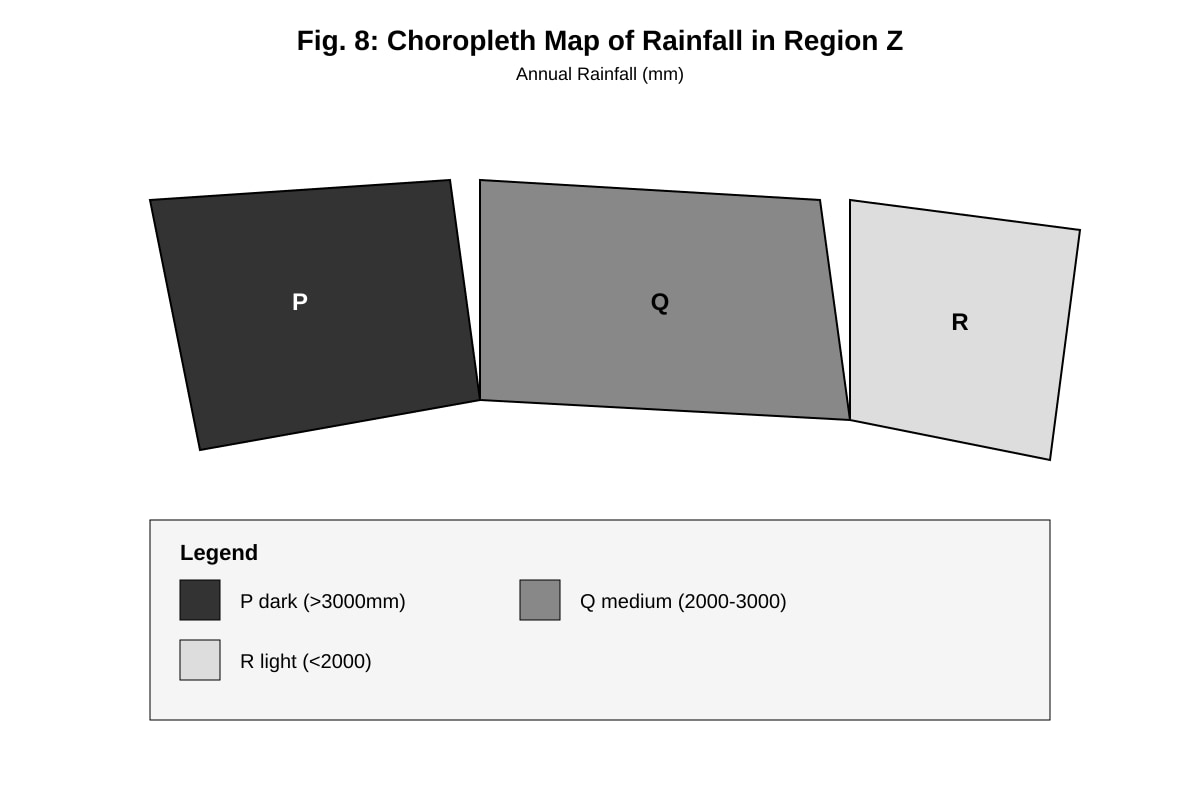
17. Study Fig. 8, a choropleth map of rainfall in Region Z.
Image pending generation: map for Q17.
Which area receives the highest rainfall? [1]
Answer: __________
18. Using Fig. 8, explain one limitation of choropleth maps for showing exact data. [2]
19. Table 6 shows forest cover loss. Calculate the percentage loss from 2000 to 2020. [2]
| Year | Forest Cover (%) |
|---|---|
| 2000 | 80 |
| 2020 | 56 |
Answer: __________ %
20. Using all previous data skills, outline two ways a geographer presents fieldwork findings clearly. [3]
Answers
Answer Key — TuitionGoWhere Exam Practice (AI) Prelim Practice Geography Sec 4 (Version 2)
Map Graph Data Skills
Total Marks: 60
Section A
1. [3] Pie chart angles: MRT (120/300×360)=144°, Bus (80/300×360)=96°, Car (60/300×360)=72°, Cycling (40/300×360)=48°.
Marks: 1 for correct angles, 1 for accurate plotting, 1 for title+legend.
Teaching: A pie chart shows proportions of a whole. Total 360° split by category share.
2. [2] Mean = (240+160+190+210+180+150)/6 = 1130/6 = 188.3 mm.
Marks: 1 formula, 1 answer.
Teaching: Mean = sum ÷ count.
3. [2] Rainfall generally decreases from Jan (240) to Jun (150) with small fluctuations (Mar rise).
Marks: 1 trend, 1 reference to values.
4. [1] Town C.
Mark: correct identification.
5. [2] 150 – 60 = 90 thousand.
Marks: 1 subtraction, 1 unit.
6. [3] Draw circles: A radius 2.5 cm, B 1.5 cm, C 1.0 cm (scale 1 cm=10k).
Marks: 1 each correct symbol.
Teaching: Proportional symbols sized by data value.
7. [1] Sea stack (with arch).
Mark: landform name.
8. [2] Features: isolated rock column ~30 m high; arch at base 8 m wide.
Marks: 1 each described with evidence.
Section B
9. [3] Core zone restricts access preserving wildlife; buffer allows limited use; tourist centre reduces pressure on core.
Marks: 1 per explained zone link.
10. [3] Destructive waves; high steep (2 m), backwash stronger, freq 12/min.
Marks: 1 type, 2 chars.
11. [3] Divided bar: total length split 45/25/20/10%.
Marks: 1 segments, 1 proportion, 1 label.
12. [2] Channels branch into distributaries; sediment at mouth.
Marks: 1 each.
13. [2] At edge limits intrusion into core; near entrance for access.
Marks: 1 each.
14. [2] Rising trend 0.2 to 1.1 °C.
Marks: 1 direction, 1 values.
Section C
15. [3] Plot points (5,2)(6,4)(7,7)(8,9).
Marks: 1 axes, 1 points, 1 scale.
16. [2] Positive correlation: higher magnitude → more districts.
Marks: 1 direction, 1 link.
17. [1] Area P.
Mark: correct.
18. [2] Choropleth shows ranges not exact; hides variation within area.
Marks: 1 limitation, 1 explain.
19. [2] Loss = (80-56)/80×100 = 30%.
Marks: 1 method, 1 answer.
20. [3] Use maps for spatial; graphs for trends; clear titles/legends.
Marks: 1 each way.
Free quiz and exam paper access
Enter your details to view this paper
Your access is remembered on this device.