From Real Exams Exam Paper
Secondary 4 Geography Preliminary Examination Paper 1
Free Sec 4 Geography Prelim Paper 1, HY3 Exam version, with questions, answers, and O Level-style practice for Singapore students.
These static practice materials are generated from the site's syllabus and paper-generation workflow, with source and model context shown so students and parents can evaluate the material before use.
Questions
TuitionGoWhere Exam Practice (AI) — Preliminary Practice Paper
Geography Secondary 4 — Map Graph Data Skills (Version 1 of 5)
School: TuitionGoWhere Secondary School (AI)
Subject: Geography
Level: Secondary 4
Paper: Preliminary Practice Paper (Map Graph Data Skills)
Duration: 60 minutes
Total Marks: 60
Name: ___________________________
Class: ________
Date: ____________
Instructions:
- Answer all questions in the spaces provided.
- Use the data, maps, graphs, and photographs provided to support your answers with evidence.
- For drawing tasks, use a ruler and protractor where needed.
- Section marks are shown at the end of each section. Question marks add up to the Total Marks.
Section A: Data Interpretation and Graph Construction (Questions 1–8) [24 marks]
1. The table below shows the mode of transport used by visitors to a nature reserve in Singapore.
| Mode of Transport | Number of Visitors |
|---|---|
| MRT + Bus | 120 |
| Car | 80 |
| Cycling | 40 |
| Walking | 60 |
Plot a pie chart to represent the data. [3]
2. Using the table in Q1, calculate the percentage of visitors who travelled by Car. Show your working. [2]
3. Study the table below showing average monthly rainfall (mm) in City X for one year.
| Month | Rainfall (mm) |
|---|---|
| Jan | 50 |
| Feb | 40 |
| Mar | 70 |
| Apr | 90 |
| May | 120 |
| Jun | 150 |
| Jul | 160 |
| Aug | 140 |
| Sep | 110 |
| Oct | 80 |
| Nov | 60 |
| Dec | 45 |
Describe the trend of rainfall from January to December. [2]
4. Using the rainfall data in Q3, calculate the mean monthly rainfall. Show your working. [2]
5. A student recorded the following temperature readings (°C) at a field study site: 29, 31, 30, 32, 28, 31, 30. Calculate the range of the temperature data. [1]
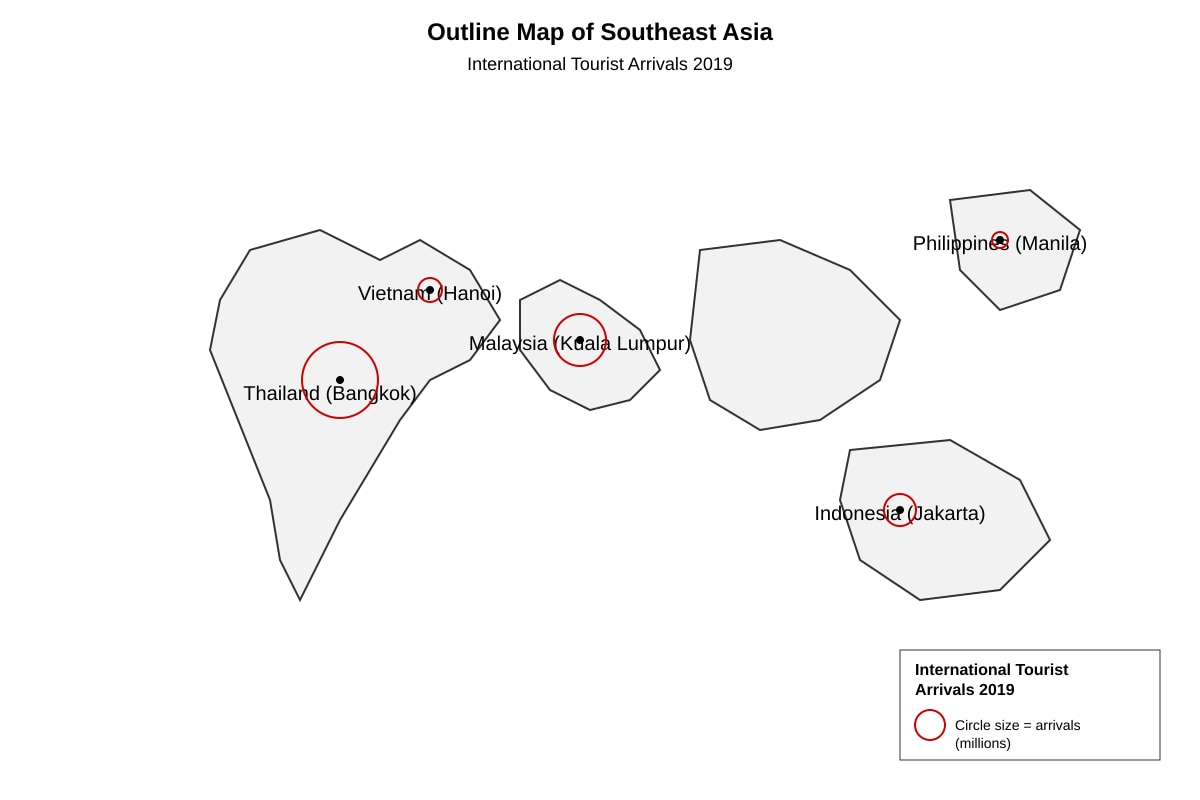
6.
Image pending generation: map for Q6.
Study the data below and complete the proportional symbol map in Fig. Q6-fig1.
| Country | International Tourist Arrivals (millions) |
|---|---|
| Thailand | 38 |
| Malaysia | 26 |
| Indonesia | 16 |
| Philippines | 8 |
| Vietnam | 12 |
Use a scale where 1 cm radius = 10 million arrivals. [3]
7. The bar graph below shows the number of earthquakes recorded per year in Region Y from 2015–2019: 12, 15, 9, 18, 14. State one advantage of using a bar graph instead of a pie chart for this data. [1]
8. A questionnaire asked 100 residents: "How often do you visit green spaces?" Results: Daily 30, Weekly 45, Monthly 15, Rarely 10. Construct a suitable chart title and label the axes for a bar graph of this data. [2]
Section B: Map and Photograph Analysis (Questions 9–14) [18 marks]
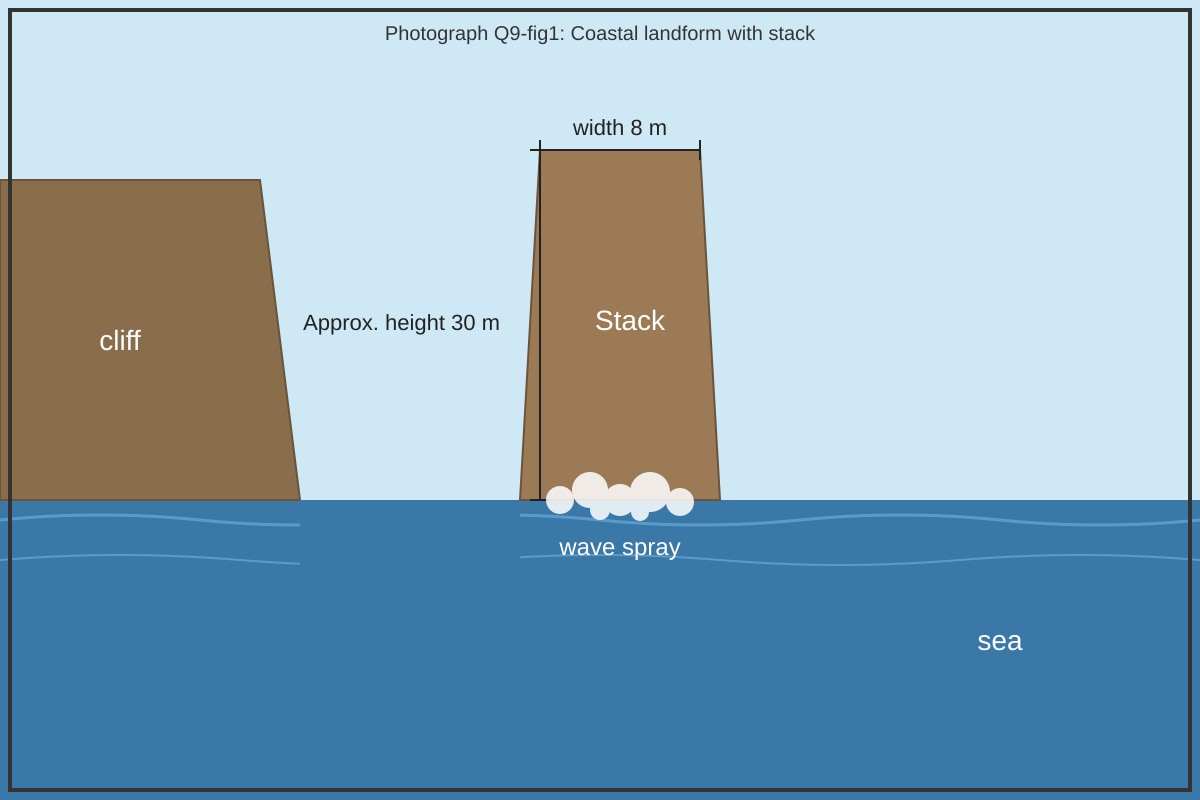
9.
Image pending generation: photograph for Q9.
Study Photograph Q9-fig1, which shows a coastal landform. Describe the features of the landform and account for its formation. [5]
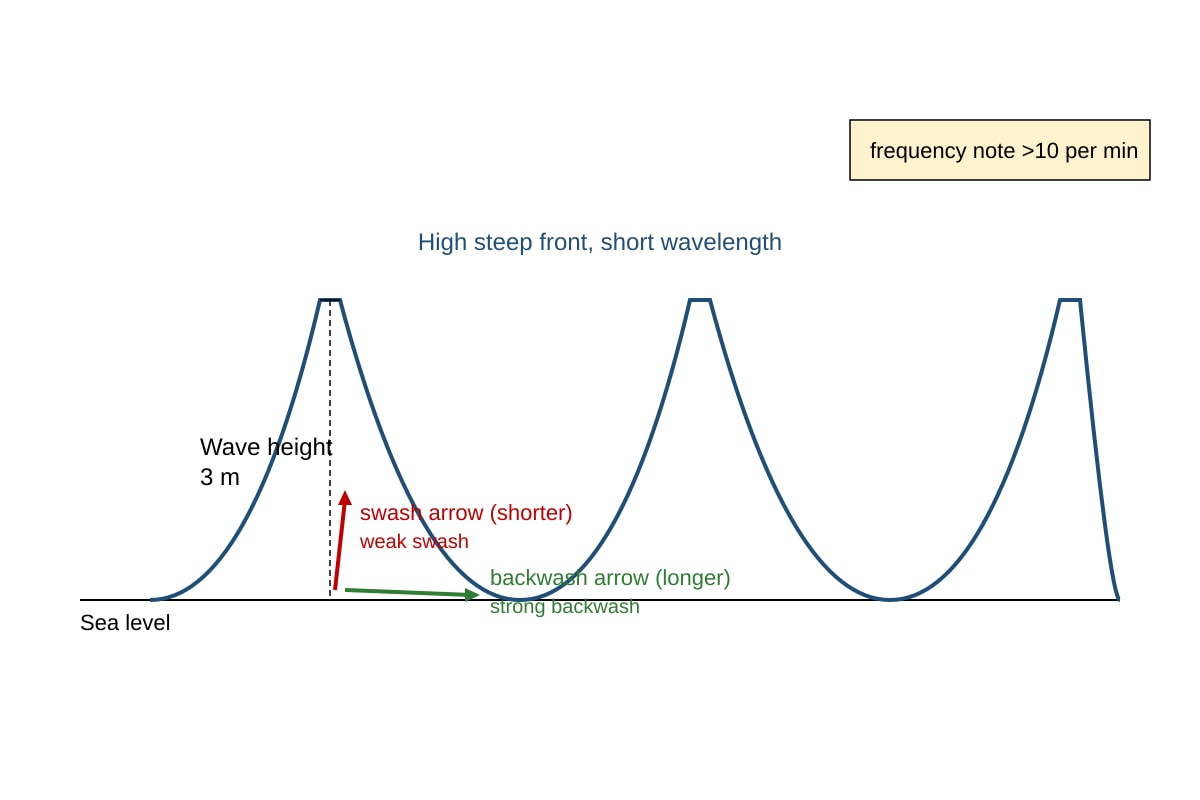
10.
Image pending generation: diagram for Q10.
Describe the type of waves associated with the signs seen in Figure Q10-fig1. [3]
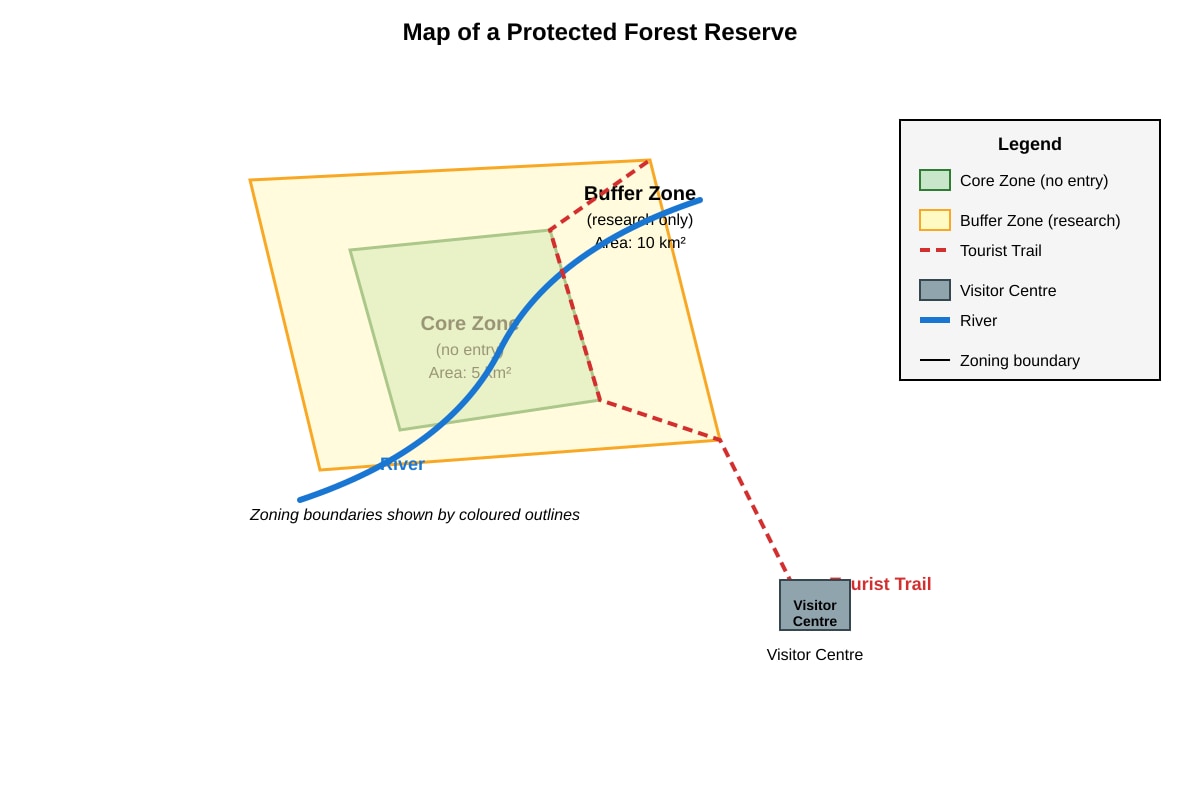
11.
Image pending generation: map for Q11.
Study Map Q11-fig1, which shows a protected forest reserve. With reference to the map, explain how zoning helps conserve the forest ecosystem. [4]
12. A choropleth map shows population density by district shaded from light to dark. District A is dark, District B is light. What does this indicate about the two districts? [1]
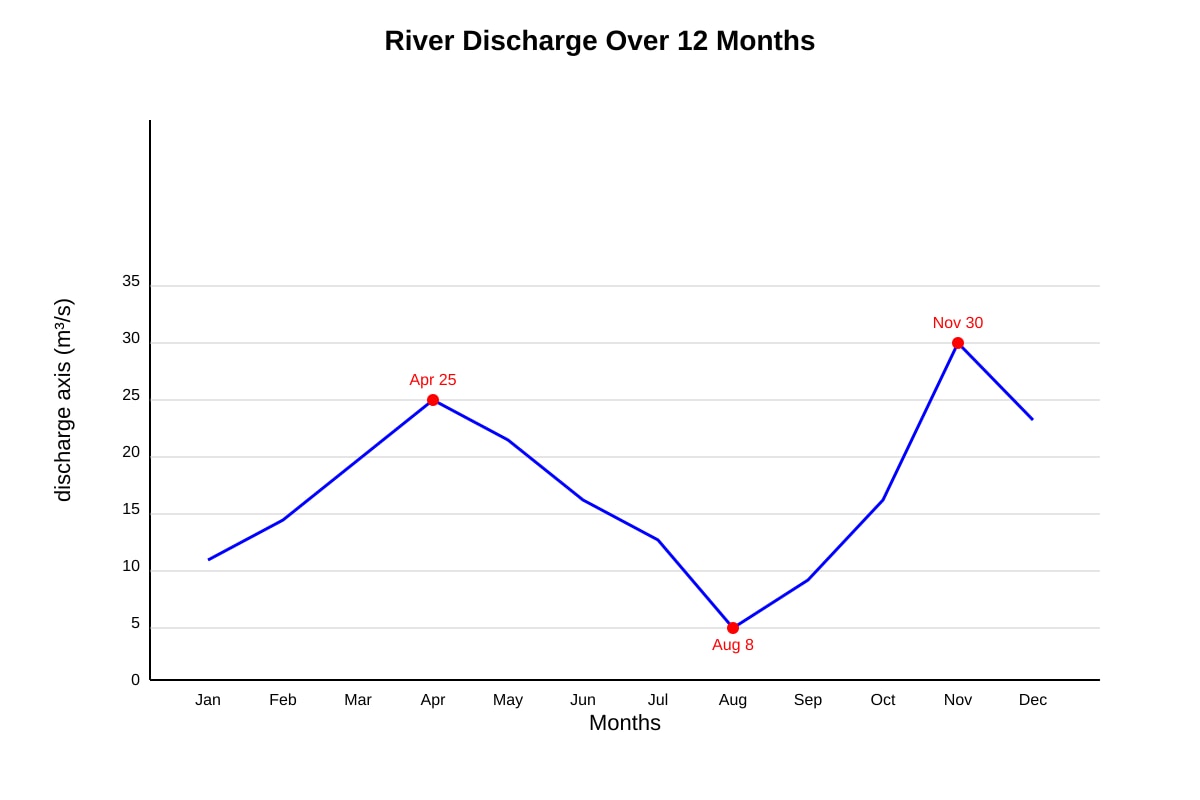
13.
Image pending generation: graph for Q13.
Study Figure Q13-fig1. State the months of peak river discharge and describe the pattern. [2]
14. Give one reason why a geographer would use a scatter graph to show relationship between temperature and rainfall. [1]
Section C: Integrated Data Skills (Questions 15–20) [18 marks]
15. Table below shows forest area (km²) and tourism revenue ($ million) for 4 countries.
| Country | Forest Area (km²) | Tourism Revenue ($m) |
|---|---|---|
| P | 50 | 100 |
| Q | 80 | 160 |
| R | 30 | 60 |
| S | 100 | 200 |
Plot a scatter graph with Forest Area on x-axis and Revenue on y-axis. [3]
16. Using the scatter graph from Q15, describe the relationship between forest area and tourism revenue. [2]
17. A field study uses stratified sampling to survey students in a school by level (Sec 1–4). Explain why stratified sampling is appropriate here. [2]
18. The table shows age groups of visitors to a museum: 0–15 (20), 16–30 (50), 31–45 (40), 46+ (30). Draw a bar graph and state the modal age group. [3]
19. Study the extract: "The bar chart showed that 70% of households recycled, but only 40% composted." Identify the data presentation method used and one limitation of the statement. [2]
20. A student's mental map of their neighbourhood shows the park as very large but it is actually small. Explain one reason for this distortion in mental maps. [1]
End of Paper — Total Marks: 60
Answers
TuitionGoWhere Exam Practice (AI) — Preliminary Practice Paper Answer Key
Geography Secondary 4 — Map Graph Data Skills (Version 1 of 5)
Total Marks: 60
Section A Answers (24 marks)
Q1 [3 marks]
- Calculate angles: Total = 120+80+40+60 = 300.
- MRT+Bus: (120/300)×360° = 144°
- Car: (80/300)×360° = 96°
- Cycling: (40/300)×360° = 48°
- Walking: (60/300)×360° = 72°
- Plot with protractor accurately (1 mark), title "Mode of Transport to Nature Reserve" (1 mark), legend (1 mark).
- Teaching: Pie charts show proportion of total; angle = (value/total)×360°.
Q2 [2 marks]
- Percentage = (80/300)×100 = 26.7% (2 marks: 1 for 80/300, 1 for ×100 and answer).
- Common mistake: using wrong total.
Q3 [2 marks]
- Rainfall increases from Jan (50mm) to Jul (160mm), then decreases to Dec (45mm). (2 marks: 1 for increase to mid-year, 1 for decrease after)
- Teaching: Describe trend by direction and approximate peak/trough.
Q4 [2 marks]
- Sum = 50+40+70+90+120+150+160+140+110+80+60+45 = 1115 mm.
- Mean = 1115 ÷ 12 = 92.9 mm (2 marks: 1 sum, 1 division/answer).
- Teaching: Mean = total ÷ number of months.
Q5 [1 mark]
- Range = 32 − 28 = 4°C (1 mark).
- Teaching: Range = max − min.
Q6 [3 marks]
- Radius: Thailand 3.8 cm, Malaysia 2.6 cm, Indonesia 1.6 cm, Philippines 0.8 cm, Vietnam 1.2 cm (1 mark correct radii).
- Draw circles at capitals (1 mark), legend (1 mark).
- Teaching: Proportional symbol size shows magnitude spatially.
Q7 [1 mark]
- Bar graph compares discrete quantities across years; pie chart shows parts of one whole (1 mark).
- Teaching: Use bar for change over time/categories.
Q8 [2 marks]
- Title: "Frequency of Green Space Visits by Residents" (1 mark).
- Axes: x = Visit Frequency (Daily, Weekly, Monthly, Rarely), y = Number of Residents (0–50) (1 mark).
Section B Answers (18 marks)
Q9 [5 marks]
- Landform: sea stack, isolated rock column ~30m high, 8m wide, separated from cliff by water (1 mark).
- Features: wave cut at base, steep sides (2 marks).
- Formation: hydraulic action + abrasion eroded headland, arch collapsed leaving stack (2 marks).
- Teaching: Stacks form from erosional wave processes on headlands.
Q10 [3 marks]
- Destructive waves (1 mark).
- Characteristics: high steep waves (3m), backwash stronger than swash, >10 per min (2 marks).
- Teaching: Destructive waves erode coast; backwash dominates.
Q11 [4 marks]
- Core zone no entry protects wildlife (1); buffer limits to research reduces disturbance (1); tourist trail concentrates visitors (1); visitor centre at edge minimises impact (1).
- Teaching: Zoning separates human use from conservation.
Q12 [1 mark]
- District A has higher population density than B (1 mark).
Q13 [2 marks]
- Peaks: April (25) and November (30) (1); bimodal pattern with low in Aug (1).
Q14 [1 mark]
- Shows correlation between two variables (1 mark).
Section C Answers (18 marks)
Q15 [3 marks]
- Plot points: (50,100),(80,160),(30,60),(100,200) (1); axes labelled (1); title (1).
- Teaching: Scatter shows relationship.
Q16 [2 marks]
- Positive correlation: more forest area linked to higher revenue (2 marks).
Q17 [2 marks]
- Ensures each level represented proportionally (1); reduces bias (1).
Q18 [3 marks]
- Bars for 4 groups (1); modal = 16–30 (50) (1); title/axes (1).
Q19 [2 marks]
- Bar chart (1); limitation: no sample size or location given (1).
Q20 [1 mark]
- Personal attachment/sense of place exaggerates familiar places (1).
Free quiz and exam paper access
Enter your details to view this paper
Your access is remembered on this device.