From Real Exams Exam Paper
Secondary 4 Geography Preliminary Examination Paper 1
Free Sec 4 Geography Prelim Paper 1, Exam version, with questions, answers, and O Level-style practice for Singapore students.
These static practice materials are generated from the site's syllabus and paper-generation workflow, with source and model context shown so students and parents can evaluate the material before use.
Questions
TuitionGoWhere Practice Paper - Geography Secondary 4
TuitionGoWhere Secondary School (AI)
Subject: Geography
Level: Secondary 4
Paper: Preliminary Examination Paper 1
Duration: 1 hour 45 minutes
Total Marks: 60 marks
Name: _________________ Class: _________________ Date: _________________
Instructions to Candidates
- This paper consists of THREE sections.
- Answer ALL questions in ALL sections.
- Write your answers in the spaces provided in this question paper.
- The use of calculators is allowed.
- All diagrams are not drawn to scale unless otherwise stated.
Section A: Map, Graph and Data Skills [25 marks]
Question 1
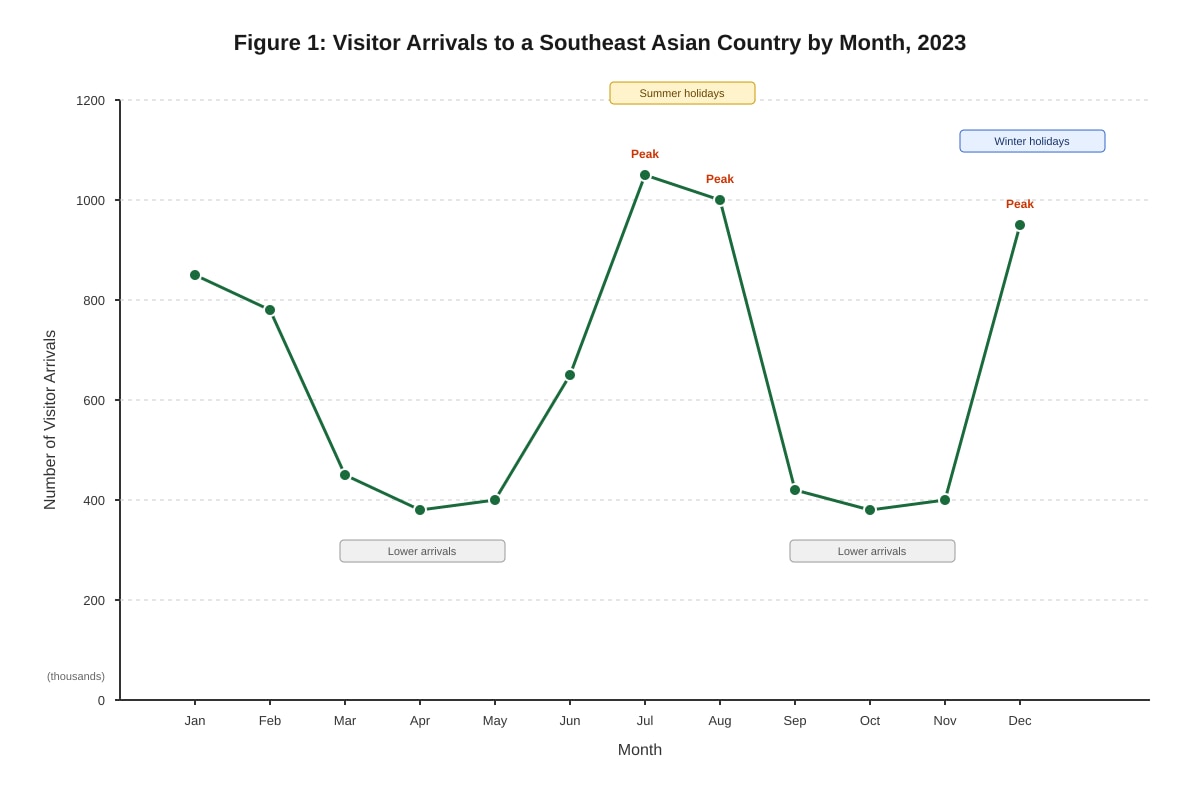
Study Figure 1, which shows visitor arrivals to a Southeast Asian country by month in 2023.
Generated figure for this question.
(a) Describe the pattern of visitor arrivals shown in Figure 1. [3]
(b) Suggest reasons for the pattern you described in (a). [4]
Question 2
Study Photograph A, which shows the impact of coastal erosion on a settlement.
[Photograph would show houses close to eroding cliff edge, with visible undercutting and fallen debris]
(a) With reference to Photograph A, describe the evidence of coastal erosion visible. [3]
(b) Explain how wave action causes the type of erosion shown in Photograph A. [4]
Question 3
Study Table 1, which shows data collected by students investigating beach characteristics at three locations.
| Location | Wave Type | Beach Material | Beach Slope | Backwash Strength |
|---|---|---|---|---|
| Site A | Destructive | Coarse pebbles | 15° | Strong |
| Site B | Constructive | Fine sand | 3° | Weak |
| Site C | Mixed | Medium sand | 8° | Moderate |
(a) State the relationship between wave type and backwash strength shown in Table 1. [2]
(b) Explain why Site A has the steepest beach slope. [3]
Question 4
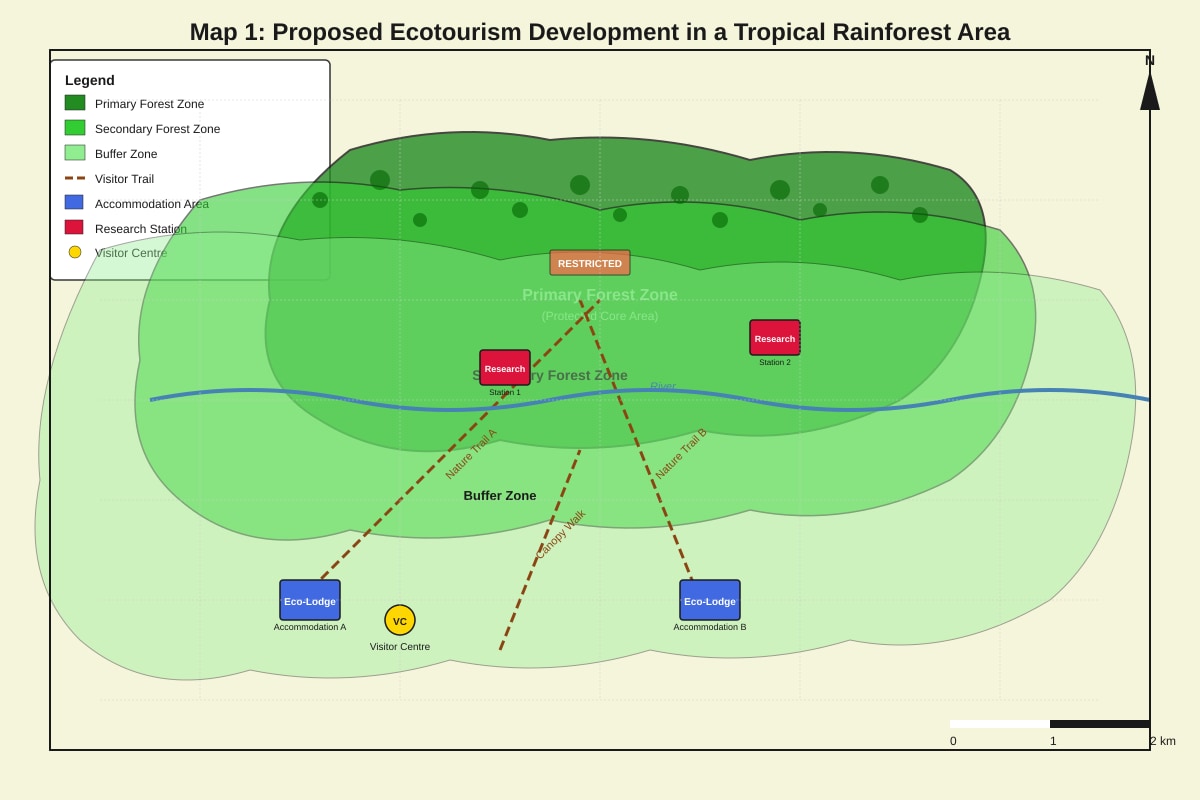
Study Map 1, which shows a proposed ecotourism development in a tropical rainforest area.
Generated map for this question.
(a) Identify two features from Map 1 that show this is designed as sustainable tourism. [2]
Feature 1: ________________________________________________________________
Feature 2: ________________________________________________________________
(b) With reference to Map 1, explain how this ecotourism development could help conserve the rainforest ecosystem. [4]
Section B: Physical Geography [20 marks]
Question 5
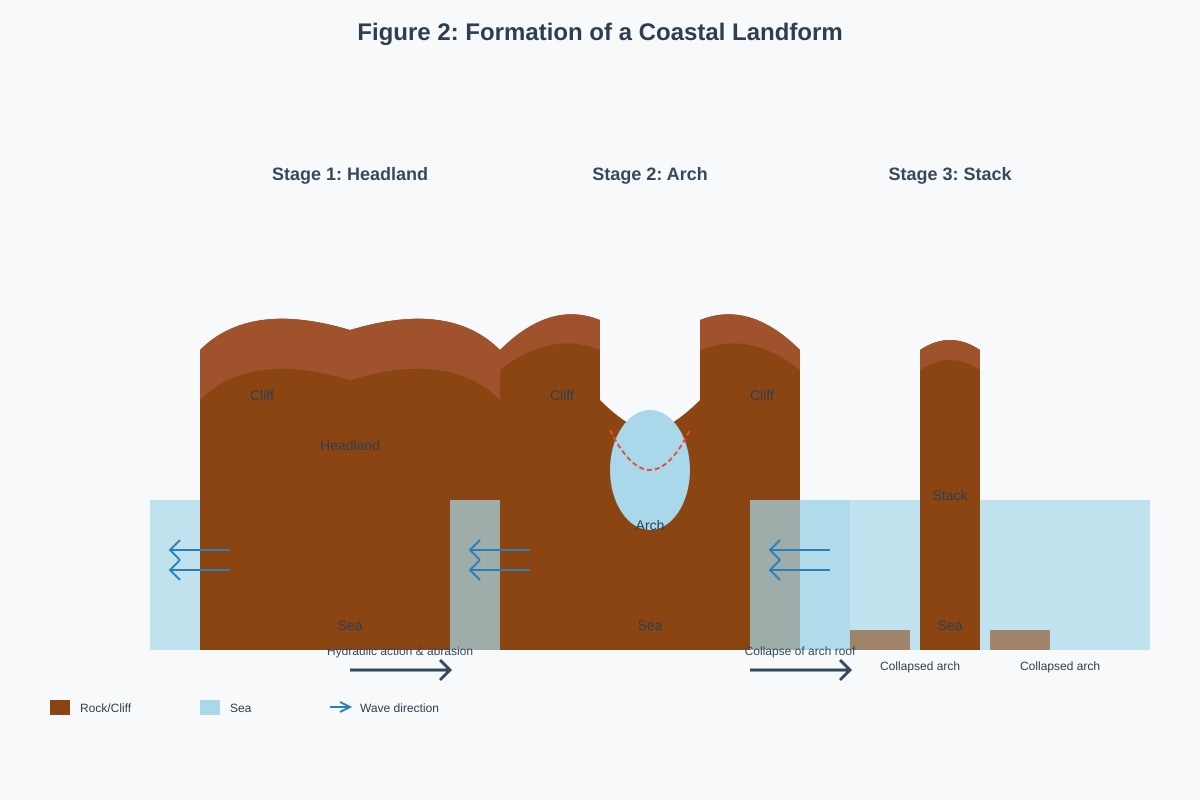
Study Figure 2, which shows the formation of a coastal landform.
Generated figure for this question.
(a) Name the landform shown in the final stage of Figure 2. [1]
(b) Describe the processes involved in the formation of this landform. [5]
(c) Explain why this type of landform is commonly found along rocky coastlines. [4]
Question 6
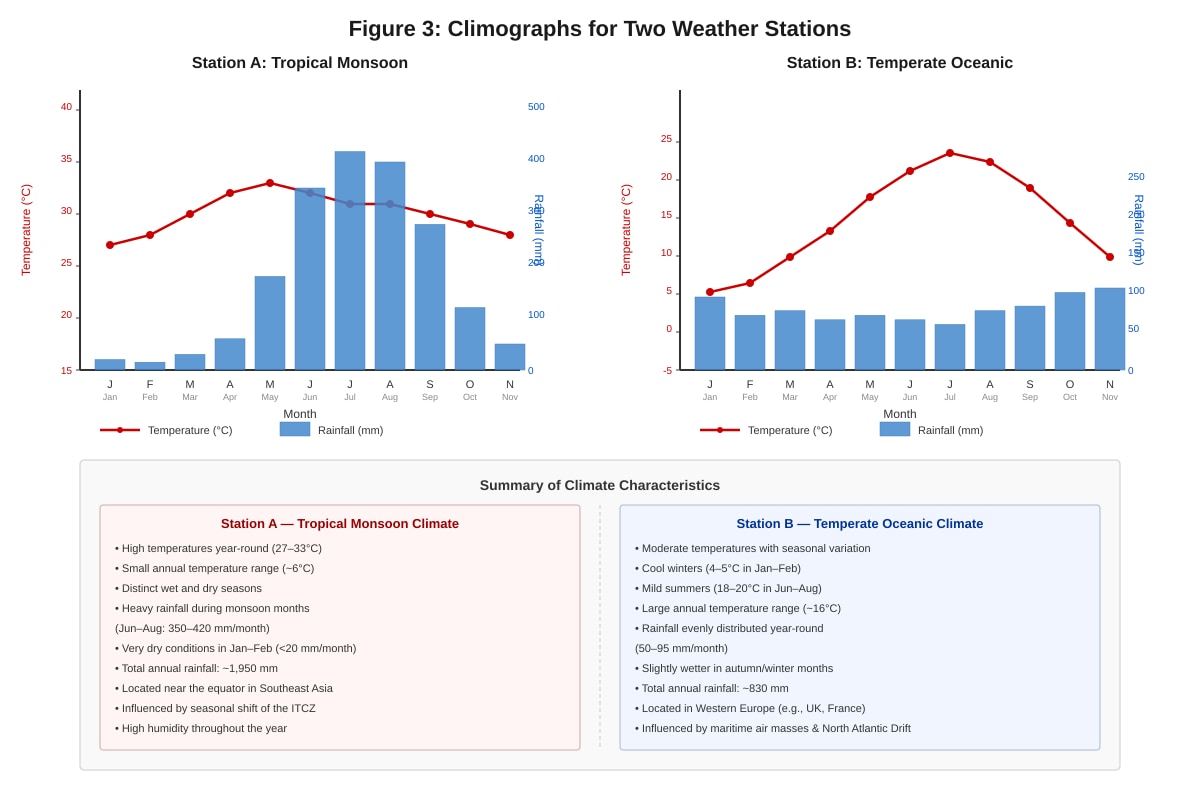
Study Figure 3, which shows temperature and rainfall data for two weather stations.
Generated figure for this question.
(a) Compare the climate characteristics of the two stations shown in Figure 3. [4]
(b) Account for the differences in rainfall patterns between the two stations. [6]
Section C: Human Geography and Sustainability [15 marks]
Question 7
Study Figure 4, which shows the relationship between tourism development and environmental quality over time.
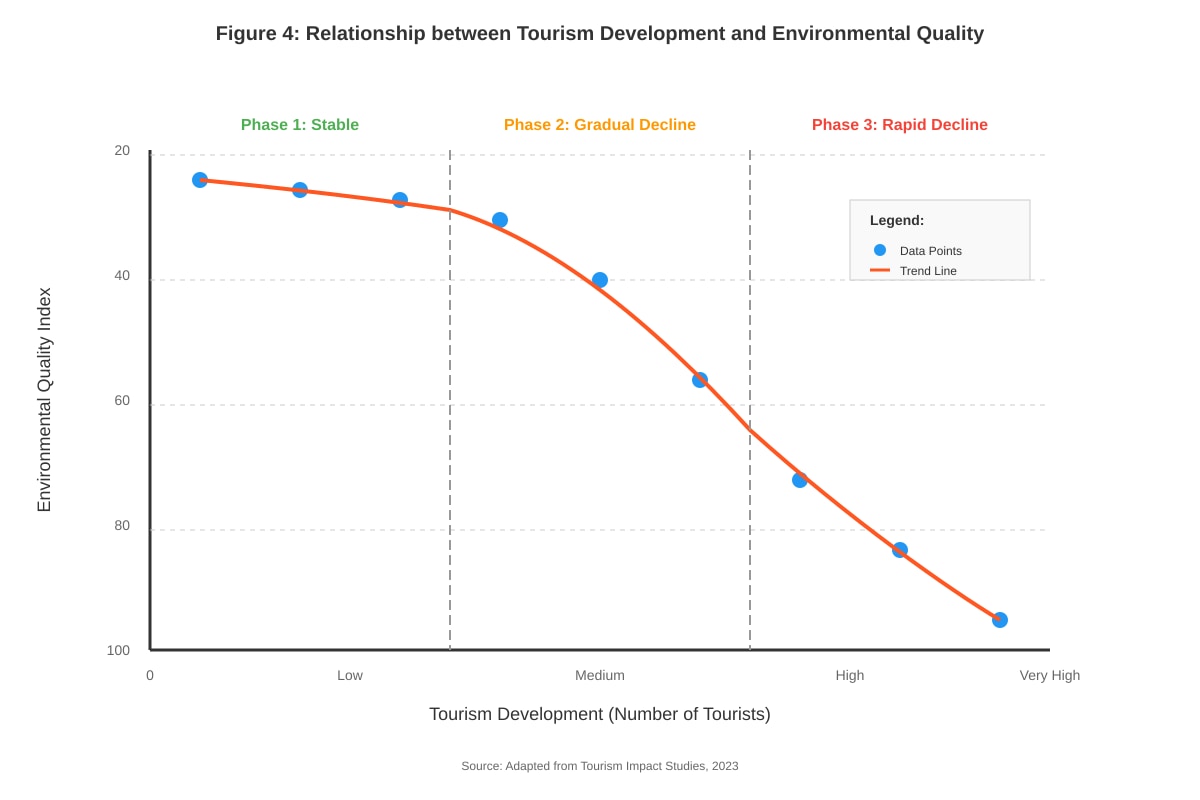
Generated figure for this question.
(a) Describe the relationship shown in Figure 4. [3]
(b) Explain why environmental quality changes as tourism development increases. [6]
(c) Suggest how sustainable tourism practices could modify the pattern shown in Figure 4. [6]
END OF PAPER
Answers
TuitionGoWhere Practice Paper - Geography Secondary 4 (Answer Key)
Section A: Map, Graph and Data Skills [25 marks]
Question 1
(a) Pattern description [3 marks]:
- Two distinct peaks in visitor arrivals: July-August and December (1 mark)
- Lowest arrivals occur in March-May and September-November (1 mark)
- Overall seasonal variation with approximately 40% difference between peak and trough months (1 mark)
(b) Reasons for pattern [4 marks]:
- July-August peak corresponds to Northern Hemisphere summer holidays when families travel (1 mark)
- December peak aligns with winter holidays and Christmas/New Year period (1 mark)
- March-May low period follows post-holiday season when people return to work/school (1 mark)
- September-November represents shoulder season before major holiday periods (1 mark)
Question 2
(a) Evidence of coastal erosion [3 marks]:
- Steep cliff face with visible undercutting at base (1 mark)
- Houses positioned dangerously close to cliff edge indicating land loss (1 mark)
- Fallen rocks and debris at cliff base showing recent collapse (1 mark)
(b) Wave action explanation [4 marks]:
- Hydraulic action: waves compress air in rock cracks, pressure release causes rock to fracture (1 mark)
- Abrasion: waves hurl rocks and sediment against cliff base, wearing away rock surface (1 mark)
- Undercutting: continuous wave attack creates notch at base, undermining cliff stability (1 mark)
- Eventual collapse: unsupported cliff face becomes unstable and falls due to gravity (1 mark)
Question 3
(a) Wave type and backwash relationship [2 marks]:
- Destructive waves have strong backwash (1 mark)
- Constructive waves have weak backwash (1 mark)
(b) Site A steep slope explanation [3 marks]:
- Coarse pebbles have poor packing ability creating steep angle of rest (1 mark)
- High friction between large particles prevents them from settling at low angles (1 mark)
- Strong backwash from destructive waves removes finer material, leaving coarser sediment that naturally forms steeper slopes (1 mark)
Question 4
(a) Sustainable tourism features [2 marks]:
- Feature 1: Buffer zones/restricted areas to protect sensitive ecosystems (1 mark)
- Feature 2: Research stations for monitoring environmental impact (1 mark)
- Alternative answers: visitor trails to control access, limited accommodation capacity, education centres
(b) Conservation explanation [4 marks]:
- Restricted zones prevent tourist access to most sensitive areas, allowing ecosystems to remain undisturbed (1 mark)
- Controlled visitor trails concentrate human impact in designated areas, minimizing habitat fragmentation (1 mark)
- Research stations enable continuous monitoring of biodiversity and environmental health (1 mark)
- Revenue from ecotourism provides economic incentive for local communities to protect rather than exploit forest resources (1 mark)
Section B: Physical Geography [20 marks]
Question 5
(a) Landform name [1 mark]:
- Stack (1 mark)
(b) Formation processes [5 marks]:
- Wave attack concentrates on headland due to wave refraction (1 mark)
- Hydraulic action and abrasion exploit weaknesses in rock such as joints and faults (1 mark)
- Cave formation occurs on both sides of headland through continued erosion (1 mark)
- Caves eventually meet to form an arch as erosion breaks through (1 mark)
- Continued erosion weakens arch roof until it collapses, leaving isolated stack (1 mark)
(c) Rocky coastline explanation [4 marks]:
- Rocky coastlines have resistant geology that can support vertical cliff structures (1 mark)
- Joints and bedding planes in rock provide lines of weakness for wave attack to exploit (1 mark)
- Hard rock erodes slowly, allowing distinctive landforms to persist rather than being quickly worn away (1 mark)
- Wave refraction around headlands concentrates erosive energy needed to create these features (1 mark)
Question 6
(a) Climate comparison [4 marks]:
- Station A shows higher temperatures year-round (tropical) vs Station B with seasonal temperature variation (temperate) (1 mark)
- Station A has distinct wet and dry seasons vs Station B with more evenly distributed rainfall (1 mark)
- Station A receives higher total annual rainfall concentrated in summer months (1 mark)
- Station B shows cooler temperatures in winter months with milder summers (1 mark)
(b) Rainfall pattern differences [6 marks]:
- Station A (Tropical monsoon): Seasonal rainfall caused by monsoon wind system (1 mark)
- Summer monsoon brings moist air from ocean causing heavy rainfall (1 mark)
- Winter monsoon brings dry air from continental interior causing dry season (1 mark)
- Station B (Temperate oceanic): Year-round rainfall from frontal systems (1 mark)
- Maritime location receives moisture from ocean throughout year (1 mark)
- Westerly winds bring regular succession of weather fronts with associated rainfall (1 mark)
Section C: Human Geography and Sustainability [15 marks]
Question 7
(a) Relationship description [3 marks]:
- Initial stage shows environmental quality remains stable as tourism development begins (1 mark)
- Middle stage shows environmental quality declining as tourism development accelerates (1 mark)
- Final stage shows continued decline in environmental quality with high tourism development (1 mark)
(b) Environmental quality changes [6 marks]:
- Initial stability: Low tourist numbers have minimal environmental impact (1 mark)
- Declining quality - Infrastructure development: Hotels, roads, and facilities require land clearance and habitat destruction (1 mark)
- Pollution increase: More visitors generate waste, sewage, and emissions that exceed local capacity (1 mark)
- Resource depletion: Increased demand for water, energy, and food strains local resources (1 mark)
- Habitat disturbance: Tourist activities disturb wildlife and damage fragile ecosystems (1 mark)
- Carrying capacity exceeded: Tourist numbers surpass environment's ability to recover naturally (1 mark)
(c) Sustainable tourism modifications [6 marks]:
- Visitor limits: Implement carrying capacity controls to prevent overcrowding and environmental damage (1 mark)
- Zoning systems: Designate protected areas off-limits to tourists while concentrating activities in suitable zones (1 mark)
- Green infrastructure: Use renewable energy, waste treatment systems, and sustainable building materials (1 mark)
- Education programs: Inform tourists about environmental sensitivity and appropriate behavior (1 mark)
- Local community involvement: Ensure tourism benefits local people who then have incentive to protect environment (1 mark)
- Monitoring and adaptive management: Regular assessment of environmental indicators with ability to adjust tourism activities (1 mark)
Total: 60 marks
Grade Boundaries:
- A1: 54-60 marks (90-100%)
- A2: 48-53 marks (80-89%)
- B3: 42-47 marks (70-79%)
- B4: 36-41 marks (60-69%)
- C5: 30-35 marks (50-59%)
- C6: 24-29 marks (40-49%)
Free quiz and exam paper access
Enter your details to view this paper
Your access is remembered on this device.