AI Generated Quiz
Secondary 4 Elementary Mathematics Statistics Probability Quiz
Free Sec 4 E Maths Statistics quiz, HY3 AI version, with questions, answers, and O Level-style practice for Singapore students.
These static practice materials are generated from the site's syllabus and paper-generation workflow, with source and model context shown so students and parents can evaluate the material before use.
Questions
Secondary 4 Elementary Mathematics Quiz - Statistics Probability
Name: ___________________________
Class: _________
Date: ____________
Score: _______ / 40
Duration: 50 minutes
Total Marks: 40
Instructions:
- Answer all 20 questions.
- Show your working clearly where required.
- Write probabilities as fractions in simplest form, decimals, or percentages as instructed.
- Use the provided spaces for your answers.
Section A: Basic Probability (Questions 1–5)
1. A bag contains 5 red balls, 3 blue balls, and 2 green balls. A ball is picked at random. Find the probability that it is a red ball. [2]
2. A fair six-sided die is rolled. Find the probability of obtaining an even number. [2]
3. A letter is chosen at random from the word "MATHEMATICS". Find the probability that the letter is an "A". [2]
4. A box contains 10 cards numbered 1 to 10. A card is drawn at random. Find the probability that the number is a multiple of 3. [2]
5. The table below shows the number of students in a class by favourite sport.
| Sport | Football | Badminton | Swimming | Others |
|---|---|---|---|---|
| Boys | 8 | 6 | 4 | 2 |
| Girls | 5 | 7 | 3 | 5 |
A student is selected at random. Find the probability that the student is a girl who likes Badminton. [2]
Section B: Probability of Combined Events (Questions 6–10)
6. Two fair coins are tossed. List all the possible outcomes and find the probability of getting exactly one head. [3]
7. A bag has 4 red and 6 blue marbles. Two marbles are drawn one after another without replacement. Find the probability that both are red. [3]
8. A spinner has 3 equal sections coloured red, blue, and green. It is spun twice. Find the probability of getting red on the first spin and blue on the second spin. [2]
9. Events A and B are such that P(A)=0.4, P(B)=0.5, and P(A∩B)=0.2. Find P(A∪B). [2]
10. In a class of 30 students, 18 study Physics, 15 study Chemistry, and 7 study both. Find the probability that a randomly chosen student studies Physics or Chemistry. [3]
Section C: Data Interpretation and Statistics (Questions 11–15)
11. The table below shows the scores of 20 students in a test.
| Score | 2 | 3 | 4 | 5 | 6 |
|---|---|---|---|---|---|
| Frequency | 3 | 5 | 6 | 4 | 2 |
Find the mean score. [3]
12. Using the data in Question 11, find the median score. [2]
13. Using the data in Question 11, find the mode of the scores. [1]
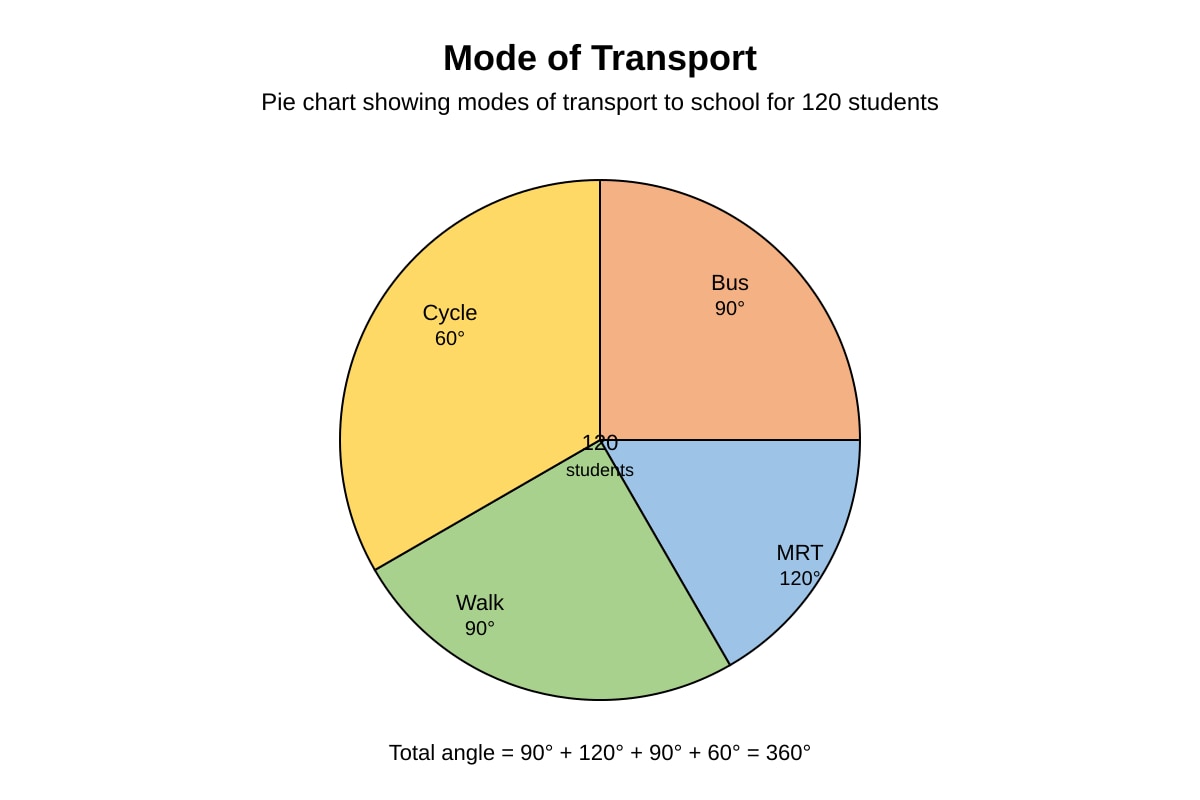
14. The pie chart below shows how 120 students travel to school.
Image pending generation: chart for Q14.
Find the number of students who travel by MRT. [2]
15. The stem-and-leaf diagram below shows the masses (in kg) of 12 students.
Stem | Leaf
4 | 2 5 7
5 | 0 1 3 6 8
6 | 2 4 9
Key: 4 | 2 means 42 kg
Find the range of the masses. [2]
Section D: Problem Solving (Questions 16–20)
16. A box contains 3 defective and 7 good bulbs. Two bulbs are selected at random without replacement. Find the probability that exactly one is defective. [3]
17. The table below shows the heights of 50 plants.
| Height (cm) | 10–14 | 15–19 | 20–24 | 25–29 |
|---|---|---|---|---|
| Frequency | 8 | 14 | 18 | 10 |
Find the probability that a randomly selected plant has height between 15 cm and 24 cm. [3]
18. A game is played by rolling a fair die. If a prime number is rolled, the player wins 2.Otherwise,theplayerloses1. Find the expected gain per game. [3]
19. Set ξ = {1,2,3,4,5,6,7,8,9,10}, A = {even numbers}, B = {multiples of 3}. Draw a Venn diagram and find P(A∩B). [3]
20. A survey of 200 students found that 80 like Mathematics, 70 like Science, and 30 like both. Find the probability that a student likes Mathematics but not Science. [3]
Answers
Secondary 4 Elementary Mathematics Quiz - Statistics Probability (Answer Key)
Total Marks: 40
Section A: Basic Probability
1. [2 marks]
Total balls = 5 + 3 + 2 = 10.
Red balls = 5.
P(red)=105=21.
Teaching note: Probability = number of favourable outcomes ÷ total outcomes. Simplify fraction.
Common mistake: Forgetting to add all balls for total.
2. [2 marks]
Even numbers on die: 2, 4, 6 → 3 outcomes.
Total outcomes = 6.
P(even)=63=21.
Teaching note: List favourable outcomes explicitly.
3. [2 marks]
"MATHEMATICS" has 11 letters. A appears at positions 2, 5, 9 → 3 times.
P(A)=113.
Teaching note: Count total letters and count target letter, including repeats.
4. [2 marks]
Multiples of 3 from 1–10: 3, 6, 9 → 3 numbers.
P(multiple of 3)=103.
5. [2 marks]
Girls who like Badminton = 7.
Total students = 8+6+4+2+5+7+3+5 = 40.
P=407.
Teaching note: Read table carefully; intersection of row and column.
Section B: Probability of Combined Events
6. [3 marks]
Outcomes: HH, HT, TH, TT (1 mark for list).
Exactly one head: HT, TH → 2 outcomes (1 mark).
P=42=21 (1 mark).
Teaching note: Use systematic listing for two coins.
7. [3 marks]
P(first red)=104.
After one red removed: 3 red, 9 total → P(second red)=93.
P(both red)=104×93=9012=152.
Teaching note: Without replacement reduces total and favourable.
8. [2 marks]
P(red then blue)=31×31=91.
Teaching note: Independent events, multiply probabilities.
9. [2 marks]
P(A∪B)=P(A)+P(B)−P(A∩B)=0.4+0.5−0.2=0.7.
Teaching note: Addition rule avoids double-counting intersection.
10. [3 marks]
n(Phys∪Chem)=18+15−7=26.
P=3026=1513.
Teaching note: Use set formula, then divide by class size.
Section C: Data Interpretation and Statistics
11. [3 marks]
Mean=20(2×3)+(3×5)+(4×6)+(5×4)+(6×2)
=206+15+24+20+12=2077=3.85.
Teaching note: Multiply score by frequency, sum, divide by total frequency.
12. [2 marks]
Cumulative: 3 (2), 8 (3), 14 (4), 18 (5), 20 (6).
Middle positions 10th & 11th both in score 4 group → median = 4.
Teaching note: For 20 data, median is average of 10th and 11th.
13. [1 mark]
Mode = 4 (highest frequency 6).
14. [2 marks]
MRT angle = 120° out of 360°.
Number = 360120×120=40 students.
Teaching note: Pie chart proportion = angle ÷ 360 × total.
15. [2 marks]
Masses: 42,45,47,50,51,53,56,58,62,64,69.
Range = 69 – 42 = 27 kg.
Teaching note: Range = max – min from stem-and-leaf.
Section D: Problem Solving
16. [3 marks]
Exactly one defective: (D, G) or (G, D).
P(D,G)=103×97=9021.
P(G,D)=107×93=9021.
Total = 9042=157.
Teaching note: Two mutually exclusive cases added.
17. [3 marks]
Plants 15–24 cm: freq 14 + 18 = 32.
Total 50.
P=5032=2516.
Teaching note: Combine adjacent groups correctly.
18. [3 marks]
Prime numbers: 2,3,5 → 3 outcomes, P(win)=63=0.5, gain 2.ElseP = 0.5,loss1.
Expected = 0.5\times2 + 0.5\times(-1) = 1 - 0.5 = \0.50$.
Teaching note: Expected value = Σ(prob × outcome).
19. [3 marks]
A = {2,4,6,8,10}, B = {3,6,9}. Intersection = {6} → 1 element.
ξ has 10. P(A∩B)=101.
Teaching note: Venn shows overlap at 6 only.
20. [3 marks]
Like Math only = 80 – 30 = 50.
P=20050=41.
Teaching note: Subtract intersection from set A.
Free quiz and exam paper access
Enter your details to view this paper
Your access is remembered on this device.