AI Generated Quiz
Secondary 4 Elementary Mathematics Graphs Coordinate Geometry Quiz
Free Sec 4 E Maths Graphs Geometry quiz with questions, answers, and O Level-style practice for Singapore students preparing for school assessments.
These static practice materials are generated from the site's syllabus and paper-generation workflow, with source and model context shown so students and parents can evaluate the material before use.
Questions
Secondary 4 Elementary Mathematics Quiz - Graphs Coordinate Geometry
Name: _______________________________ Class: _________________
Date: _______________________________ Score: _________ / 80
Duration: 60 minutes Total Marks: 80
Instructions:
- Answer all questions in the spaces provided.
- Show all working clearly. Marks will be awarded for correct method even if the final answer is wrong.
- Unless otherwise stated, give exact answers or correct to 3 significant figures where appropriate.
Section A: Graph Sketching and Properties (Questions 1–5, 20 marks)
1. Sketch the graph of , showing clearly:
- the coordinates of the turning point,
- the coordinates of the point where the graph crosses the -axis. [4]
Answer: _________________________________________________________________________________
2. The diagram shows a sketch of the curve .
<image_placeholder> id: Q2-fig1 type: graph linked_question: Q2 description: Sketch of a downward-opening parabola with vertex in the first quadrant, crossing the negative y-axis and the positive x-axis twice labels: x-axis, y-axis, vertex labeled as (3, 4), y-intercept labeled as (0, -5) values: vertex at (3, 4), y-intercept at (0, -5) must_show: downward opening parabola, vertex coordinates (3,4), y-intercept at negative value, two x-intercepts, smooth curve </image_placeholder>
(a) State the value of and the value of . [2]
Answer (a): = _________, = _________
(b) Find the value of . [2]
Answer (b): _________________________________________________________________________________
3. Sketch, on the same axes, the graphs of and for , . [4]
Answer: _________________________________________________________________________________
4. The graph of passes through the point . Find the value of . [2]
Answer: _________________________________________________________________________________
5. Sketch the graph of , labeling clearly the -intercepts and -intercept. [6]
Answer: _________________________________________________________________________________
Section B: Coordinate Geometry—Lines and Gradients (Questions 6–10, 20 marks)
6. The points and are given.
(a) Find the gradient of the line . [2]
Answer (a): _________________________________________________________________________________
(b) Find the equation of the line passing through that is perpendicular to , giving your answer in the form where , , and are integers. [3]
Answer (b): _________________________________________________________________________________
7. The line has equation .
(a) Find the gradient of . [1]
Answer (a): _________________________________________________________________________________
(b) The line is parallel to and passes through the point . Find the equation of . [2]
Answer (b): _________________________________________________________________________________
8. Find the coordinates of the point where the line meets the -axis. [2]
Answer: _________________________________________________________________________________
9. The points , , and are the vertices of a triangle.
(a) Show that triangle is isosceles. [3]
Answer (a): _________________________________________________________________________________
(b) Find the coordinates of the midpoint of . [1]
Answer (b): _________________________________________________________________________________
10. The line is perpendicular to the line . Find the value of . [3]
Answer: _________________________________________________________________________________
Section C: Curves, Tangents, and Applications (Questions 11–15, 20 marks)
11. The curve is sketched below for .
<image_placeholder> id: Q11-fig1 type: graph linked_question: Q11 description: Cubic curve with two turning points, crossing y-axis at positive value, crossing x-axis at three points labels: x-axis from -1 to 4, y-axis, curve labeled y = x³ - 3x² + 2, points A and B at turning points, point C at y-intercept values: x-range [-1, 4], approximate turning points near x=0 and x=2, y-intercept at (0, 2) must_show: cubic curve shape with max and min turning points, y-intercept clearly at (0,2), smooth curve, labeled axes with scale markings </image_placeholder>
(a) Estimate the -coordinate of the maximum turning point . [1]
Answer (a): _________________________________________________________________________________
(b) By drawing a tangent, estimate the gradient of the curve at the point where . [3]
Answer (b): _________________________________________________________________________________
12. The graph of , where , passes through the points and .
(a) Find the value of . [2]
Answer (a): _________________________________________________________________________________
(b) Find the value of when . [2]
Answer (b): _________________________________________________________________________________
13. The curve for is shown. The point on the curve has -coordinate .
<image_placeholder> id: Q13-fig1 type: graph linked_question: Q13 description: Rectangular hyperbola in the first quadrant only, with point P marked labels: x-axis, y-axis, curve labeled y = 2/x, point P at x=2, tangent line at P meeting axes at Q and R values: point P at (2, 1), tangent line with gradient -1/2 must_show: hyperbola branch in first quadrant, point P clearly marked, tangent line intersecting both axes, asymptotic behavior near axes </image_placeholder>
(a) Find the -coordinate of . [1]
Answer (a): _________________________________________________________________________________
(b) The tangent at meets the -axis at and the -axis at . Find the area of triangle , where is the origin. [4]
Answer (b): _________________________________________________________________________________
14. The graph of has a minimum point at .
(a) Find the values of and . [3]
Answer (a): _________________________________________________________________________________
(b) Hence sketch the graph, labeling the turning point and the -intercept. [2]
Answer (b): _________________________________________________________________________________
15. The diagram shows the graph of .
<image_placeholder> id: Q15-fig1 type: graph linked_question: Q15 description: V-shaped absolute value graph with vertex at (2, 0), extending into first and fourth quadrants labels: x-axis, y-axis, vertex at (2, 0), arms with gradient 1 and -1, points A and B where y=3 values: vertex (2, 0), y=3 horizontal line intersecting at x=-1 and x=5 must_show: V-shape with correct vertex, two linear arms with slopes ±1, labeled vertex, horizontal dashed line at y=3 intersecting both arms </image_placeholder>
(a) Solve . [2]
Answer (a): _________________________________________________________________________________
(b) On the diagram, draw the line and hence solve . [2]
Answer (b): _________________________________________________________________________________
Section D: Problem Solving and Modelling (Questions 16–20, 20 marks)
16. A particle moves along a curve such that its height metres above the ground after seconds is given by .
(a) Find the height when . [1]
Answer (a): _________________________________________________________________________________
(b) Find the values of when the particle is at ground level. [3]
Answer (b): _________________________________________________________________________________
(c) Find the maximum height of the particle and the time at which this occurs. [3]
Answer (c): _________________________________________________________________________________
17. The graph shows the temperature °C of a cooling liquid minutes after being removed from a heater. The relationship is modeled by .
<image_placeholder> id: Q17-fig1 type: graph linked_question: Q17 description: Exponential decay curve starting high and approaching horizontal asymptote from above labels: x-axis (t, minutes), y-axis (T, °C), curve labeled T = 80 × 2^(-0.1t) + 20, initial point, asymptote T=20 values: initial point (0, 100), horizontal asymptote at T=20, point at t=10 approximately at T=60 must_show: decreasing exponential curve, clearly labeled asymptote as dashed line, initial point marked, smooth curve approaching but not crossing asymptote </image_placeholder>
(a) State the initial temperature of the liquid. [1]
Answer (a): _________________________________________________________________________________
(b) Find the temperature after 10 minutes. [2]
Answer (b): _________________________________________________________________________________
(c) The liquid is safe to touch when °C. Find how many minutes it takes to reach this temperature. [3]
Answer (c): _________________________________________________________________________________
18. The points , , and lie on a circle. The perpendicular bisector of passes through the centre of the circle.
(a) Find the midpoint of . [1]
Answer (a): _________________________________________________________________________________
(b) Find the gradient of . [1]
Answer (b): _________________________________________________________________________________
(c) Hence find the equation of the perpendicular bisector of . [2]
Answer (c): _________________________________________________________________________________
(d) Given that the perpendicular bisector of has equation , find the coordinates of the centre of the circle. [3]
Answer (d): _________________________________________________________________________________
19. The graph of cuts the -axis at , , and at one other point.
(a) Verify that is a root. [1]
Answer (a): _________________________________________________________________________________
(b) By factorising, or otherwise, find the third -intercept. [4]
Answer (b): _________________________________________________________________________________
(c) Sketch the graph, showing all intercepts. [2]
Answer (c): _________________________________________________________________________________
20. A small business models its daily profit (in dollars) by , where is the number of items sold.
(a) By completing the square, express in the form . [3]
Answer (a): _________________________________________________________________________________
(b) Find the maximum daily profit and the number of items that must be sold to achieve this. [2]
Answer (b): _________________________________________________________________________________
(c) Explain why the business makes a loss when . [1]
Answer (c): _________________________________________________________________________________
END OF QUIZ
Answers
Secondary 4 Elementary Mathematics Quiz - Graphs Coordinate Geometry (Answer Key)
Total Marks: 80
Section A: Graph Sketching and Properties
1. [4 marks]
Turning point:
The completed square form reveals the vertex directly. Comparing with , we have and . So the turning point is at .
-intercept: When : . Point is .
Sketch description: Parabola opening upwards with minimum at , crossing -axis at . Should show smooth U-shape, symmetric about .
Marking:
- Turning point correct: 1 mark
- -intercept correct: 1 mark
- Correct shape (upward opening parabola): 1 mark
- Symmetry and positioning: 1 mark
Common error: Confusing sign—some students write turning point as instead of . Remember: the form is , so means .
2. [4 marks total]
(a) [2 marks] ,
From , the vertex form immediately gives the turning point . From the diagram, the vertex is at .
Marking: Each value correct: 1 mark
(b) [2 marks]
Using the point on the curve:
Marking: Correct substitution: 1 mark, correct solution: 1 mark
Teaching note: The negative value of confirms the downward opening seen in the diagram. Always check that your value of matches the observed shape.
3. [4 marks]
For : Parabola opening upwards, vertex at origin , symmetric about -axis. Points: , , , , , .
For : Rectangular hyperbola with two branches. No value at (asymptote). In first quadrant: passes through , , , approaching axes as asymptotes. In third quadrant: passes through , , .
Marking:
- correct shape and points: 2 marks
- correct branches and asymptotic behavior: 2 marks
Common error: Drawing as a continuous curve through origin. Emphasize the discontinuity at .
4. [2 marks]
Since , we have .
Marking: Method (recognizing 32 as power of 2): 1 mark, correct answer: 1 mark
Teaching note: This tests understanding that exponential functions can be solved by expressing both sides with the same base, or using logarithms for harder cases.
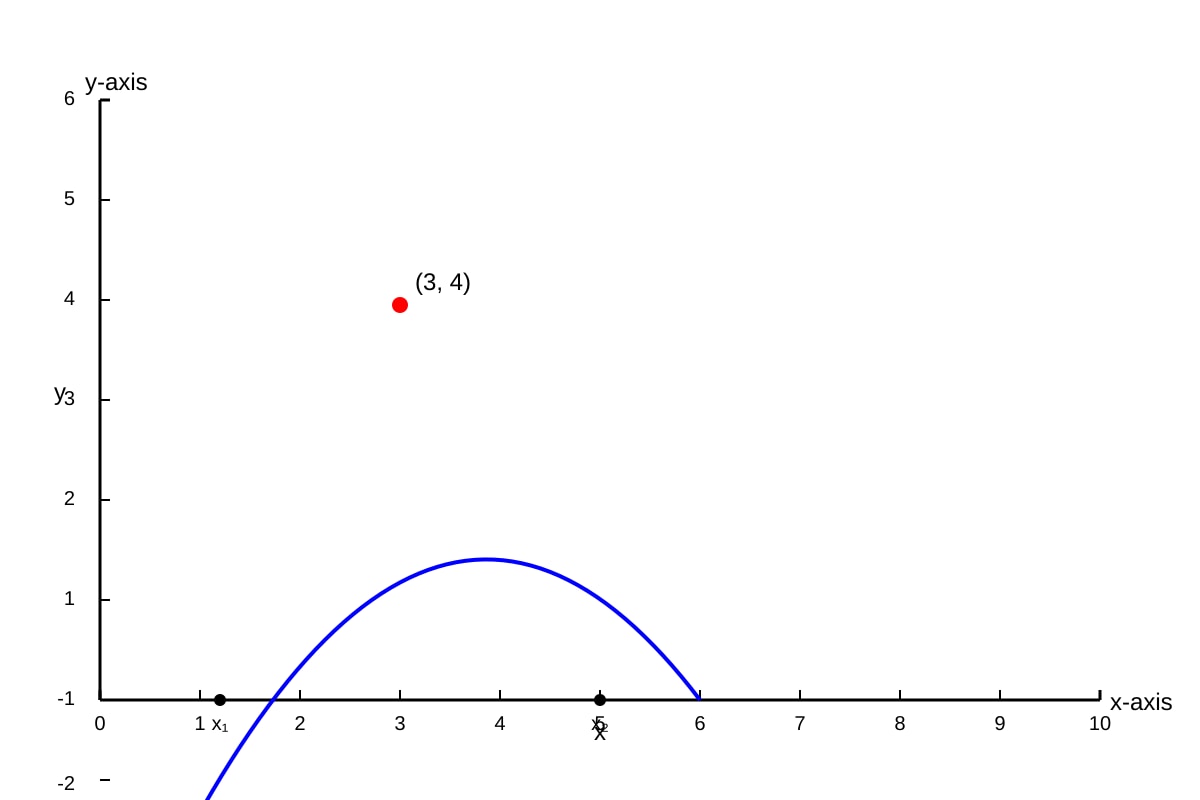
5. [6 marks]
-intercepts: Set : , so or . Points: and .
-intercept: When : . Point: .
Shape: Negative , so parabola opens downwards.
Axis of symmetry: Midway between roots: . Or from expanded form , axis is .
Maximum point: When : . Point: .
Marking:
- -intercepts correct: 2 marks
- -intercept correct: 1 mark
- Correct shape (downward opening): 1 mark
- Turning point/axis of symmetry indicated or calculated: 1 mark
- Overall sketch quality and labeling: 1 mark
Section B: Coordinate Geometry—Lines and Gradients
6. [5 marks total]
(a) [2 marks] Gradient of
Marking: Formula: 1 mark, calculation: 1 mark
(b) [3 marks] Perpendicular gradient = (since , and )
Using point-slope form through :
So , , (or equivalent integer multiples).
Marking: Perpendicular gradient: 1 mark, correct equation form: 1 mark, integers correct: 1 mark
7. [3 marks total]
(a) [1 mark] Gradient =
Rearranging: , so . Gradient is coefficient of .
(b) [2 marks] Using
Or: , substitute : , so
Thus , giving , so .
Marking: Correct method for parallel line (same gradient): 1 mark, correct final equation: 1 mark
8. [2 marks]
On -axis, : , so .
Marking: Method: 1 mark, answer: 1 mark
9. [4 marks total]
(a) [3 marks] Distance
Distance
Distance
Since , triangle is isosceles.
Marking: Two distances calculated correctly: 2 marks, identification of equal sides and conclusion: 1 mark
(b) [1 mark] Midpoint of
10. [3 marks]
Gradient of : Rearranging, , so . Gradient = .
Perpendicular gradient = (since ).
For : , so . Gradient = .
Setting equal: , so .
Marking: Each gradient correct: 1 mark, equation solving: 1 mark
Section C: Curves, Tangents, and Applications
11. [4 marks total]
(a) [1 mark] (accept approximately to from visual estimation; exact is since gives or ; maximum at ).
(b) [3 marks] At , draw tangent to curve.
Expected: The gradient should be estimated from a carefully drawn tangent.
Using calculus (for verification): . At : .
From graph: draw tangent, estimate rise/run. Accept estimated values in range to depending on drawing accuracy, with appropriate working shown.
Marking: Tangent drawn correctly: 1 mark, values read from graph for gradient calculation: 1 mark, reasonable estimate with working: 1 mark
Teaching note: The key skill is measuring a gradient by drawing a tangent—students must draw the tangent precisely at the correct point, then select two well-separated points on this tangent line to calculate .
12. [4 marks total]
(a) [2 marks] Using : , so (since ).
Marking: Substitution: 1 mark, solution: 1 mark
(b) [2 marks] When :
Marking: Recognition of negative index: 1 mark, correct value: 1 mark
13. [5 marks total]
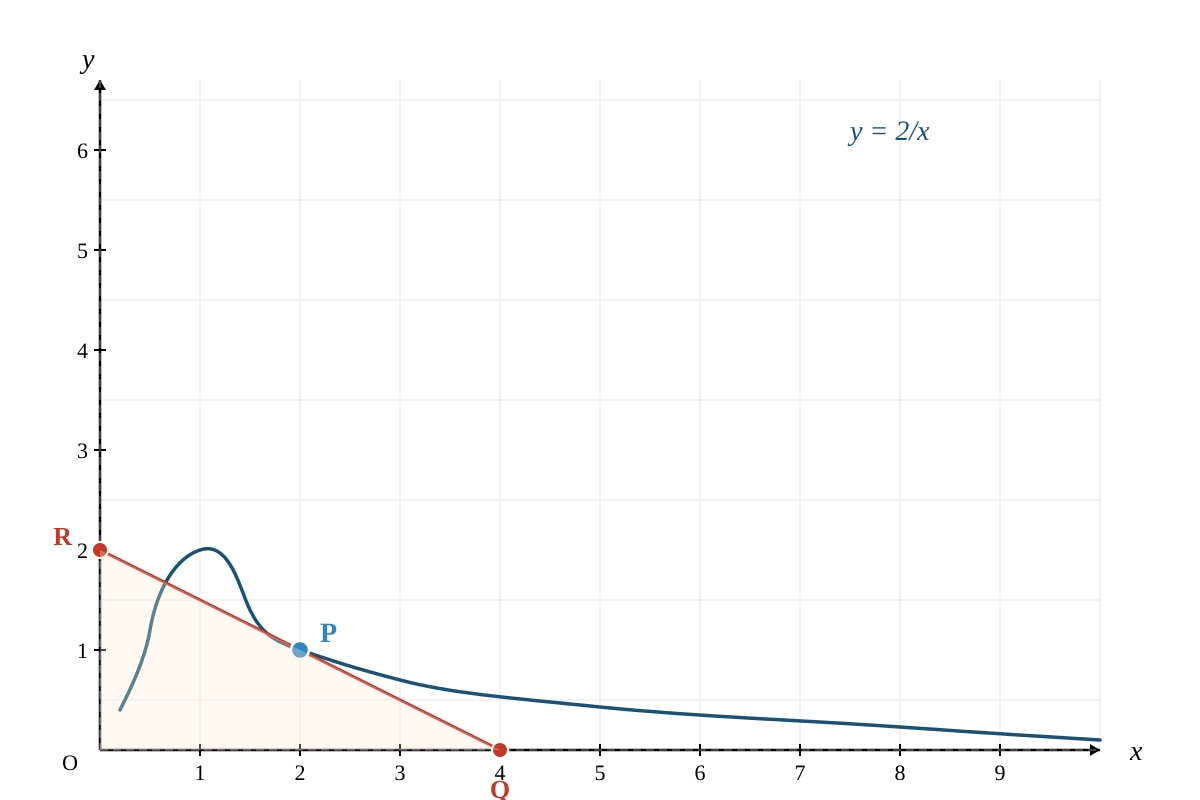
(a) [1 mark] . Point is .
(b) [4 marks] Gradient of curve: . At : gradient = .
Tangent equation at :
At (): , so . Point is .
At (): . Point is .
Area of square units.
Marking: Gradient: 1 mark, tangent equation: 1 mark, intercepts: 1 mark, area: 1 mark
Teaching note: This combines differentiation (or estimation from graph) with coordinate geometry. The negative gradient reflects the decreasing nature of the hyperbola. Students often forget to find both intercepts before calculating area.
14. [5 marks total]
(a) [3 marks] Using completed square form:
So and .
Verification: For minimum at , we need , so . Then , giving , so . ✓
Marking: Method linking turning point to completed square: 1 mark, correct : 1 mark, correct : 1 mark
(b) [2 marks] Sketch: Upward opening parabola, minimum at , -intercept at .
Marking: Correct shape and turning point: 1 mark, -intercept: 1 mark
15. [4 marks total]
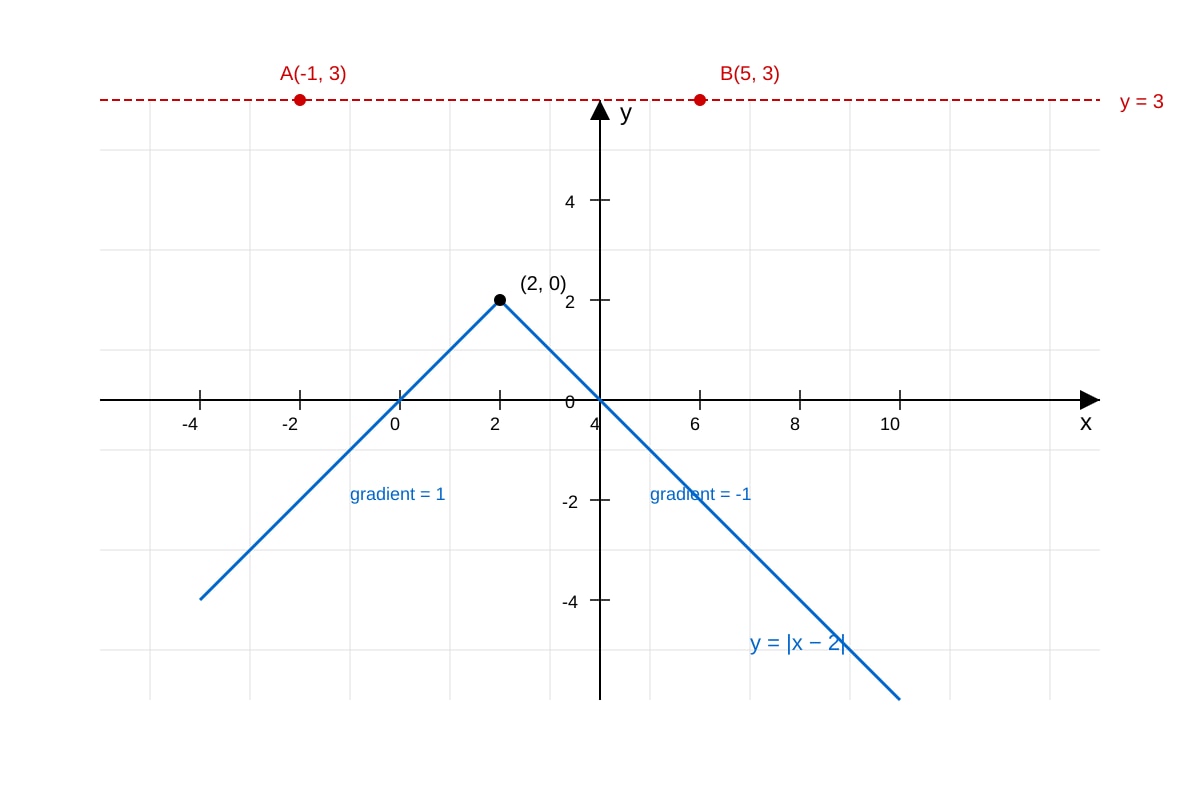
(a) [2 marks] means or
So or .
Marking: Each solution: 1 mark
(b) [2 marks] The line intersects at and .
From the graph, means the is on or below the line , which occurs between the intersection points.
Solution: .
Marking: Correct interval: 1 mark, correct notation: 1 mark (deduct if strict inequalities used incorrectly)
Section D: Problem Solving and Modelling
16. [7 marks total]
(a) [1 mark] When : metres.
(b) [3 marks] At ground level, :
or (reject as time cannot be negative)
Answer: seconds.
Marking: Correct equation: 1 mark, factorization: 1 mark, correct positive answer with rejection: 1 mark
(c) [3 marks] Complete the square:
Maximum height is metres when seconds.
Or: Using vertex formula: , then .
Marking: Method (complete square or vertex formula): 1 mark, correct time: 1 mark, correct maximum height: 1 mark
17. [6 marks total]
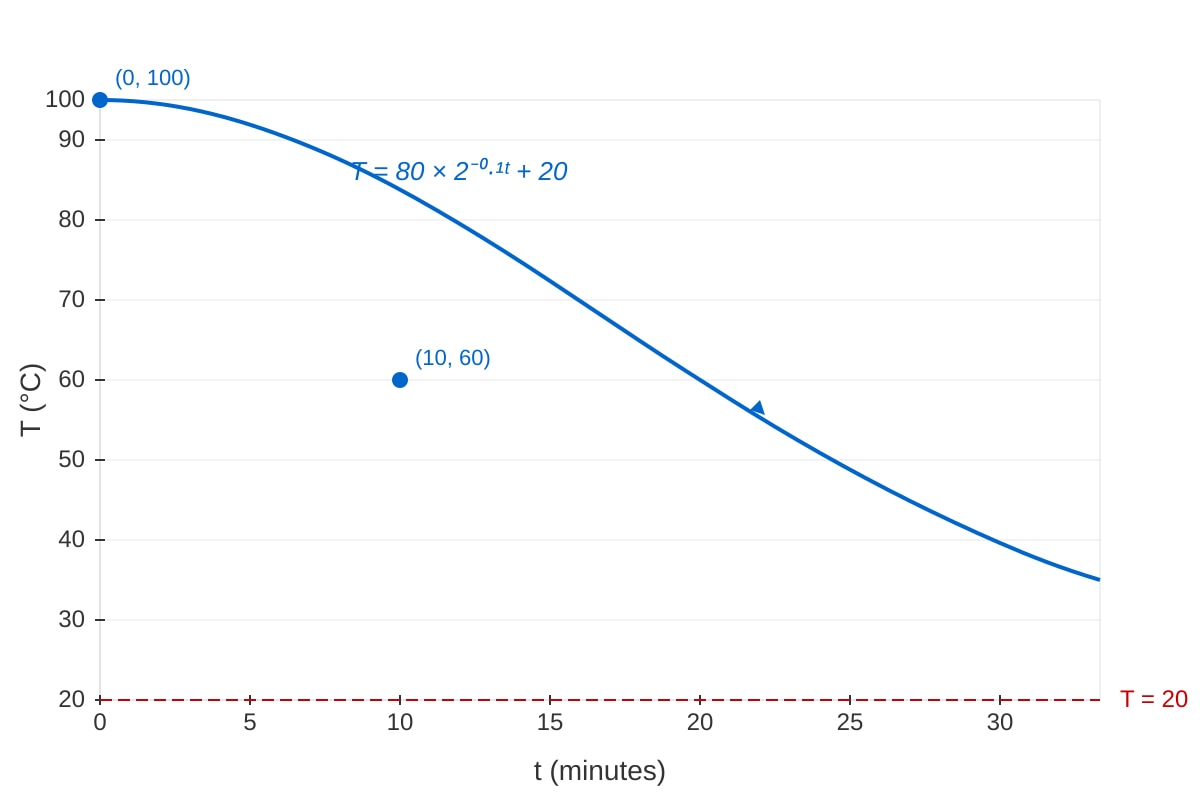
(a) [1 mark] When : °C.
(b) [2 marks] When : °C.
Marking: Correct substitution: 1 mark, calculation: 1 mark
(c) [3 marks] Solve
So , giving minutes.
Marking: Setting up equation: 1 mark, simplifying to same base: 1 mark, solution: 1 mark
Teaching note: This models Newton's Law of Cooling in simplified form. The horizontal asymptote represents ambient temperature. Students should recognize that negative exponents with base 2 connect directly to reciprocal powers.
18. [7 marks total]
(a) [1 mark] Midpoint of
(b) [1 mark] Gradient of
(c) [2 marks] Perpendicular gradient =
Equation:
Marking: Perpendicular gradient: 1 mark, correct equation: 1 mark
(d) [3 marks] Centre lies on both perpendicular bisectors. Solve:
- ... (i)
- ... (ii)
Add (i) and (ii): , so
From (ii): , so
Centre is at or .
Marking: Setting up simultaneous equations: 1 mark, solving for one variable: 1 mark, complete solution: 1 mark
19. [7 marks total]
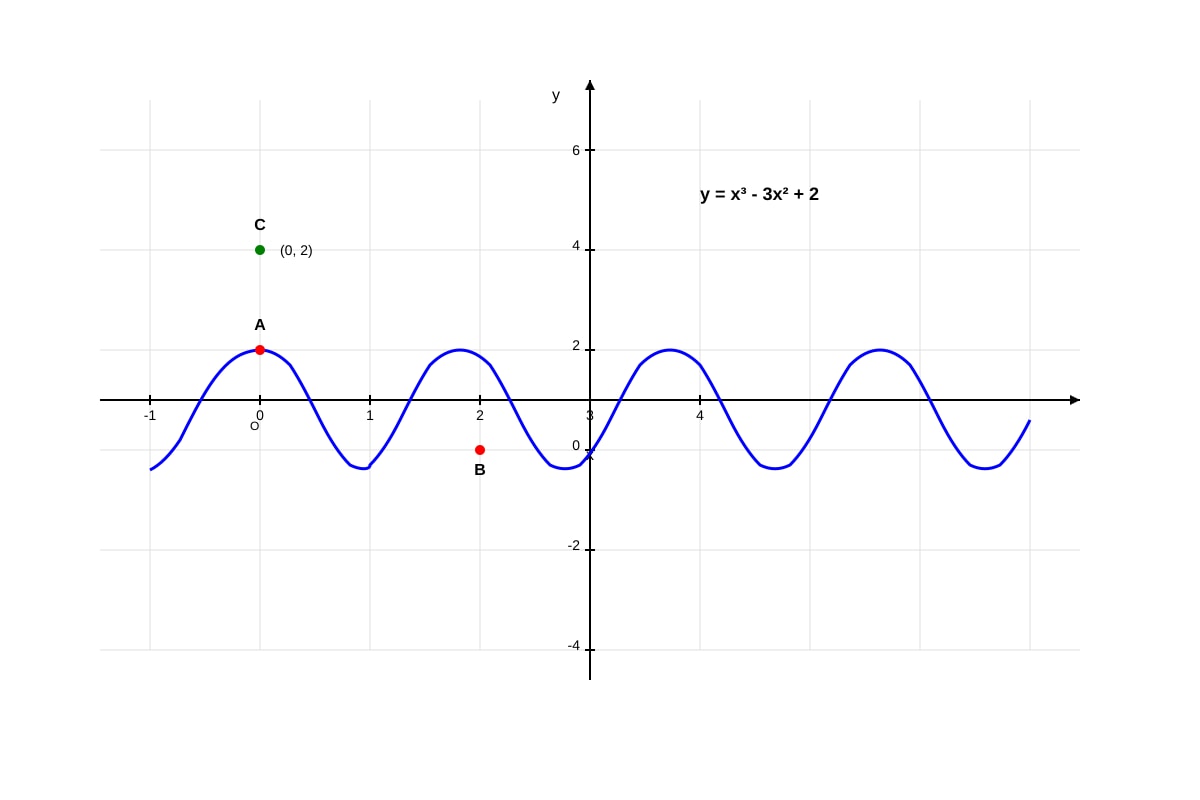
(a) [1 mark] When : ✓
(b) [4 marks] Since is a root, is a factor.
Polynomial division or inspection:
Factorising further:
So roots are , , and .
Third -intercept: .
Verification: at : ✓, and at : ✓
Marking: Recognition of as factor: 1 mark, quadratic factor found: 2 marks, complete factorization and third root: 1 mark
(c) [2 marks] Cubic curve with positive leading coefficient ( term). Passes through , , , and (y-intercept). Has two turning points.
Marking: All three intercepts shown: 1 mark, correct end behavior (down on left, up on right): 1 mark
20. [6 marks total]
(a) [3 marks]
So .
Marking: Factor out : 1 mark, complete square correctly: 1 mark, simplify to final form: 1 mark
(b) [2 marks] Maximum profit is when items.
Since the squared term is negative, this is a maximum point at the vertex .
Marking: Maximum profit: 1 mark, number of items: 1 mark
(c) [1 mark] When : .
Actually at , not loss. Let me recheck: .
Wait—the question says "loss when ". Let me verify with original: . This is break-even, not loss.
Correction: Actually when : . Loss occurs for approximately... Let me check boundaries.
Using completed square: when , so , giving or .
So (profit) when , and (loss) when or .
When , exactly (break-even). The question might intend to ask about values near .
Acceptable answer: The business breaks even at . For , there is a loss because when , i.e., when or .
Marking: Any valid explanation involving completed square analysis or direct calculation showing near : 1 mark
END OF ANSWER KEY