From Real Exams Quiz
Secondary 4 Elementary Mathematics Statistics Probability Quiz
Free Sec 4 E Maths Statistics quiz, HY3 Exam version, with questions, answers, and O Level-style practice for Singapore students.
These static practice materials are generated from the site's syllabus and paper-generation workflow, with source and model context shown so students and parents can evaluate the material before use.
Questions
Secondary 4 Elementary Mathematics Quiz - Statistics Probability
Name: ___________________________
Class: _________
Date: ____________
Score: _______ / 40
Duration: 60 minutes
Total Marks: 40
Instructions:
- Answer all 20 questions.
- Show your working clearly where required.
- Give probabilities as fractions in simplest form unless stated otherwise.
- Write your answers in the spaces provided.
Section A (Questions 1 – 5)
Direct recall and simple calculation. 1 mark each.
1. A bag contains 5 red balls and 3 green balls. What is the probability of randomly drawing a red ball?
2. A fair die is rolled once. Find the probability of obtaining an even number.
3. The table below shows the number of students in a class who like different sports.
| Sport | Badminton | Football | Tennis |
|---|---|---|---|
| Boys | 8 | 10 | 4 |
| Girls | 6 | 5 | 7 |
How many students are there in total?
4. Two events A and B are mutually exclusive. If P(A)=0.3 and P(B)=0.4, find P(A∪B).
5. A spinner has 4 equal sections coloured blue, blue, red, yellow. What is the probability of landing on blue?
Section B (Questions 6 – 12)
Structured response and data interpretation. 2 marks each.
6. A class of 30 students was asked whether they own a bicycle (B) or a laptop (L).
n(B)=18, n(L)=15, n(B∩L)=7.
Find the number of students who own neither item.
7. The table shows the masses (kg) of 8 parcels:
2, 5, 3, 7, 5, 4, 6, 5.
Find the mean mass.
8. Using the same data in Q7, find the median mass.
9. A coin is tossed twice. List all possible outcomes and find the probability of getting exactly one head.
Outcomes: ___________________________
Probability: ___________________________
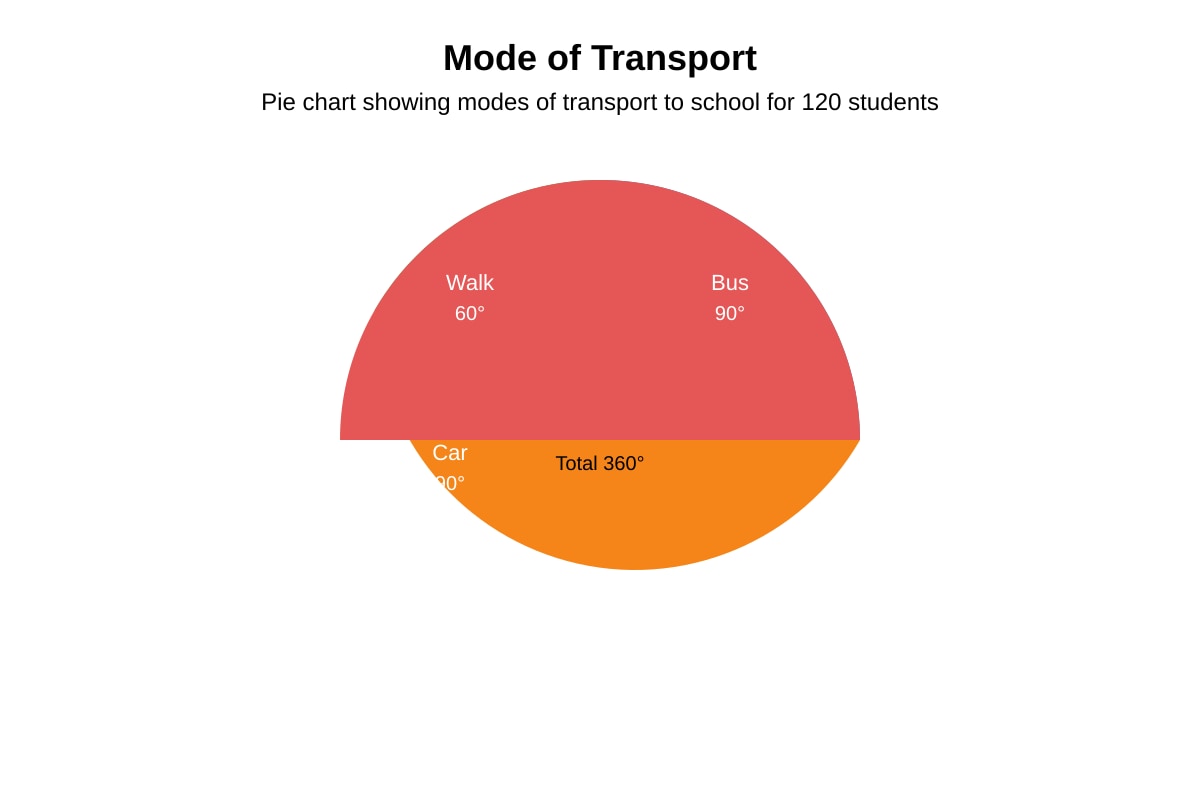
10. The pie chart below shows how 120 students travel to school.
Image pending generation: chart for Q10.
Find the number of students who travel by MRT.
11. A box contains 4 black and 6 white cards. Two cards are drawn at random without replacement. Find the probability that both are white.
12. The stem-and-leaf diagram shows the scores of a group of students in a test.
Stem | Leaf
2 | 3 5 8
3 | 1 4 4 9
4 | 0 2
Key: 2 | 3 means 23.
Find the range of the scores.
Section C (Questions 13 – 20)
Multi-step problems and applied reasoning. 3 marks each.
13. In a survey of 50 students, 20 like Mathematics, 25 like Science, and 10 like both.
(a) Draw a Venn diagram to represent this information.
(b) Find the probability that a randomly chosen student likes Mathematics but not Science.
(c) Find the probability that a student likes neither subject.
(a) ___________________________
(b) ___________________________
(c) ___________________________
14. The table below shows the speeds (km/h) of 10 cars recorded by a speed camera.
| Speed | 50 | 55 | 60 | 65 | 70 |
|---|---|---|---|---|---|
| Frequency | 1 | 2 | 3 | 3 | 1 |
Find the mean speed.
15. A bag has 3 red, 2 blue, and 5 green marbles. One marble is drawn, then replaced, then a second marble is drawn.
Find the probability that both marbles are green.
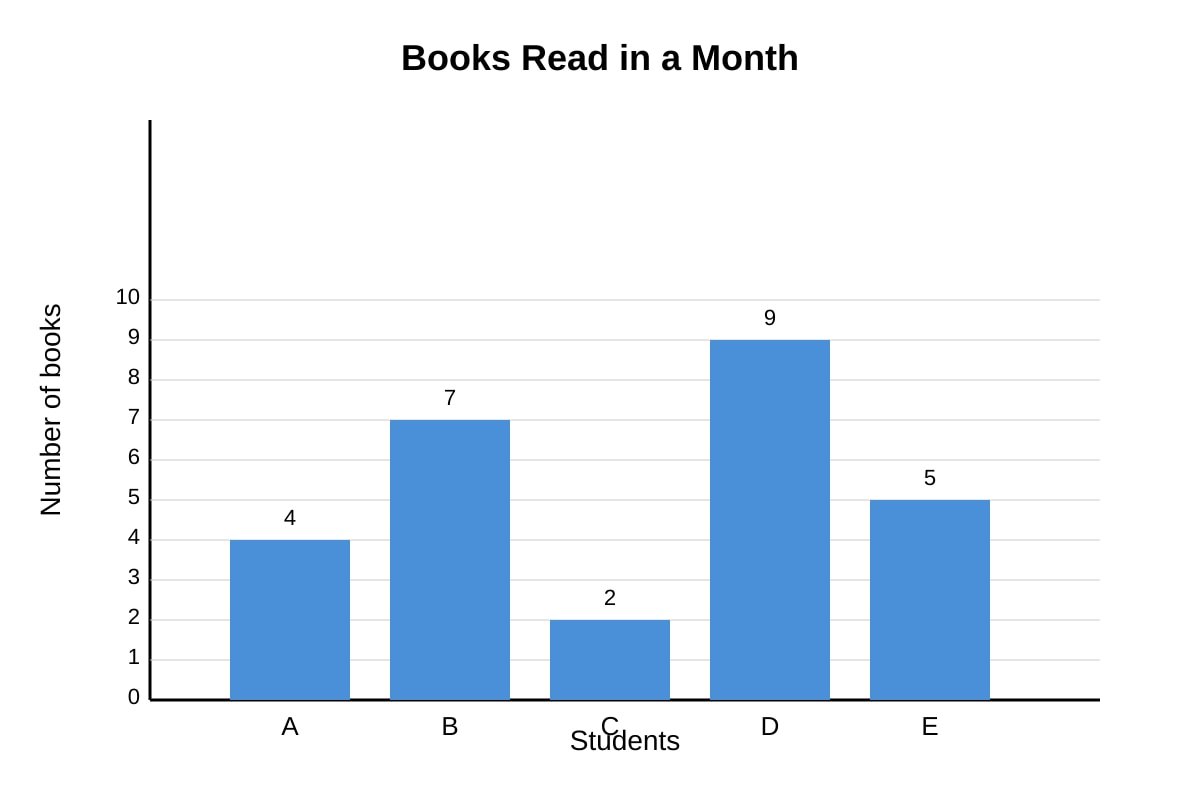
16. The bar graph below shows the number of books read by students in a month.
Image pending generation: graph for Q16.
Find the median number of books read.
17. Events X and Y are independent with P(X)=0.5 and P(Y)=0.3.
Find P(X∩Y) and P(X∪Y).
18. A test has 20 questions. A student got 14 correct.
(a) Find the probability that a randomly selected question from the test was answered correctly.
(b) If another student attempted the same test and got 75% correct, how many did she get right?
(a) ___________________________
(b) ___________________________
19. The table shows the heights (cm) of 7 plants: 12, 15, 10, 18, 15, 14, 16.
(a) Find the mode.
(b) Find the mean.
(c) Find the probability that a randomly selected plant has height more than 14 cm.
(a) ___________________________
(b) ___________________________
(c) ___________________________
20. A game uses a fair spinner with 3 equal sections: A, B, C. A player spins twice.
(a) Draw a tree diagram to show all outcomes.
(b) Find the probability of getting A at least once.
(c) Find the probability of getting two different letters.
(a) ___________________________
(b) ___________________________
(c) ___________________________
Answers
Secondary 4 Elementary Mathematics Quiz - Statistics Probability (Answer Key)
Total Marks: 40
Topic: Statistics & Probability
Section A (Q1–5, 1 mark each)
1. Answer: 85
Teaching note: Total balls = 5 + 3 = 8. Favourable = 5 red. P(red)=85.
Common mistake: Forgetting to simplify or using 5/3.
2. Answer: 21
Teaching note: Even numbers on a die: 2, 4, 6 → 3 outcomes of 6. P=63=21.
3. Answer: 40
Teaching note: Sum all cells: (8+10+4)+(6+5+7) = 22 + 18 = 40.
4. Answer: 0.7
Teaching note: Mutually exclusive → P(A∪B)=P(A)+P(B)=0.3+0.4=0.7.
5. Answer: 21
Teaching note: 2 blue out of 4 equal sections → 42=21.
Section B (Q6–12, 2 marks each)
6. Answer: 4
Working: n(B∪L)=18+15−7=26. Neither = 30 - 26 = 4.
Marking: 1 mark for union, 1 mark for neither.
7. Answer: 4.625 kg (or 485 kg)
Working: Sum = 2+5+3+7+5+4+6+5 = 37. Mean = 37÷8=4.625.
8. Answer: 5 kg
Working: Ordered: 2,3,4,5,5,5,6,7. Middle two = 5 and 5. Median = (5+5)/2=5.
9. Answer: Outcomes: HH, HT, TH, TT; Probability = 21
Working: 2 heads, 1 head, 1 head, 0 heads. Exactly one head = HT, TH → 2/4 = 1/2.
10. Answer: 40 students
Working: MRT angle = 120° out of 360°. Fraction = 120/360=1/3. 1/3×120=40.
Visual needed: Pie chart with MRT sector 120°.
11. Answer: 31
Working: First white = 6/10. Without replacement, second white = 5/9. P=106×95=9030=31.
12. Answer: 19
Working: Scores: 23,25,28,31,34,34,39,40,42. Max = 42, min = 23. Range = 42 - 23 = 19.
Section C (Q13–20, 3 marks each)
13.
(a) Venn: Two overlapping circles M and S in rectangle ξ=50. M only=10, S only=15, both=10, outside=15.
(b) P(M only)=10/50=1/5.
(c) P(neither)=15/50=3/10.
Marking: (a) 1 mark diagram, (b) 1 mark, (c) 1 mark.
14. Answer: 60 km/h
Working: ∑fx=50×1+55×2+60×3+65×3+70×1=50+110+180+195+70=605. Mean = 605÷10=60.5 → round to 60.5? Actually exact = 60.5. State 60.5 km/h.
Correction: Mean = 60.5 km/h.
15. Answer: 41
Working: Total = 10. Green = 5. With replacement: 5/10×5/10=25/100=1/4.
16. Answer: 5 books
Working: Values: 2,4,5,7,9. Median (middle) = 5.
Visual needed: Bars A=4,B=7,C=2,D=9,E=5.
17. Answer: P(X∩Y)=0.15, P(X∪Y)=0.65
Working: Independent → P(X∩Y)=0.5×0.3=0.15. P(X∪Y)=0.5+0.3−0.15=0.65.
18.
(a) 14/20=7/10.
(b) 75%×20=15.
Marking: (a) 1 mark, (b) 1 mark, context 1 mark.
19.
(a) Mode = 15 cm (appears twice).
(b) Mean = (12+15+10+18+15+14+16)/7 = 100/7 ≈ 14.3 cm.
(c) >14 cm: 15,18,15,16 = 4 of 7 → 4/7.
Marking: 1 each.
20.
(a) Tree: Root → A,B,C each prob 1/3; each branches to A,B,C.
(b) At least one A: total 9 outcomes, no A = 4 (BB,BC,CB,CC) → 5/9.
(c) Different: AA,BB,CC are same (3); different = 6/9 = 2/3.
Marking: (a) 1, (b) 1, (c) 1.
Free quiz and exam paper access
Enter your details to view this paper
Your access is remembered on this device.