Secondary 4 Additional Mathematics Statistics Probability Quiz
Free Sec 4 A Maths Statistics quiz, Kimi2.6 Exam version, with questions, answers, and O Level-style practice for Singapore students.
These static practice materials are generated from the site's syllabus and paper-generation workflow, with source and model context shown so students and parents can evaluate the material before use.
Secondary 4Additional MathematicsFrom Real ExamsGenerated by Kimi K2.6 FreeUpdated 2026-07-10
Duration: 40 minutes Total Marks: 40 marks Instructions: Answer all questions. Show all working clearly. Non-exact numerical answers should be given correct to 3 significant figures, or 1 decimal place in the case of angles in degrees, unless a different level of accuracy is specified.
Section A: Standard Questions [1 – 10] (20 marks)
Answer all questions. Each question carries 2 marks.
1.
A bag contains 5 red marbles, 7 blue marbles, and 3 green marbles. One marble is drawn at random from the bag. Find the probability that the marble drawn is
(a) red,
(b) not blue.
Working space:
[2 marks]
2.
The probability that a student passes Mathematics is 43, and the probability that the student passes Science is 32. Assuming the two events are independent, find the probability that the student
(a) passes both subjects,
(b) fails at least one subject.
Working space:
[2 marks]
3.
A fair six-sided die is rolled twice. Find the probability that
(a) the sum of the two scores is 7,
(b) the first score is greater than the second score.
Working space:
[2 marks]
4.
In a group of 80 students, 45 study Physics, 30 study Chemistry, and 15 study both Physics and Chemistry. A student is selected at random from the group. Find the probability that the student studies
(a) Physics or Chemistry or both,
(b) neither Physics nor Chemistry.
Working space:
[2 marks]
5.
The events A and B are such that P(A)=0.4, P(B)=0.5, and P(A∪B)=0.7.
(a) Find P(A∩B).
(b) State, with a reason, whether events A and B are independent.
Working space:
[2 marks]
6.
A random variable X has probability distribution given by P(X=k)=15k for k=1,2,3,4,5.
Find
(a) P(X≤3),
(b) the expected value E(X).
Working space:
[2 marks]
7.
The heights of 200 plants are measured and grouped into the following frequency distribution:
Height (h cm)
140≤h<150
150≤h<160
160≤h<170
170≤h<180
180≤h<190
Frequency
24
56
64
44
12
(a) State the modal class.
(b) Estimate the mean height of the plants.
Working space:
[2 marks]
8.
For a set of 10 data values, the sum of the values is 250 and the sum of the squares of the values is 6,750.
Find
(a) the mean,
(b) the standard deviation.
Working space:
[2 marks]
9.
The discrete random variable X takes values −2,0,2,4 with probabilities 41,81,83,41 respectively.
(a) Find E(X).
(b) Find E(X2).
Working space:
[2 marks]
10.
A frequency distribution has mean xˉ=12 and standard deviation σ=3. Each value in the distribution is transformed using the formula y=2x+5.
Find
(a) the new mean,
(b) the new standard deviation.
Answer all questions. Each question carries 2 marks.
11.
Two cards are drawn without replacement from a standard pack of 52 playing cards. Find the probability that
(a) both cards are aces,
(b) the two cards are of different suits.
Working space:
[2 marks]
12.
In a factory, machines A, B, and C produce 30%, 50%, and 20% of the total output respectively. The percentages of defective items produced by machines A, B, and C are 2%, 3%, and 5% respectively. An item is selected at random from the total output.
(a) Find the probability that the item is defective.
(b) Given that the item is defective, find the probability that it was produced by machine B.
Working space:
[2 marks]
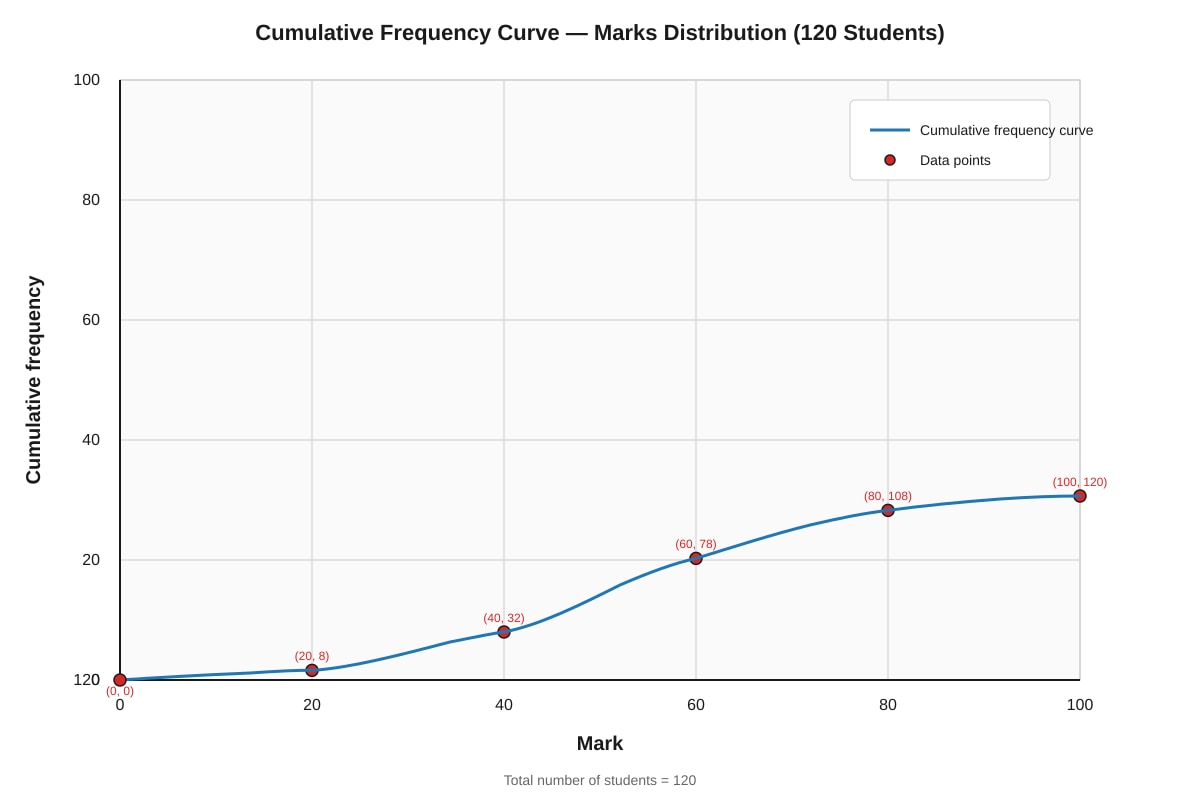
13.
The cumulative frequency curve below shows the distribution of marks scored by 120 students in a test.
Generated graph for Q13.
Use the curve to estimate
(a) the median mark,
(b) the interquartile range,
(c) the percentage of students who scored more than 70 marks.
Working space:
[2 marks]
14.
A discrete random variable X has the following probability distribution:
x
0
1
2
3
4
P(X=x)
0.1
p
0.3
q
0.2
Given that E(X)=2.2, find
(a) the values of p and q,
(b) Var(X).
Working space:
[2 marks]
15.
The masses of 500 apples are normally distributed with mean 150 g and standard deviation 20 g.
Find
(a) the number of apples with mass less than 130 g,
(b) the value of k such that 5% of apples have mass greater than k g.
Answer all questions. Each question carries 2 marks.
16.
A committee of 5 people is to be chosen from 6 men and 4 women. Find the number of ways the committee can be formed if
(a) there are no restrictions,
(b) there must be at least 2 women,
(c) there must be more men than women.
Working space:
[2 marks]
17.
The probability distribution of a discrete random variable X is given by
P(X=r)=kr(5−r)
for r=1,2,3,4.
(a) Show that k=101.
(b) Find P(1≤X<3).
(c) Find E(3X−2).
Working space:
[2 marks]
18.
In a class of 40 students, 18 study History, 15 study Geography, and 8 study neither History nor Geography.
(a) Find the probability that a randomly chosen student studies both History and Geography.
(b) Given that a student studies History, find the probability that the student also studies Geography.
Working space:
[2 marks]
19.
The random variable X is normally distributed with mean μ and standard deviation σ. Given that P(X<25)=0.0668 and P(X>35)=0.0228, find
(a) the values of μ and σ,
(b) P(28<X<40).
Working space:
[2 marks]
20.
A box contains 4 red balls and 6 blue balls. Two balls are drawn at random from the box, one after the other, without replacement.
(a) Show that the probability that the two balls are of the same colour is 157.
(b) If three balls are drawn without replacement, find the probability that exactly two of them are red.
Working space:
[2 marks]
END OF QUIZ
Free quiz and exam paper access
Enter your details to view this paper
Your access is remembered on this device.
Answers
Secondary 4 Additional Mathematics Quiz - Statistics Probability
Answer Key and Marking Scheme
Total Marks: 40 marks Duration: 40 minutes
Section A: Standard Questions [1 – 10]
Question 1 [2 marks]
(a)P(red)=5+7+35=155=31 [1 mark]
Teaching note: The probability of an event equals the number of favorable outcomes divided by the total number of equally likely outcomes. Here there are 15 marbles in total and 5 are red.
Common mistake: Forgetting that "not blue" includes both red and green marbles.
Question 2 [2 marks]
(a)P(both)=P(M)×P(S)=43×32=126=21 [1 mark]
Teaching note: For independent events, P(A∩B)=P(A)×P(B). The occurrence of one does not affect the other.
(b)P(fails at least one)=1−P(both pass)=1−21=21 [1 mark]
Alternative using complement: "At least one fail" is the complement of "both pass."
Common mistake: Trying to enumerate all cases (fail M pass S, pass M fail S, fail both) without using the complement rule, which is longer but also valid:
P(fail M)×P(pass S)+P(pass M)×P(fail S)+P(fail M)×P(fail S)=41×32+43×31+41×31=122+3+1=126=21
Question 3 [2 marks]
Sample space: 36 equally likely outcomes (1,1) to (6,6) when two dice are rolled.
(a) Sum equals 7: Favorable outcomes are (1,6),(2,5),(3,4),(4,3),(5,2),(6,1) — six outcomes. [0.5 mark for identifying correct pairs]
P(sum=7)=366=61 [0.5 mark]
(b) First score greater than second: Count outcomes where first > second:
First = 2: second = 1 (1 way)
First = 3: second = 1, 2 (2 ways)
First = 4: second = 1, 2, 3 (3 ways)
First = 5: second = 1, 2, 3, 4 (4 ways)
First = 6: second = 1, 2, 3, 4, 5 (5 ways)
Total: 1+2+3+4+5=15 outcomes [0.5 mark]
P(first>second)=3615=125 [0.5 mark]
Teaching note: By symmetry, P(first>second)=P(second>first), and P(equal)=366=61. So each of the first two probabilities equals 21(1−61)=125.
Question 4 [2 marks]
Using the principle of inclusion-exclusion:∣P∪C∣=∣P∣+∣C∣−∣P∩C∣=45+30−15=60 students study Physics or Chemistry or both. [0.5 mark for method]
(a)P(Physics or Chemistry)=8060=43 [0.5 mark]
(b)P(neither)=1−8060=8020=41 [1 mark]
Alternative for (b): Or count directly: 80−60=20 students study neither.
Teaching note: Venn diagrams help visualize this. The region "neither" is outside both circles.
Question 5 [2 marks]
(a) Using P(A∪B)=P(A)+P(B)−P(A∩B): [0.5 mark for formula]
0.7=0.4+0.5−P(A∩B)
P(A∩B)=0.9−0.7=0.2 [0.5 mark]
(b) For independence, check if P(A∩B)=P(A)×P(B) [0.5 mark for test]
P(A)×P(B)=0.4×0.5=0.2 [0.25 mark]
Since P(A∩B)=0.2=P(A)×P(B), events A and Bare independent. [0.25 mark]
(b)E(X)=∑x⋅P(X=x)=1×151+2×152+3×153+4×154+5×155 [0.5 mark for setting up]
=151+4+9+16+25=1555=311 or 332 or 3.67 (3 s.f.) [0.5 mark]
Teaching note: The expected value is the weighted average of all possible values, where weights are probabilities. It represents the long-run average if the experiment were repeated many times.
Question 7 [2 marks]
(a) Modal class is 160≤h<170 (highest frequency of 64) [1 mark]
(b) Using mid-values: 145, 155, 165, 175, 185 [0.5 mark for mid-values]
Estimated mean =20024×145+56×155+64×165+44×175+12×185 [0.25 mark for formula]
=2003480+8680+10560+7700+2220=20032640=163.2 cm [0.25 mark]
Teaching note: For grouped data, we use mid-values as estimates since we don't know exact values. This gives an estimate, not the exact mean.
Standard deviation =50=52≈7.07 (3 s.f.) [0.5 mark]
Teaching note: Standard deviation measures spread. The formula σ=n∑(x−xˉ)2 is equivalent to n∑x2−xˉ2 but the second is computationally easier when you have ∑x2 and ∑x.
Question 9 [2 marks]
(a)E(X)=(−2)×41+0×81+2×83+4×41 [0.5 mark]
=−21+0+43+1=4−2+0+3+4=45=1.25 or 141 [0.5 mark]
=4×41+0+4×83+16×41=1+0+1.5+4=6.5 or 213 [0.5 mark]
Teaching note:E(X2) is needed to find variance: Var(X)=E(X2)−[E(X)]2. Be careful: E(X2)=[E(X)]2.
Question 10 [2 marks]
Given transformation y=2x+5:
(a) New mean yˉ=2xˉ+5=2(12)+5=29 [1 mark]
(b) New standard deviation: Adding a constant (5) doesn't change spread, but multiplying by 2 scales spread by 2.
New standard deviation =2×3=6 [1 mark]
Teaching note: For y=ax+b: E(Y)=aE(X)+b and SD(Y)=∣a∣×SD(X). The shift b affects location (mean) but not spread (standard deviation). The scale factor a affects both.
Section B: Intermediate Questions [11 – 15]
Question 11 [2 marks]
(a)P(both aces)=524×513=265212=2211 [1 mark]
Teaching note: This uses the multiplication rule for dependent events. After drawing one ace, only 3 aces remain from 51 cards.
(b)P(different suits)=1−P(same suit) [0.25 mark for strategy]
P(same suit)=5252×5112=5112=174 (first card any suit, second must match) [0.5 mark]
P(different suits)=1−174=1713 [0.25 mark]
Alternative for (b): Direct count: 52×5152×39=5139=1713
Question 12 [2 marks]
Let D = "item is defective".
(a) Using law of total probability: [0.25 mark for method]
P(D)=P(D∣A)P(A)+P(D∣B)P(B)+P(D∣C)P(C)
=0.02×0.30+0.03×0.50+0.05×0.20 [0.25 mark]
=0.006+0.015+0.010=0.031 [0.5 mark]
(b) Using Bayes' theorem: P(B∣D)=P(D)P(D∣B)P(B) [0.25 mark for formula]
Teaching note: This is a classic Bayesian probability problem. Machine B produces the most output, so even with moderate defect rate, it contributes significantly to defective items.
Question 13 [2 marks]
Expected visual features for answer verification: The ogive passes through points (20, 8), (40, 32), (60, 78), (80, 108), (100, 120). Cumulative frequency ranges from 0 to 120.
(a) Median: 2120=60th value. From curve, estimate mark ≈ 58±2 (reading across from 60 on y-axis to curve, down to x-axis) [0.67 mark, accept 56-60]
(b) Lower quartile Q1: 30th value ≈ 42±2. Upper quartile Q3: 90th value ≈ 72±2. [0.33 mark for each, accept range]
IQR = Q3−Q1≈72−42=30±4 [0.33 mark]
(c) Students scoring > 70: Read cumulative frequency at mark = 70, approximately 95 students. [0.33 mark for method]
Students scoring more than 70 = 120−95=25 students [0.17 mark]
Percentage = 12025×100%≈20.8% or about 21% [0.17 mark, accept 15%-25%]
Teaching note: The interquartile range measures middle 50% spread. Reading from cumulative frequency curves requires careful estimation; small variations accepted due to graph reading.
Question 14 [2 marks]
(a) Using ∑P(X=x)=1: 0.1+p+0.3+q+0.2=1, so p+q=0.4 [0.25 mark]
Using E(X)=2.2:
0×0.1+1×p+2×0.3+3×q+4×0.2=2.2 [0.25 mark]
p+0.6+3q+0.8=2.2p+3q=0.8 [0.25 mark]
Solving: (p+3q)−(p+q)=0.8−0.4=0.4, so 2q=0.4, thus q=0.2 and p=0.2 [0.25 mark]