Secondary 3 Geography Quiz - Map Graph Data Skills
Name:
Class:
Date:
Score:
Duration: 45 minutes
Total Marks: 40
Instructions:
- This quiz tests your skills in reading and interpreting maps, graphs, and data tables for Geography.
- Answer all 20 questions.
- Section A: Map Reading (Q1–5)
- Section B: Graph Skills (Q6–12)
- Section C: Data Tables and Integration (Q13–20)
- Use the spaces provided. Show working where needed.
Section A: Map Reading (Questions 1–5)
1. On a topographic map, a contour line joining points of equal height is drawn at 10 m intervals. If point X is on the 40 m contour and point Y is on the 70 m contour, what is the contour interval difference between them? [1]
2. Study the map extract below.
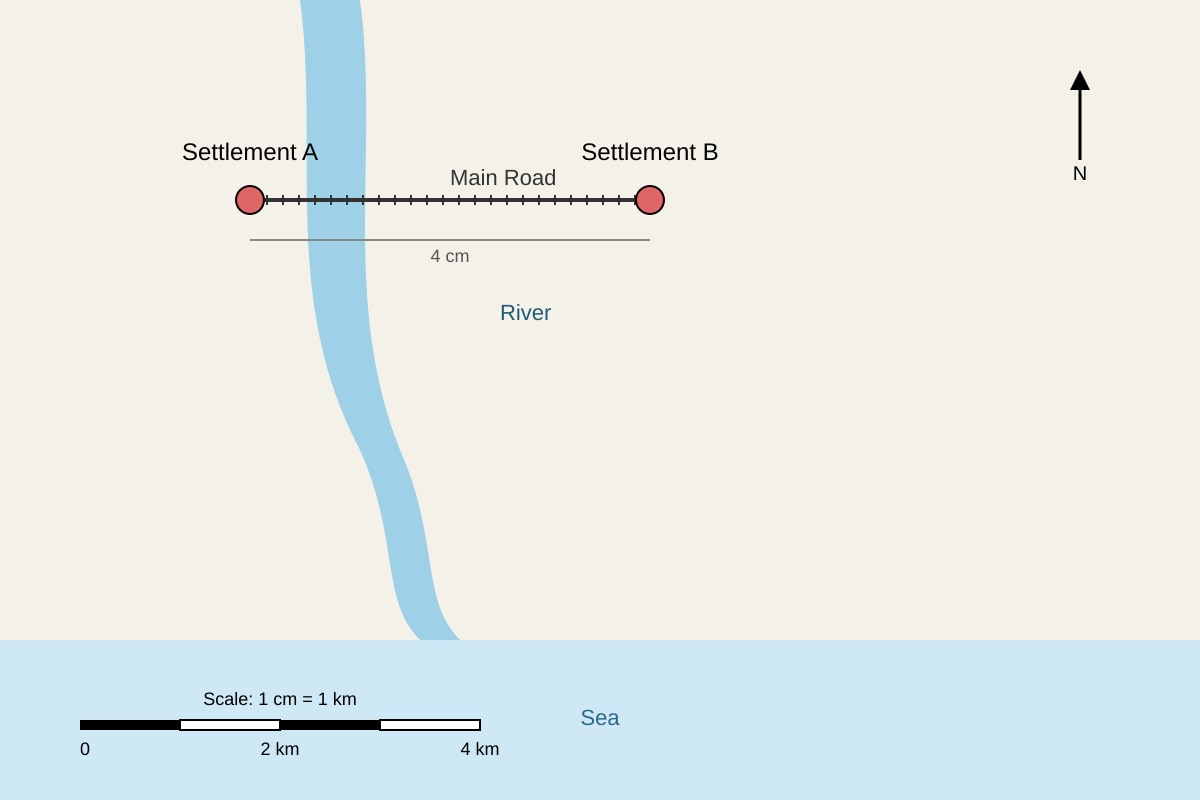
Generated map for Q2.
Using the scale bar, calculate the actual straight-line distance between Settlement A and Settlement B in kilometres. [2]
3. A grid reference 4821 means the point is in grid square easting 48 and northing 21. Give the four-figure grid reference for a school located at easting 53, northing 17. [1]
4. On the same map extract from Q2, the river flows towards the south. If a factory is built on the north bank of the river, in which direction is it from Settlement B which is south of the river? [1]
5. A map shows a steep slope using contour lines that are close together. Explain why closely spaced contours indicate a steep slope. [2]
Section B: Graph Skills (Questions 6–12)
6. The line graph shows monthly rainfall in Town P. The points are: Jan 120 mm, Feb 90 mm, Mar 60 mm, Apr 40 mm, May 30 mm. What is the total rainfall for the first five months? [2]
7. Study the bar chart below.
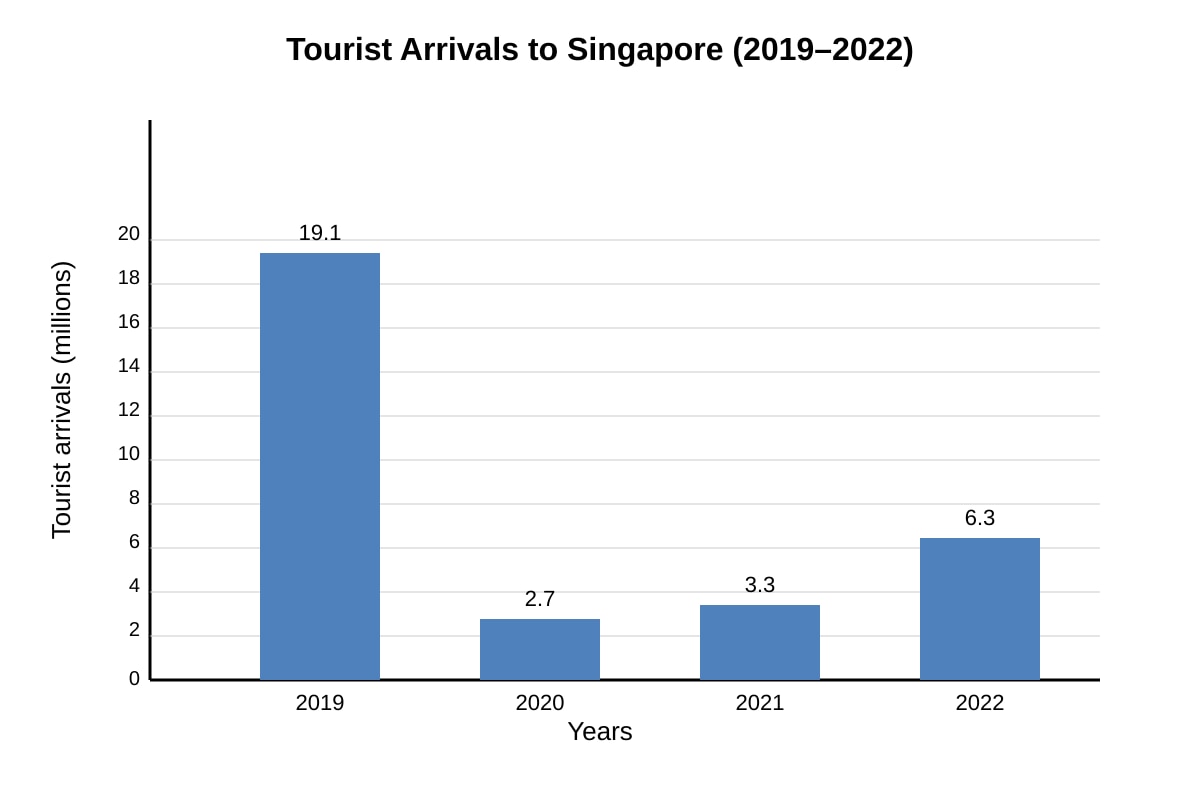
Generated bar_chart for Q7.
Which year had the lowest tourist arrivals? [1]
8. Using the bar chart in Q7, calculate the percentage decrease in arrivals from 2019 to 2020. Use formula: decrease % = (2019 – 2020) / 2019 × 100. [2]
9. A pie chart shows land use: Housing 40%, Industry 25%, Green space 20%, Others 15%. What angle (in degrees) represents Green space? [2]
10. The population pyramid below is described.
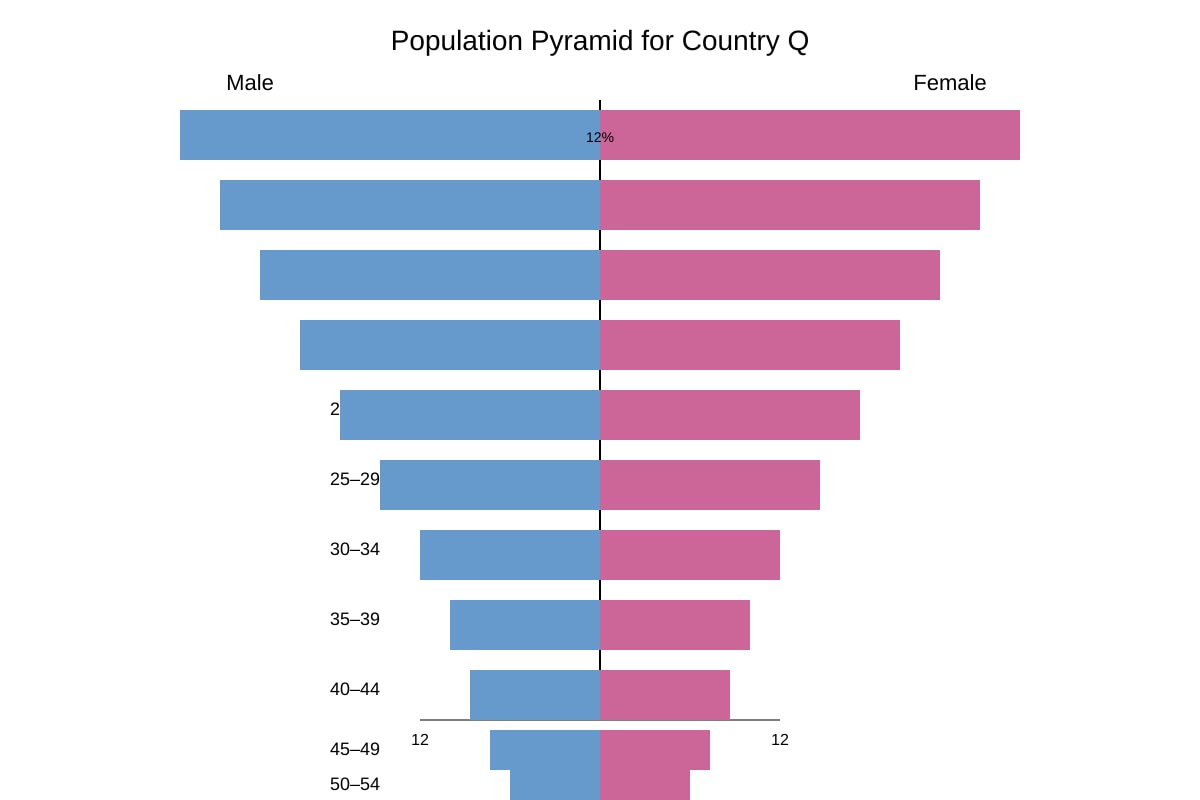
Generated graph for Q10.
State one feature of the population pyramid that suggests a young population. [1]
11. A climate graph has temperature line and rainfall bars. In Month X, temperature is 28°C and rainfall is 250 mm. Which element of the graph shows rainfall? [1]
12. The table below shows temperature over a day.
| Time | 08:00 | 12:00 | 16:00 | 20:00 |
|---|
| Temp (°C) | 26 | 31 | 30 | 27 |
Plot these points on a line graph (imagine or sketch) and state the time of maximum temperature. [2]
Section C: Data Tables and Integration (Questions 13–20)
13. Table: Rainfall (mm) in two towns.
| Town | Jan | Feb | Mar |
|---|
| A | 100 | 120 | 140 |
| B | 80 | 90 | 100 |
Which town has higher total rainfall over the three months? [1]
14. Using the table in Q13, calculate the mean rainfall for Town A across the three months. [2]
15. A field study sampled 50 students on transport to school: Bus 20, MRT 15, Walk 10, Car 5. What fraction walked to school? Simplify your answer. [2]
16. The map below shows a proposed park.
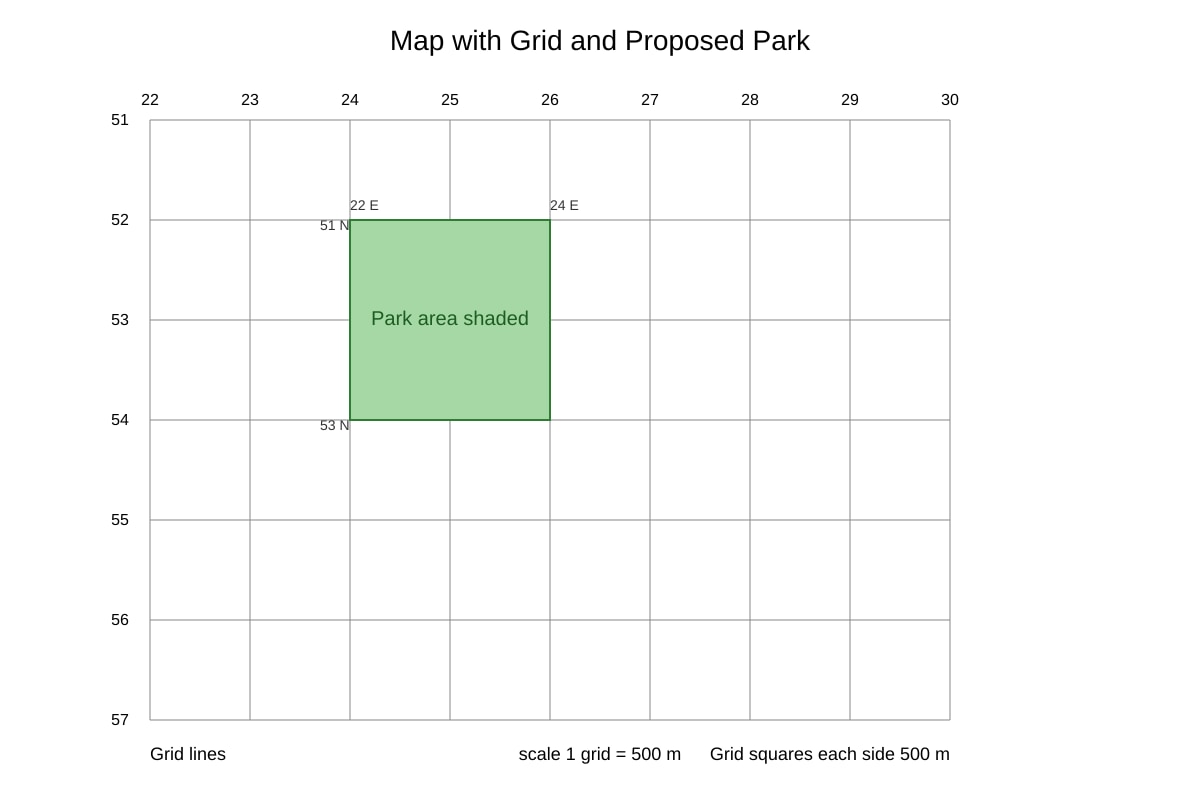
Generated map for Q16.
What is the approximate area of the proposed park in m²? [2]
17. A graph shows CO₂ emissions rising from 5 tonnes in 2000 to 9 tonnes in 2020. Describe the trend in one sentence. [1]
18. Using the data: Population 2000 = 4.0 million, 2020 = 5.6 million. Calculate the rate of increase per year (assume linear). Give answer in millions per year. [2]
19. A data table lists forest area (% of land) for 3 countries: X 10%, Y 45%, Z 30%. Which country likely has the highest provisioning ecosystem services from forests? Explain briefly. [2]
20. Combine map and graph skills: A map shows a river polluted near Factory Z. A line graph shows fish count dropping from 50 (year 2010) to 10 (year 2020) downstream. Suggest one reason for the drop using both sources. [2]
</stage5_quiz_answers_md>
<stage5_quiz_answers_md>
Secondary 3 Geography Quiz - Map Graph Data Skills (Answer Key)
Total Marks: 40
Level: Secondary 3
Topic: Map Graph Data Skills
Note: This is syllabus-first practice content. No past-year exam templates were available; questions are inferred from the Sec 3 Geography syllabus on geographical methods and data interpretation.
Section A: Map Reading
Q1. [1 mark]
Answer: 30 m
Teaching note: Contour interval difference = higher contour (70 m) – lower contour (40 m) = 30 m. Contour lines join equal heights; the difference between two contours is found by subtraction.
Q2. [2 marks]
Answer: 4 km
Working: Map distance = 4 cm. Scale: 1 cm = 1 km. Actual distance = 4 cm × 1 km/cm = 4 km.
Marking: 1 mark for correct use of scale, 1 mark for final answer.
Q3. [1 mark]
Answer: 5317
Teaching note: Four-figure grid reference is easting (53) then northing (17) → 5317.
Q4. [1 mark]
Answer: North
Teaching note: River flows south; factory on north bank is upstream/north of river. Settlement B is south of river, so factory is north of B.
Q5. [2 marks]
Answer: Closely spaced contours mean elevation changes quickly over a short horizontal distance, so slope is steep.
Marking: 1 mark for “elevation changes quickly / short distance”, 1 mark for linking to steep slope.
Section B: Graph Skills
Q6. [2 marks]
Answer: 340 mm
Working: 120 + 90 + 60 + 40 + 30 = 340 mm.
Marking: 1 mark for sum, 1 mark for unit.
Q7. [1 mark]
Answer: 2020
Teaching note: From bar chart values, 2020 = 2.7 million is lowest.
Q8. [2 marks]
Answer: 85.9% (or 86%)
Working: (19.1 – 2.7) / 19.1 × 100 = 16.4 / 19.1 × 100 ≈ 85.86% → 85.9%.
Marking: 1 mark for substitution, 1 mark for answer.
Q9. [2 marks]
Answer: 72°
Working: Green space % = 20%. Angle = 20% × 360° = 0.20 × 360 = 72°.
Marking: 1 mark method, 1 mark answer.
Q10. [1 mark]
Answer: Wide base (e.g., 12% in 0–4 age group) shows many young people.
Teaching note: Young population pyramids have a broad base.
Q11. [1 mark]
Answer: Rainfall bars
Teaching note: Climate graphs use bars for rainfall, line for temperature.
Q12. [2 marks]
Answer: 12:00
Working: Values: 08:00=26, 12:00=31, 16:00=30, 20:00=27. Max is 31 at 12:00.
Marking: 1 mark for correct plot/read, 1 mark for time.
Section C: Data Tables and Integration
Q13. [1 mark]
Answer: Town A
Working: A total = 100+120+140=360; B total = 80+90+100=270.
Q14. [2 marks]
Answer: 120 mm
Working: Mean = (100+120+140)/3 = 360/3 = 120 mm.
Marking: 1 mark for sum, 1 mark for division and unit.
Q15. [2 marks]
Answer: 1/5
Working: Walk = 10 out of 50 → 10/50 = 1/5.
Marking: 1 mark fraction, 1 mark simplified.
Q16. [2 marks]
Answer: 1,000,000 m² (or 1 km²)
Working: Park is 2 grids × 2 grids = 4 grid squares. Each grid = 500 m × 500 m = 250,000 m². Total = 4 × 250,000 = 1,000,000 m².
Marking: 1 mark area per grid, 1 mark total.
Q17. [1 mark]
Answer: CO₂ emissions increased steadily from 5 to 9 tonnes between 2000 and 2020.
Q18. [2 marks]
Answer: 0.08 million per year
Working: Increase = 5.6 – 4.0 = 1.6 million over 20 years. Rate = 1.6 / 20 = 0.08 million/year.
Marking: 1 mark total increase, 1 mark rate.
Q19. [2 marks]
Answer: Country Y (45%) – highest forest area gives more provisioning services (e.g., timber, food).
Marking: 1 mark country, 1 mark reason.
Q20. [2 marks]
Answer: Factory Z likely polluted river, reducing fish count downstream from 50 to 10.
Marking: 1 mark link map (pollution source), 1 mark link graph (fish decline).
</stage5_quiz_answers_md>
<stage5_quiz_md>
Secondary 3 Geography Quiz - Map Graph Data Skills
Name:
Class:
Date:
Score:
Duration: 45 minutes
Total Marks: 40
Instructions:
- This quiz tests your skills in reading and interpreting maps, graphs, and data tables for Geography.
- Answer all 20 questions.
- Section A: Map Reading (Q1–5)
- Section B: Graph Skills (Q6–12)
- Section C: Data Tables and Integration (Q13–20)
- Use the spaces provided. Show working where needed.
Section A: Map Reading (Questions 1–5)
1. On a topographic map, a contour line joining points of equal height is drawn at 10 m intervals. If point X is on the 40 m contour and point Y is on the 70 m contour, what is the contour interval difference between them? [1]
2. Study the map extract below.
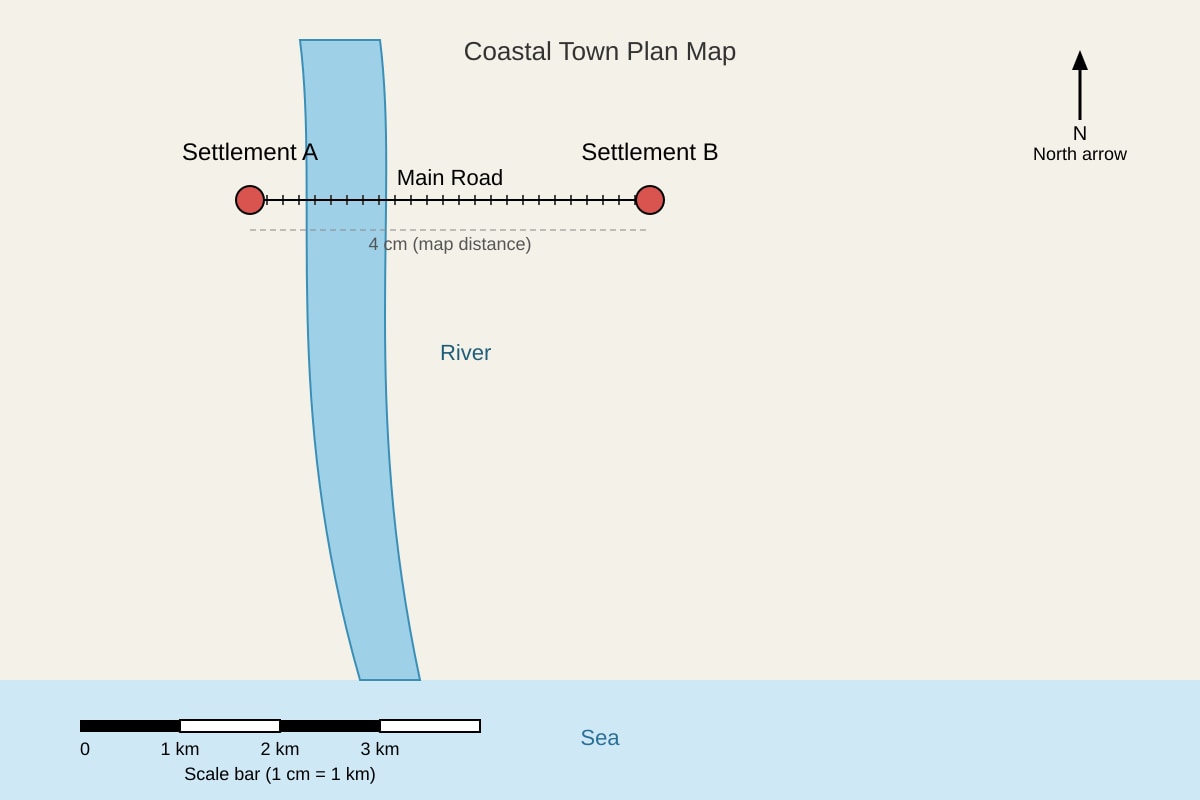
Generated map for Q2.
Using the scale bar, calculate the actual straight-line distance between Settlement A and Settlement B in kilometres. [2]
3. A grid reference 4821 means the point is in grid square easting 48 and northing 21. Give the four-figure grid reference for a school located at easting 53, northing 17. [1]
4. On the same map extract from Q2, the river flows towards the south. If a factory is built on the north bank of the river, in which direction is it from Settlement B which is south of the river? [1]
5. A map shows a steep slope using contour lines that are close together. Explain why closely spaced contours indicate a steep slope. [2]
Section B: Graph Skills (Questions 6–12)
6. The line graph shows monthly rainfall in Town P. The points are: Jan 120 mm, Feb 90 mm, Mar 60 mm, Apr 40 mm, May 30 mm. What is the total rainfall for the first five months? [2]
7. Study the bar chart below.
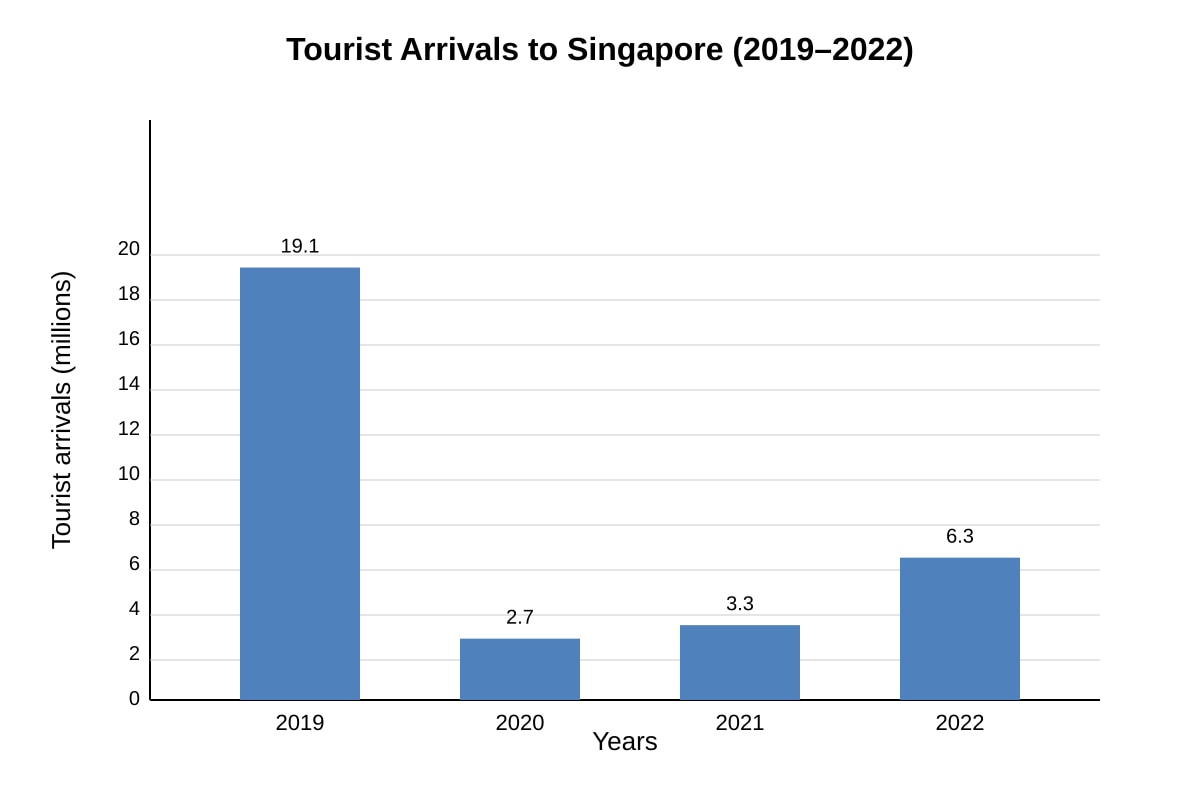
Generated bar_chart for Q7.
Which year had the lowest tourist arrivals? [1]
8. Using the bar chart in Q7, calculate the percentage decrease in arrivals from 2019 to 2020. Use formula: decrease % = (2019 – 2020) / 2019 × 100. [2]
9. A pie chart shows land use: Housing 40%, Industry 25%, Green space 20%, Others 15%. What angle (in degrees) represents Green space? [2]
10. The population pyramid below is described.
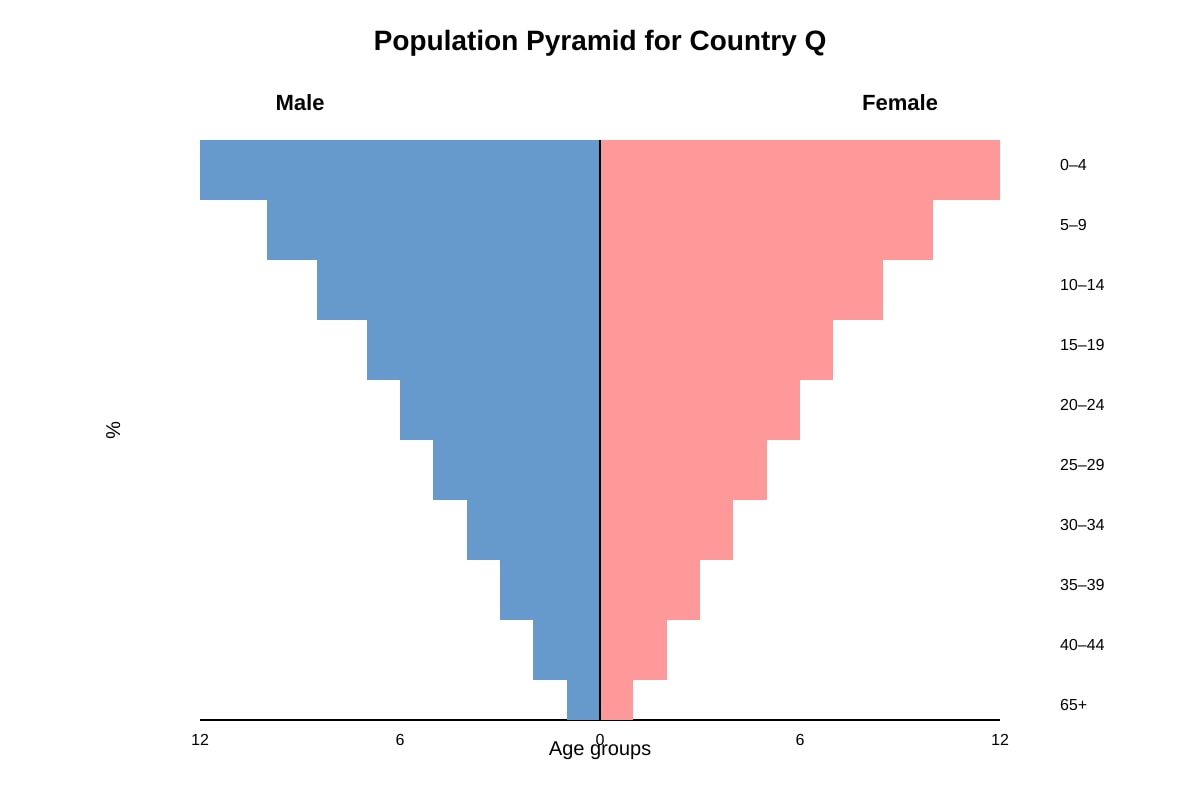
Generated graph for Q10.
State one feature of the population pyramid that suggests a young population. [1]
11. A climate graph has temperature line and rainfall bars. In Month X, temperature is 28°C and rainfall is 250 mm. Which element of the graph shows rainfall? [1]
12. The table below shows temperature over a day.
| Time | 08:00 | 12:00 | 16:00 | 20:00 |
|---|
| Temp (°C) | 26 | 31 | 30 | 27 |
Plot these points on a line graph (imagine or sketch) and state the time of maximum temperature. [2]
Section C: Data Tables and Integration (Questions 13–20)
13. Table: Rainfall (mm) in two towns.
| Town | Jan | Feb | Mar |
|---|
| A | 100 | 120 | 140 |
| B | 80 | 90 | 100 |
Which town has higher total rainfall over the three months? [1]
14. Using the table in Q13, calculate the mean rainfall for Town A across the three months. [2]
15. A field study sampled 50 students on transport to school: Bus 20, MRT 15, Walk 10, Car 5. What fraction walked to school? Simplify your answer. [2]
16. The map below shows a proposed park.
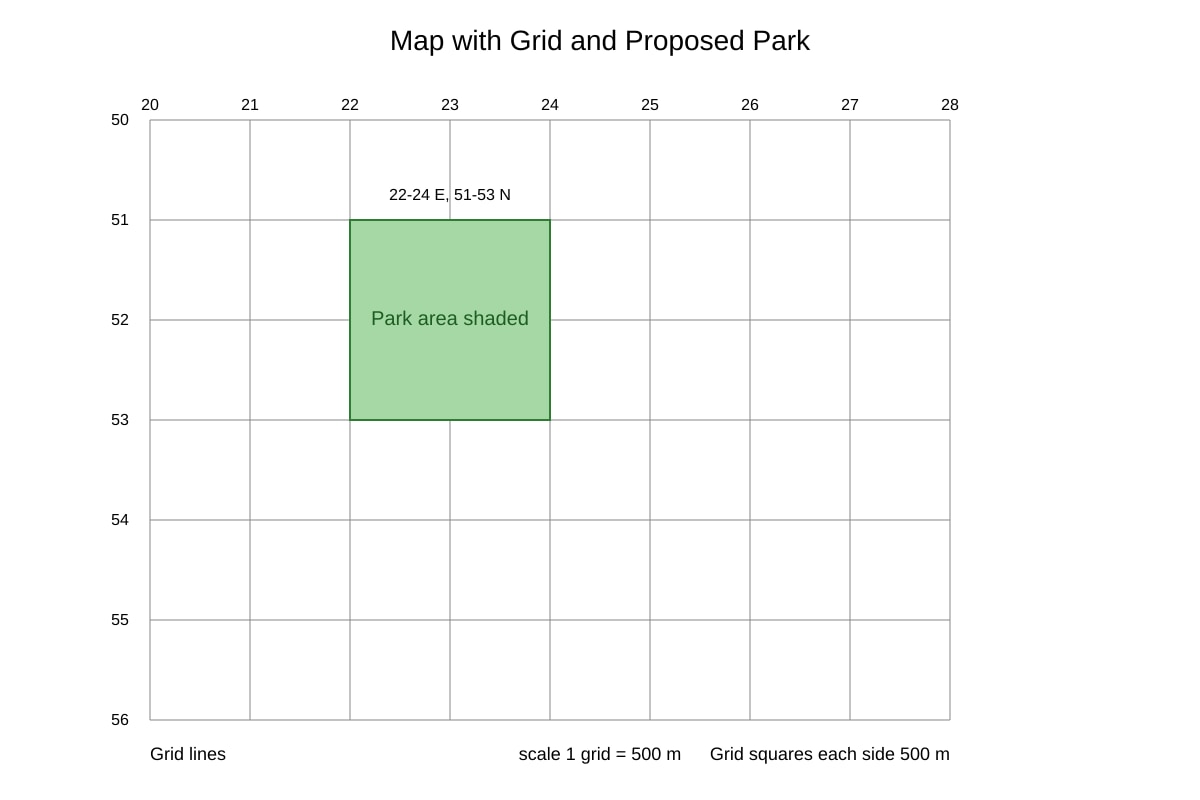
Generated map for Q16.
What is the approximate area of the proposed park in m²? [2]
17. A graph shows CO₂ emissions rising from 5 tonnes in 2000 to 9 tonnes in 2020. Describe the trend in one sentence. [1]
18. Using the data: Population 2000 = 4.0 million, 2020 = 5.6 million. Calculate the rate of increase per year (assume linear). Give answer in millions per year. [2]
19. A data table lists forest area (% of land) for 3 countries: X 10%, Y 45%, Z 30%. Which country likely has the highest provisioning ecosystem services from forests? Explain briefly. [2]
20. Combine map and graph skills: A map shows a river polluted near Factory Z. A line graph shows fish count dropping from 50 (year 2010) to 10 (year 2020) downstream. Suggest one reason for the drop using both sources. [2]