AI Generated Quiz
Secondary 3 Geography Fieldwork Quiz
Free Sec 3 Geography Fieldwork quiz, HY3 AI version, with questions, answers, and O Level-style practice for Singapore students.
These static practice materials are generated from the site's syllabus and paper-generation workflow, with source and model context shown so students and parents can evaluate the material before use.
Questions
Free quiz and exam paper access
Enter your details to view this paper
Your access is remembered on this device.
Answers
Secondary 3 Geography Quiz - Fieldwork: Answer Key
Total Marks: 40
Level: Secondary 3 | Topic: Fieldwork (syllabus-first practice, not exam-derived)
Section A: Answers (1 mark each)
-
To collect primary data and observe geographical phenomena in the real world.
Teaching note: Fieldwork connects classroom learning to actual places; it helps students test hypotheses. -
Survey responses / photographs / measured temperatures / observation notes. (any one)
Teaching note: Primary data are gathered first-hand by the student during the study. -
Interview / mental map / photograph with notes. (any one)
Teaching note: Qualitative data describe qualities and perceptions, not just numbers. -
A testable statement predicting a relationship between variables.
Teaching note: E.g., "Pedestrian count is higher near train stations." -
Random sampling.
Teaching note: Each person or site has equal chance; reduces bias. -
Median.
Teaching note: Order data, the middle value is median; mean is average, mode is most frequent. -
Mental map.
Teaching note: Mental maps show personal spatial perception, not exact scale. -
Wear bright clothing / stay on pavement / work in pairs. (any one)
Teaching note: Safety is part of fieldwork planning. -
To test methods / find errors before real data collection.
Teaching note: Pilot study improves reliability. -
Dividing population into groups then sampling from each group.
Teaching note: Strata are based on traits like housing type; improves representation.
Section B: Answers (2 marks each)
-
Convenience sampling selects whoever is easy to reach (1). Quota sampling sets amounts per group to match population (1).
Teaching note: Convenience is fast but biased; quota improves representativeness. -
Any two: bar chart, line graph, table, pie chart (1 each).
Teaching note: Visuals help compare counts across locations. -
Ask residents to rate attachment / list favourite places (1); use answers to map sense of place (1).
Teaching note: Questionnaires can capture emotional and social links to place. -
Any two: informed consent, anonymity, no harm, respect privacy (1 each).
Teaching note: Ethical fieldwork protects participants. -
Lay transect across both estates (1); count trees at intervals to compare (1).
Teaching note: Transect shows spatial pattern; data test hypothesis. -
Gives past context / saves time / compares with own readings (1); e.g., confirms heat trend (1).
Teaching note: Secondary data support primary findings.
Section C: Answers (3 marks each)
-
Mean = (120+85+140+40) ÷ 4 = 385 ÷ 4 = 96.25 (2 marks: 1 for sum, 1 for division). Busiest: 17:00–18:00 (140) (1 mark).
Teaching note: Mean is average; highest bar shows peak use. -
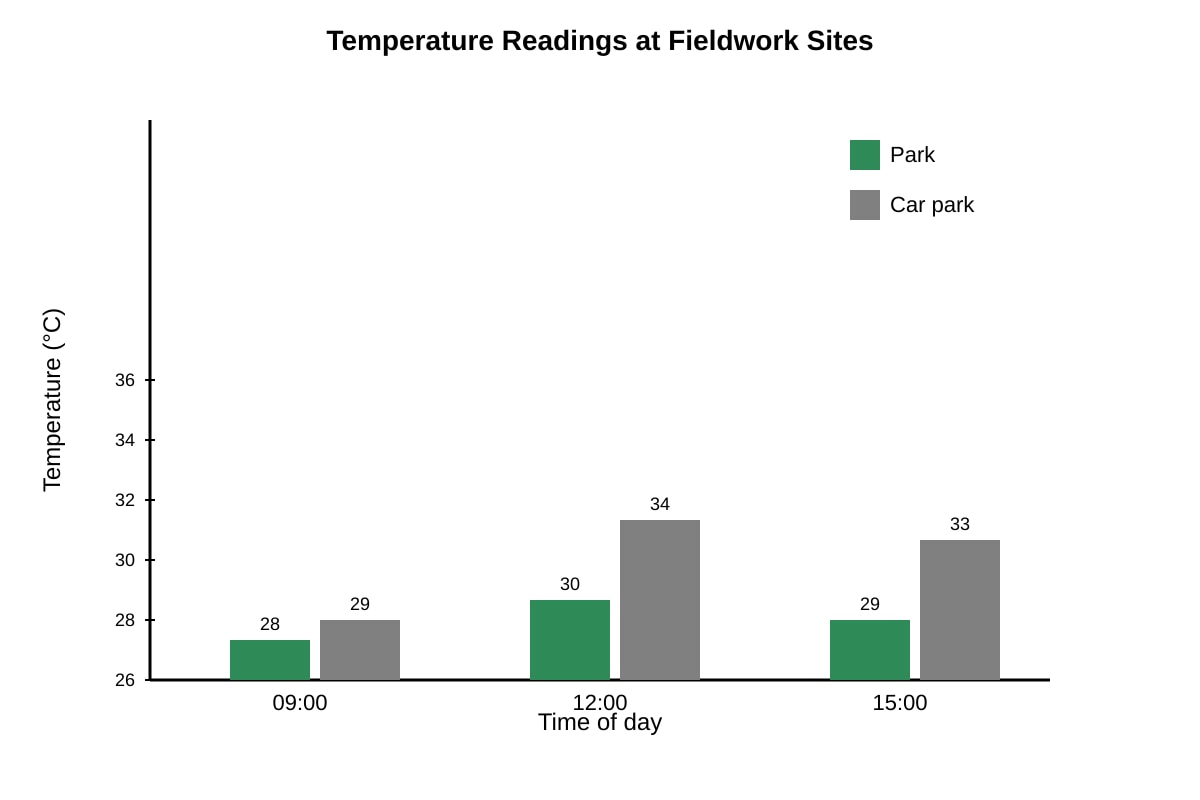
Difference at 12:00 = 34 − 30 = 4°C (2 marks: identify 34 and 30, 1; subtract, 1). Reason: car park has less vegetation and more heat-absorbing surfaces (1).
Teaching note: Graph shows urban heat; surfaces like asphalt raise temperature. -
Primary issue: small sample (50) may not represent all visitors (1). Secondary issue: no comparison site or time pattern for litter (1); account lacks method detail (1).
Teaching note: Good fieldwork needs clear sampling and controls. -
Map shows school is central to her daily life and mall is strongly linked (1). Limitation: mental maps are subjective, not to scale (1); may miss less familiar areas (1).
Teaching note: Sense of place is personal; maps vary by experience.