AI Generated Exam Paper
Secondary 3 Geography Practice Paper 5
Free Sec 3 Geography Practice Paper 5, HY3 AI version, with questions, answers, and O Level-style practice for Singapore students.
These static practice materials are generated from the site's syllabus and paper-generation workflow, with source and model context shown so students and parents can evaluate the material before use.
Questions
TuitionGoWhere Practice Paper - Geography Secondary 3
TuitionGoWhere Practice Paper (AI) — Version 5
Subject: Geography
Level: Secondary 3
Paper: Practice Paper (Map Graph Data Skills)
Duration: 45 minutes
Total Marks: 40
Name: ______________________
Class: _________
Date: ____________
Instructions:
- This practice paper tests map, graph, and data skills based on the Secondary 3 Geography syllabus.
- Answer all questions in the spaces provided.
- Section A: 10 short questions (1 mark each). Section B: 6 data-response questions (2 marks each). Section C: 4 applied questions (5 marks each).
- Use the extracted data and figures to support your answers.
Section A: Basic Map and Graph Reading (10 marks)
1. On a topographic map, a contour line joining points of equal height is used to show ______________. [1]
2. A bar graph shows the number of tourists visiting Sentosa from 2019 to 2023. The bar for 2021 is shortest. What does this show? [1]
3. In a line graph of temperature over a year, the x-axis usually represents ______________. [1]
4. A pie chart shows land use in a town: 40% housing, 25% green space, 20% industry, 15% transport. Which use has the smallest share? [1]
5. A map scale of 1:25 000 means 1 cm on the map equals ______________ m on the ground. [1]
6. A climate graph shows rainfall bars and temperature line. Which element is shown by bars? [1]
7. In a scatter diagram of rainfall against crop yield, points sloping up to the right show a ______________ correlation. [1]
8. A divided bar chart shows energy sources in Singapore. If natural gas takes 95%, the chart is dominated by one ______________. [1]
9. Grid reference 4826 means the point is in easting 48 and northing ______________. [1]
10. A histogram of household sizes has most bars between 3 and 4 people. This suggests the ______________ household size is about 3–4. [1]
Section B: Data Interpretation (12 marks)
11. Study the table below showing average monthly rainfall (mm) for Town X.
| Month | Jan | Feb | Mar | Apr | May | Jun |
|---|---|---|---|---|---|---|
| Rain | 80 | 70 | 90 | 120 | 150 | 160 |
State the trend from January to June. [2]
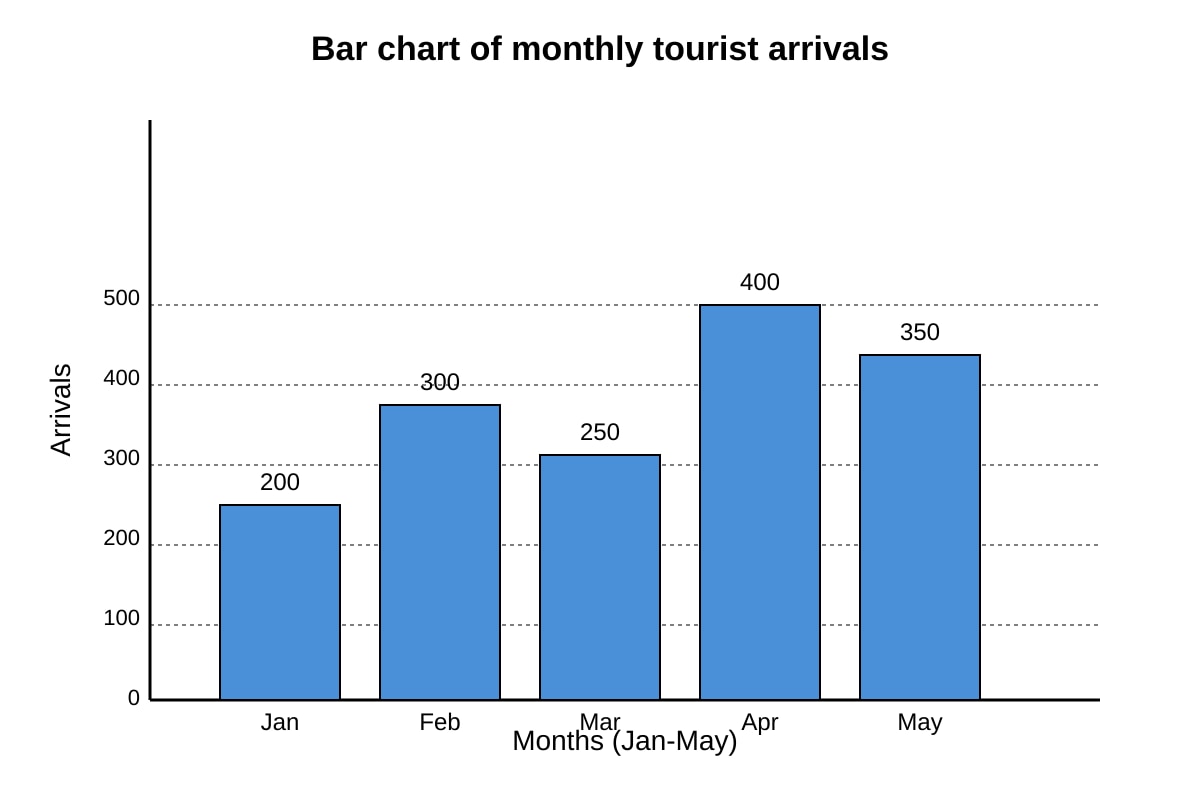
12. The bar chart (see figure) shows tourist arrivals to a resort: Jan 200, Feb 300, Mar 250, Apr 400, May 350.
Image pending generation: graph for Q12.
Calculate the mean monthly arrivals. [2]
13. A map extract shows a river flowing from north to south and a road running east-west crossing it. Describe the intersection feature using map evidence. [2]
14. The line graph shows temperature from 2010 to 2020 rising from 28°C to 30°C. What general change is shown? [2]
15. A pie chart shows: Housing 50%, Industry 20%, Green 20%, Other 10%. Compare housing with industry share. [2]
16. Study the scatter plot of distance from city centre (km) against rent ($/month): points show lower rent farther away. State the relationship. [2]
Section C: Applied Data Skills (18 marks)
17. A fieldwork study collected data on litter count per 100 m² at five parks:
| Park | A | B | C | D | E |
|---|---|---|---|---|---|
| Litter items | 12 | 8 | 15 | 5 | 10 |
(a) Draw a suitable graph to present this data. [1]
(b) Calculate the mean litter count. [2]
(c) Suggest one reason why Park C has the highest count. [2]
[5]
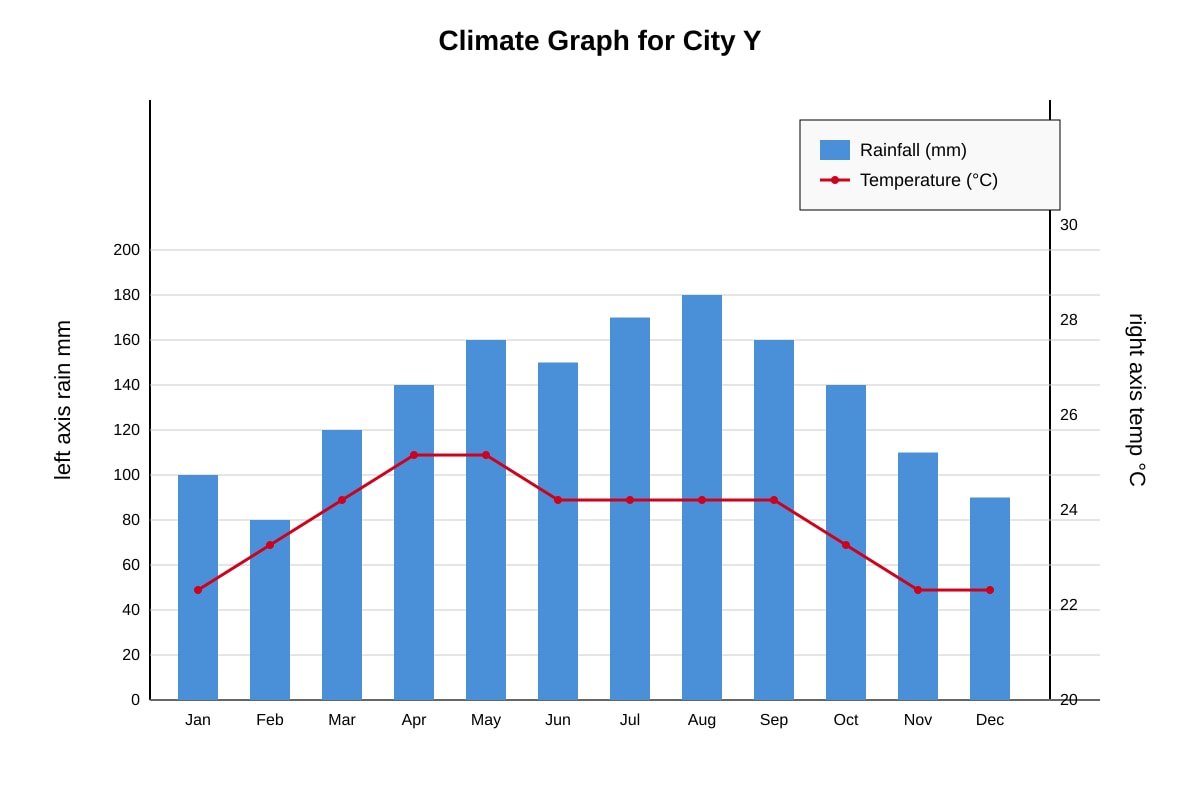
18. The climate graph for City Y is given.
Image pending generation: graph for Q18.
(a) Identify the wettest month. [1]
(b) State the temperature range. [1]
(c) Describe the climate type using evidence. [3]
[5]
19. A map of a neighbourhood shows: school at grid 34 21, market at 35 22, park at 33 20, MRT at 36 24.
(a) Give the grid reference of the market. [1]
(b) State the direction from school to MRT. [1]
(c) Explain how a resident might use this map for sustainable living. [3]
[5]
20. A divided bar chart shows energy use in a housing estate: Solar 10%, Grid 70%, Diesel 20%.
(a) Which source is most used? [1]
(b) Calculate the angle for solar in a pie chart. [2]
(c) Propose how the estate could improve environmental sustainability using the data. [2]
[5]
Answers
TuitionGoWhere Practice Paper Answer Key — Geography Secondary 3 (Version 5)
Total Marks: 40
Section A (10 marks)
-
height / elevation [1]
Teaching: Contour lines connect places of same height; they show relief on maps. -
Tourist numbers were lowest in 2021 [1]
Teaching: Shortest bar = smallest value; likely due to pandemic travel limits. -
time (months/years) [1]
Teaching: Line graphs of climate use x-axis for time, y-axis for value. -
transport (15%) [1]
Teaching: Compare percentages; 15% is smallest. -
250 [1]
Teaching: 1:25 000 → 1 cm = 25 000 cm = 250 m. -
rainfall [1]
Teaching: Climate graph convention: bars = rain, line = temperature. -
positive [1]
Teaching: Up-right pattern means both variables increase together. -
source / category [1]
Teaching: Divided bar shows parts of one total; one large part dominates. -
26 [1]
Teaching: Grid ref easting first, northing second: 48 26. -
modal / most common [1]
Teaching: Histogram peak shows mode.
Section B (12 marks)
-
[2] Trend: rainfall increases from Jan (80 mm) to Jun (160 mm).
Marking: 1 mark for increase, 1 mark for using values. -
[2] Mean = (200+300+250+400+350)/5 = 1500/5 = 300 arrivals.
Marking: 1 mark formula, 1 mark answer. -
[2] River crosses road at right angle / intersection; evidence: north-south river, east-west road.
Marking: 1 mark feature, 1 mark map evidence. -
[2] Temperature increased by 2°C over 10 years.
Marking: 1 mark rise, 1 mark value. -
[2] Housing (50%) is 2.5 times industry (20%) / larger by 30 percentage points.
Marking: 1 mark compare, 1 mark value. -
[2] Negative relationship: rent decreases as distance increases.
Marking: 1 mark direction, 1 mark variables.
Section C (18 marks)
-
[5]
(a) Bar graph [1]
(b) Mean = (12+8+15+5+10)/5 = 50/5 = 10 items [2]
(c) More users / less bins [2]
Marking descriptors: graph suitable 1; calc 2; reason valid 2. -
[5]
(a) Aug (180 mm) [1]
(b) Range = 29-26 = 3°C [1]
(c) Tropical: high rain all year, warm 26-29°C [3]
Marking: month 1, range 1, type+evidence 3. -
[5]
(a) 35 22 [1]
(b) NE (grid increase) [1]
(c) Use map to walk to market/park reduce car use [3]
Marking: ref 1, dir 1, sustain reason 3. -
[5]
(a) Grid 70% [1]
(b) Solar angle = 10% × 360° = 36° [2]
(c) Add solar panels, reduce diesel [2]
Marking: source 1, angle 2, proposal 2.
Caveat: No past-paper evidence; syllabus-first practice generated via LLM inference.
Free quiz and exam paper access
Enter your details to view this paper
Your access is remembered on this device.