AI Generated Exam Paper
Secondary 3 Geography Practice Paper 4
Free Sec 3 Geography Practice Paper 4, Kimi2.6 AI version, with questions, answers, and O Level-style practice for Singapore students.
These static practice materials are generated from the site's syllabus and paper-generation workflow, with source and model context shown so students and parents can evaluate the material before use.
Questions
TuitionGoWhere Practice Paper - Geography Secondary 3
TuitionGoWhere Practice Paper (AI)
| Subject: | Geography |
| Level: | Secondary 3 |
| Paper: | Practice Paper |
| Version: | 4 of 5 |
| Duration: | 1 hour 15 minutes |
| Total Marks: | 60 |
Name: _________________________________
Class: _________________________________
Date: _________________________________
INSTRUCTIONS TO CANDIDATES
- Write your name, class, and date in the spaces provided above.
- This paper consists of THREE sections: Section A, Section B, and Section C.
- Answer ALL questions.
- Write your answers in the spaces provided. If working is needed for any question, it must be shown in the space below that question.
- Omission of essential working will result in loss of marks.
- The number of marks is given in brackets [ ] at the end of each question or part question.
- You are expected to use geographical instruments (protractor, ruler, calculator) where appropriate.
SECTION A: Map Skills and Interpretation
[Total: 20 marks]
Answer ALL questions in this section.
1. Study the extract of a topographic map below. The map scale is 1:50,000.
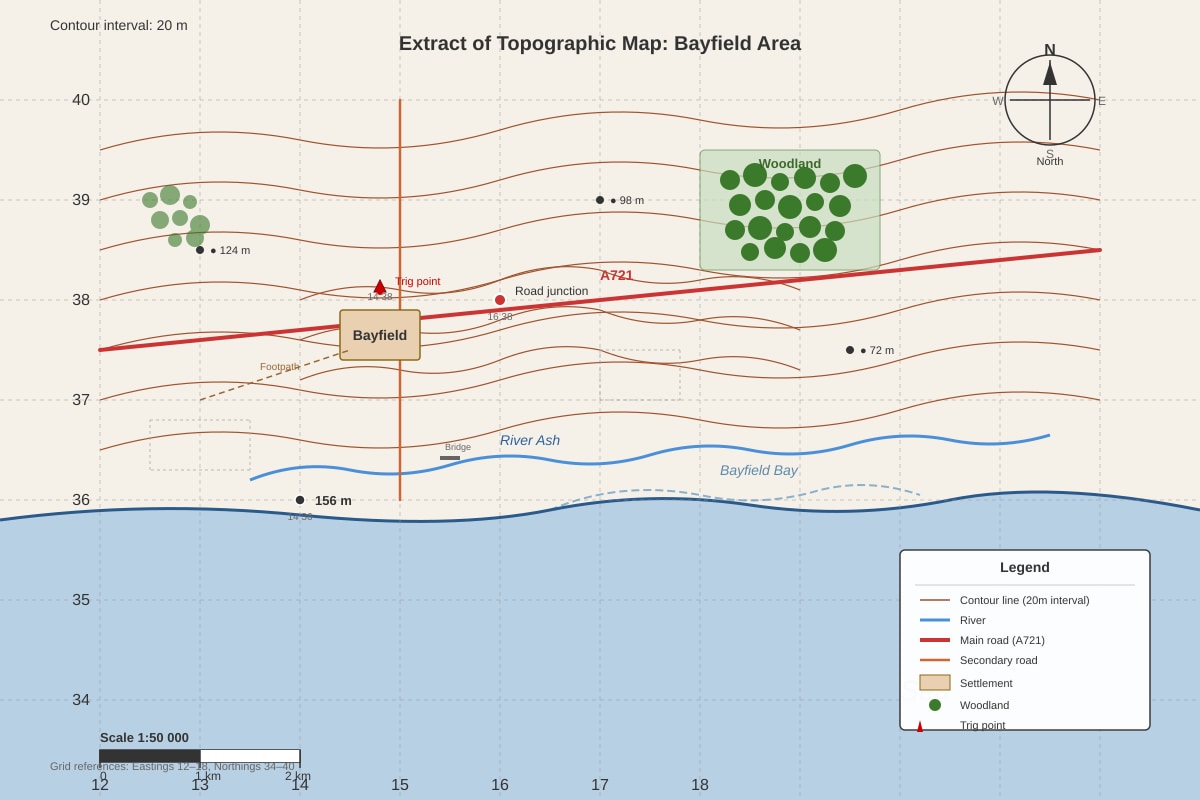
Generated map for Q1.
(a) What is the four-figure grid reference of the trig point located near the settlement of Bayfield? [1]
(b) Calculate the straight-line distance between the spot height 156 m (grid reference 14 36) and the road intersection at 16 38. Give your answer in kilometres. Show your working. [3]
(c) Describe the relief of the area shown in the map extract, using evidence from the map. [4]
2. Refer to the weather map below showing atmospheric conditions over Southeast Asia on 15 November 2023.
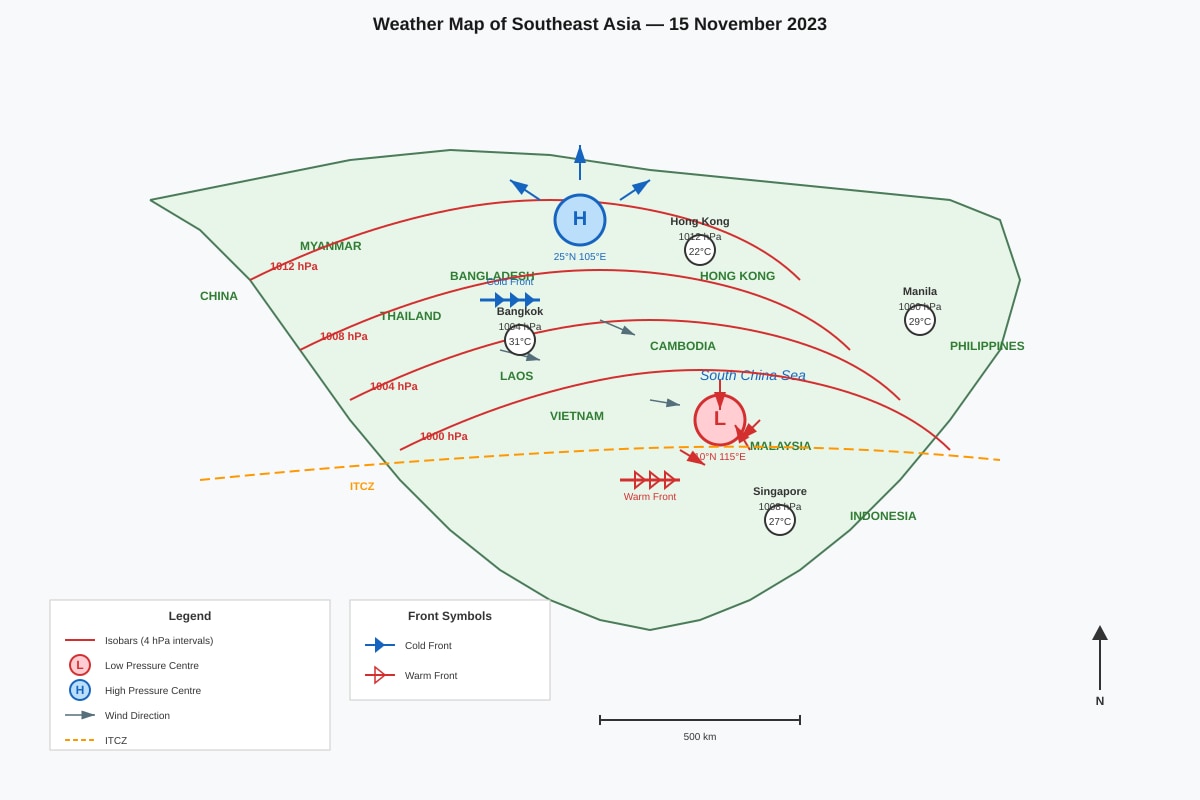
Generated map for Q2.
(a) Identify the pressure system located at approximately 10°N, 115°E. [1]
(b) Using evidence from the weather map, explain why Singapore (1°N, 104°E) is experiencing different weather conditions from Hong Kong (22°N, 114°E) on this date. [4]
(c) Describe the wind direction and strength at Bangkok (13°N, 100°E). Support your answer with evidence from the map. [2]
3. The map below shows population density in Southeast Asia by country.
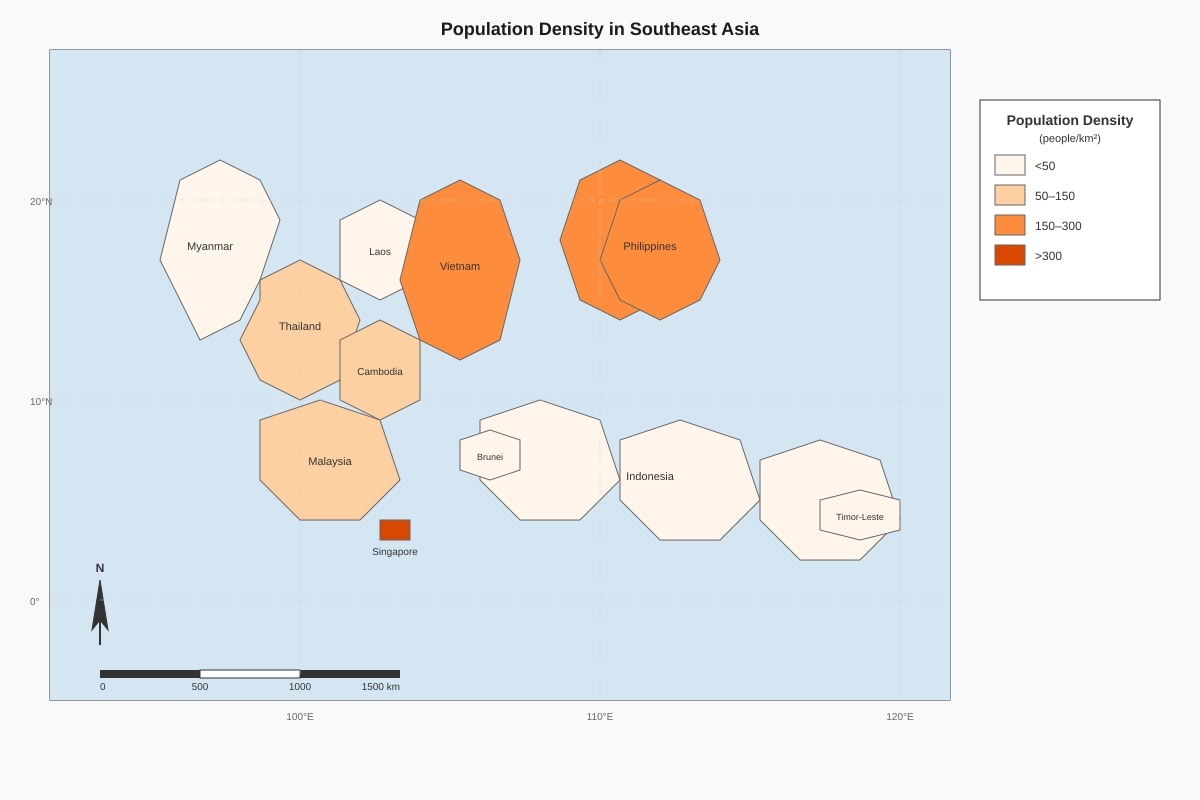
Generated map for Q3.
(a) State one limitation of using a choropleth map to show population density. [1]
(b) Suggest why Singapore has the highest population density in Southeast Asia despite its small land area. Refer to three push or pull factors in your answer. [3]
SECTION B: Graphical and Data Skills
[Total: 24 marks]
Answer ALL questions in this section.
4. The climate graph below shows temperature and rainfall data for Station X, located at 15°S, 130°E.
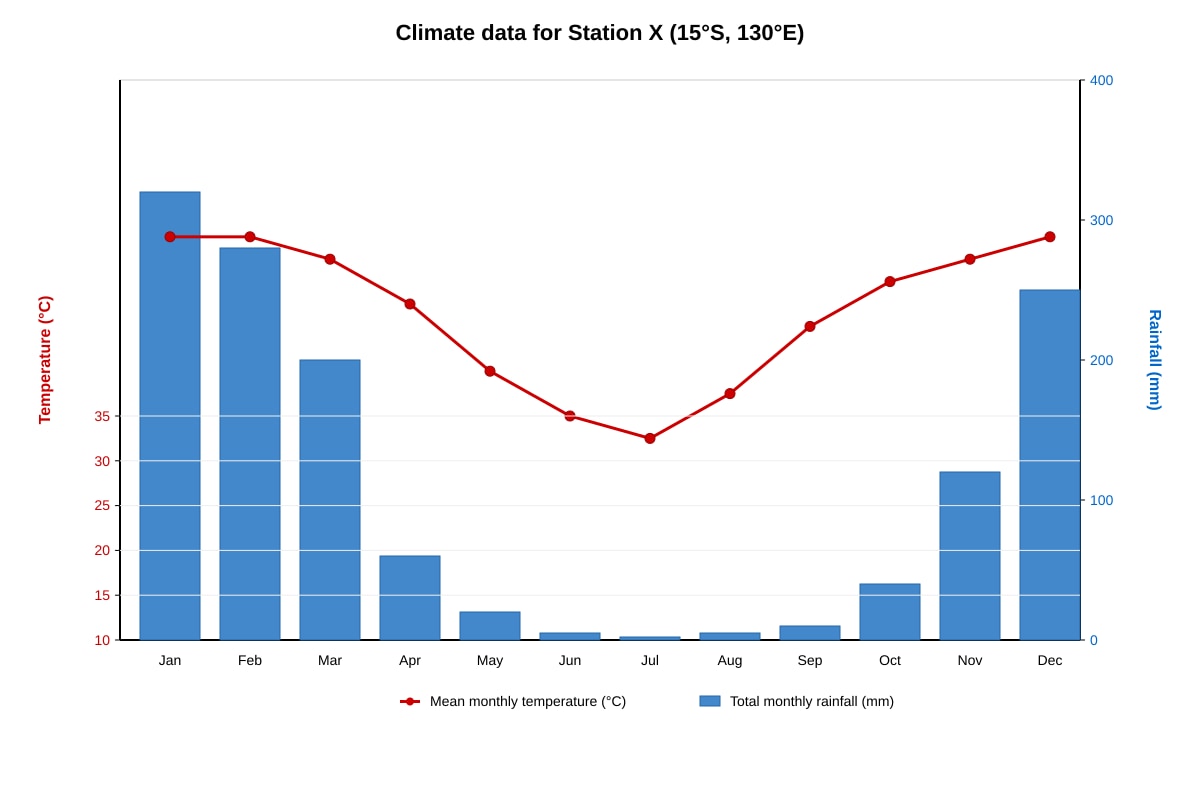
Generated graph for Q4.
(a) Identify the month with the highest mean monthly temperature. [1]
(b) Calculate the total annual rainfall for Station X. Show your working. [2]
(c) Describe the annual temperature pattern shown in the climate graph. [2]
(d) The climate at Station X can be described as having a distinct wet season and dry season. With reference to data from the graph, determine which months form the dry season and explain your reasoning. [3]
(e) Suggest one human activity that might be affected by the dry season at this location, and explain how the climate data supports your answer. [2]
5. Study the population pyramid for Country Y in 2023 below.
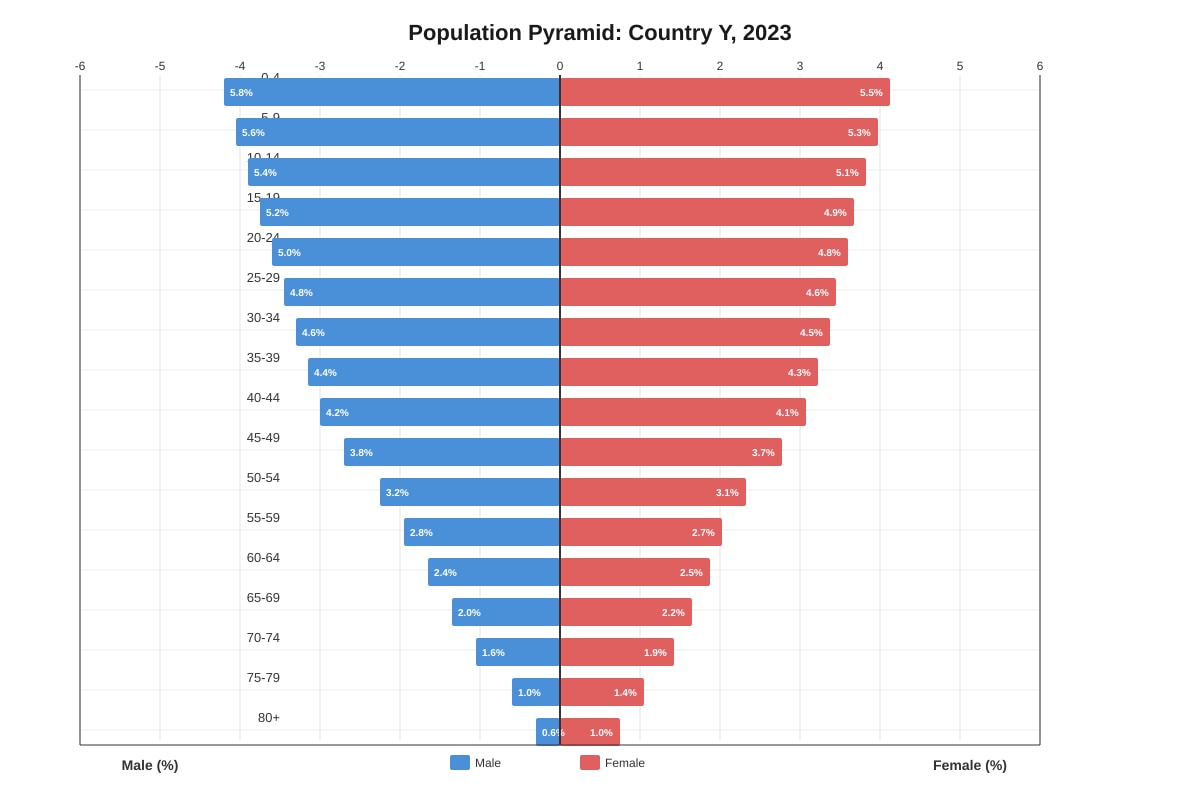
Generated graph for Q5.
(a) Calculate the percentage of the population aged 65 and above in Country Y. Show your working. [2]
(b) Describe two features of Country Y's population structure that suggest it is an ageing population. [2]
(c) The government of Country Y is considering two policies to address its ageing population:
- Policy A: Increase the retirement age from 65 to 68 years
- Policy B: Provide cash incentives for couples to have more children
Evaluate which policy is likely to be more effective in addressing the economic challenges of an ageing population. Give reasons for your answer. [4]
6. The table below shows data on tourists arriving in Singapore from selected source regions in 2022 and 2023.
| Source Region | 2022 ('000 arrivals) | 2023 ('000 arrivals) |
|---|---|---|
| Southeast Asia | 2,856 | 4,125 |
| Northeast Asia | 245 | 1,890 |
| South Asia | 768 | 1,102 |
| Europe | 312 | 678 |
| Oceania | 156 | 398 |
| North America | 89 | 245 |
| Total | 4,426 | 8,438 |
(a) Calculate the percentage change in total tourist arrivals from 2022 to 2023. Give your answer to one decimal place. Show your working. [2]
(b) Identify the source region with the largest absolute increase in tourist arrivals between 2022 and 2023. [1]
(c) Suggest two possible reasons for the overall increase in tourist arrivals to Singapore from 2022 to 2023. [2]
7. The scatter graph below shows the relationship between GDP per capita (US$) and life expectancy (years) for selected countries in 2023.
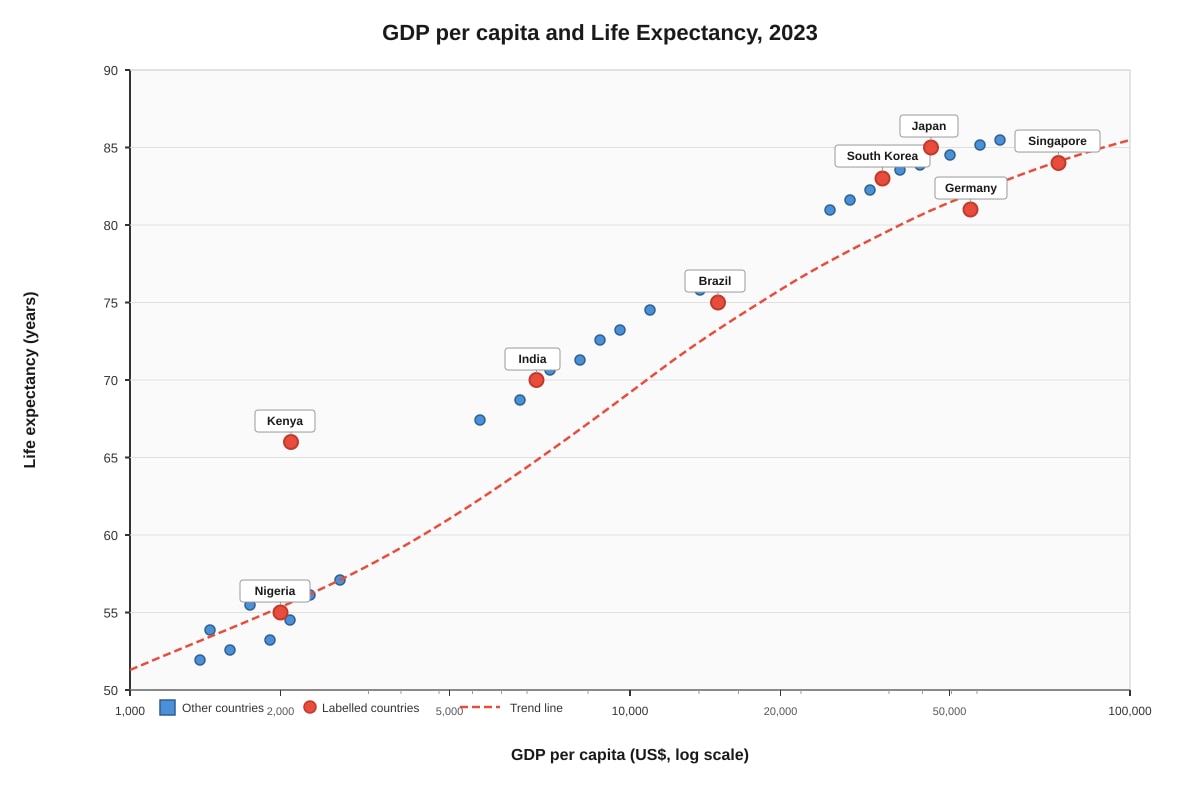
Generated graph for Q7.
(a) Describe the relationship shown between GDP per capita and life expectancy. [2]
(b) Singapore has a higher GDP per capita than Japan but slightly lower life expectancy. Suggest one reason why higher national wealth does not always translate to the highest life expectancy. [2]
(c) Explain why a scatter graph is more appropriate than a line graph for showing this data. [2]
SECTION C: Data Response and Synthesis
[Total: 16 marks]
Answer ALL questions in this section.
8. Read the following passage and study the data provided.
Singapore faces significant challenges in ensuring long-term water security. With limited land area and no natural water catchments in neighbouring countries, the city-state has developed a diversified water supply strategy known as the "Four National Taps." The graphs below show rainfall variability and water demand projections.
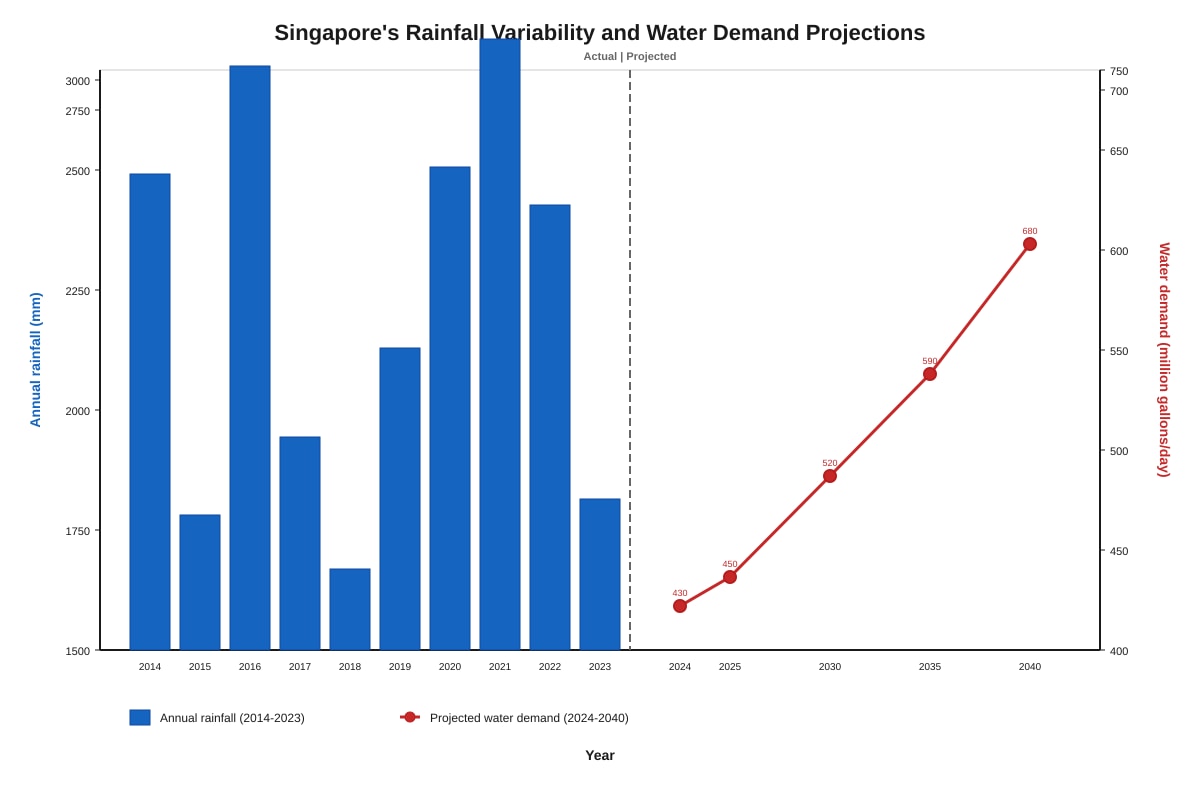
Generated graph for Q8.
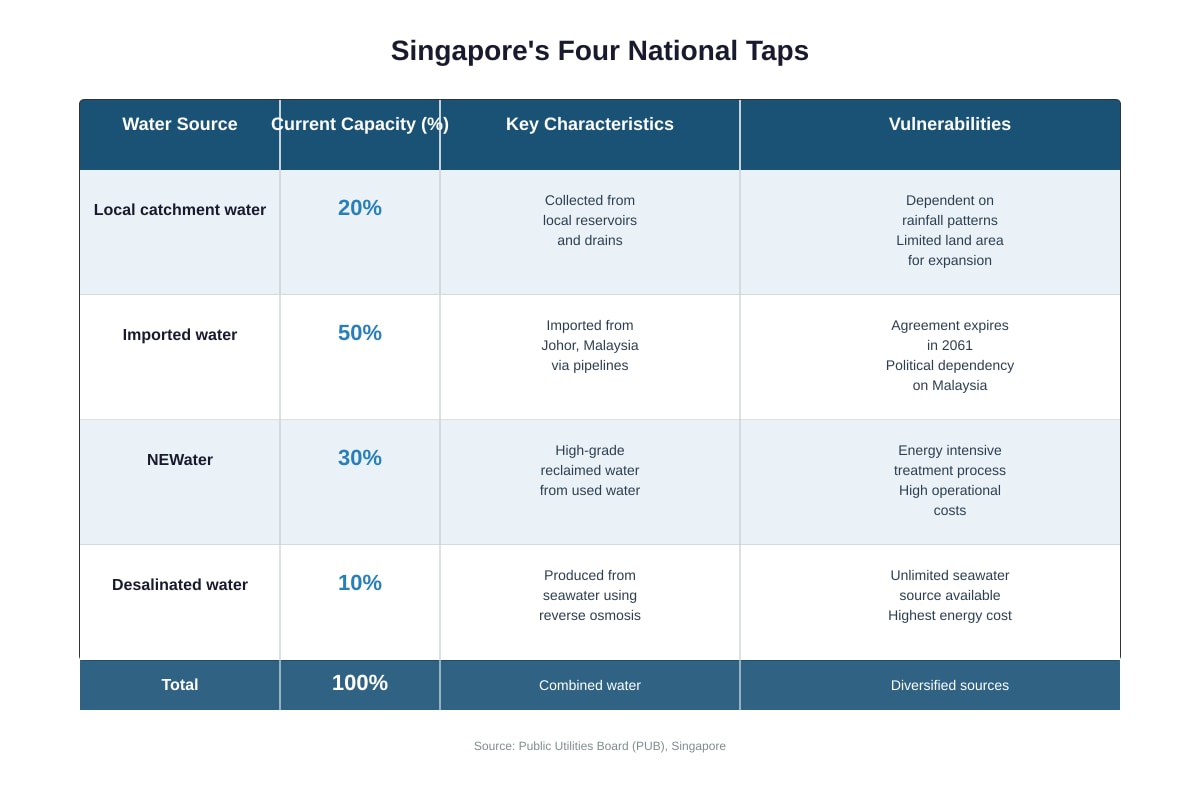
Generated table for Q8.
(a) Describe the trend in Singapore's annual rainfall between 2014 and 2023. Use data to support your answer. [3]
(b) Using information from both the graph and the table, explain why NEWater and desalinated water are important for Singapore's future water security. [4]
(c) Evaluate the extent to which diversifying water sources reduces Singapore's vulnerability to water insecurity. In your answer, consider both the strengths and limitations of the Four National Taps strategy. [5]
9. The photograph below shows a coastal management structure at East Coast Park, Singapore.
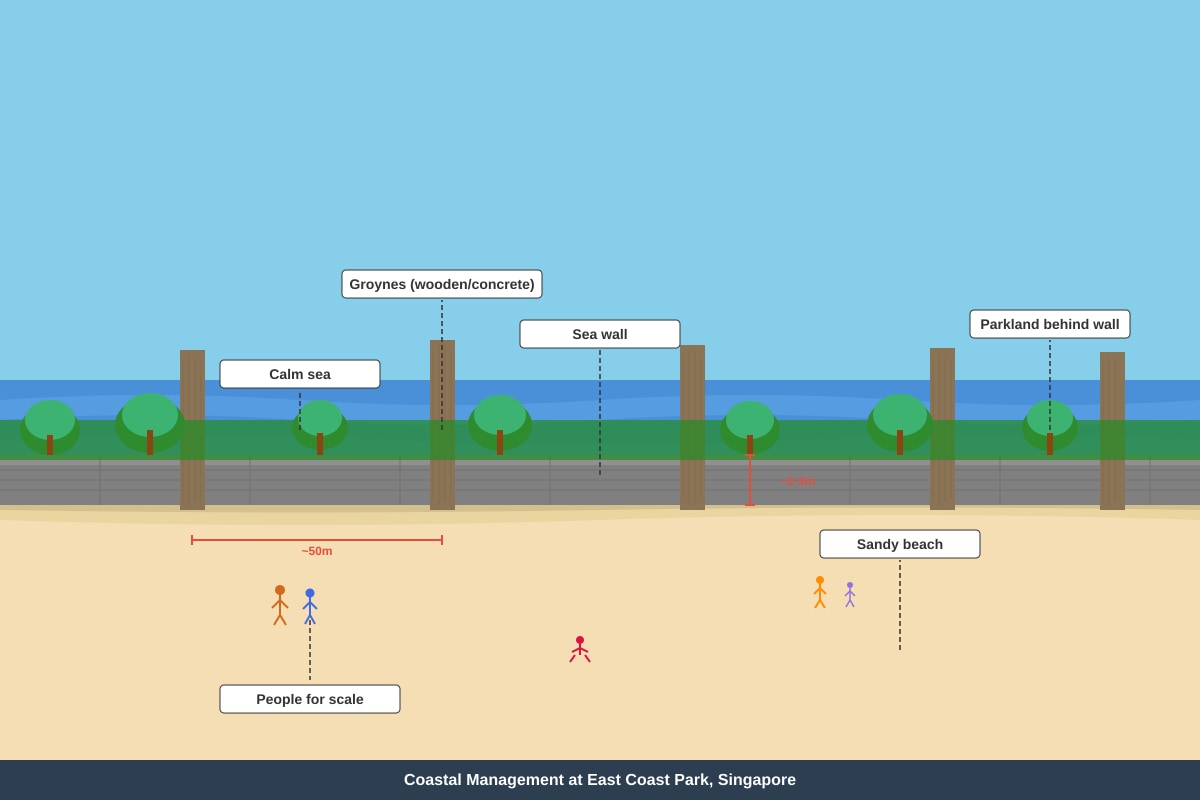
Generated source_image for Q9.
(a) Identify the coastal management strategy shown in the photograph. [1]
(b) Explain how the structures shown work to protect the coastline from erosion. [3]
(c) Suggest one advantage and one disadvantage of using hard engineering approaches like those shown, compared to beach nourishment or mangrove restoration. [2]
END OF PAPER
Answers
TuitionGoWhere Practice Paper Answer Key - Geography Secondary 3
Version 4 of 5
Total marks: 60
SECTION A: Map Skills and Interpretation
[Total: 20 marks]
1. (a) 16 37 (accept 16 36 to 16 38 if trig point is plotted slightly differently) [1]
Note: Four-figure grid reference gives easting first (16), then northing (37).
(b) Working:
- Difference in eastings: 16 − 14 = 2 cm (or 2 grid units)
- Difference in northings: 38 − 36 = 2 cm (or 2 grid units)
- Using Pythagoras: distance on map = √(2² + 2²) = √8 ≈ 2.83 cm [1 for method]
- At scale 1:50,000, 1 cm = 0.5 km, so: 2.83 × 0.5 = 1.415 km [1 for scale conversion]
- Answer: 1.4 km (accept 1.41–1.42 km) [1]
Common error: Forgetting to convert from map distance to ground distance using the scale, or giving answer in cm/m only.
(c) Marking descriptors:
- Level 3 (3–4 marks): Detailed description using multiple map evidence types. Identifies at least two relief features (e.g., river valley with steep sides, coastal plain, higher ground to inland) with specific contour evidence.
- Level 2 (1–2 marks): General description with some map evidence, or detailed description limited to one aspect.
- Level 1 (0 marks): Vague or no map evidence used.
Sample answer for 4 marks: The area shows varied relief. The central river valley is shown by V-shaped contour lines bending upstream (higher values), indicating the land rises away from the river on both sides [1]. The coastal area near Bayfield has widely spaced contours, indicating a gentle gradient or coastal plain [1]. To the north-west, contours rise to the spot height of 156 m, showing higher ground that drains toward the river [1]. The coastline is irregular with a bay, suggesting submergence or erosion of weaker rock [1].
Key concept: Contour spacing indicates slope gradient; contour shape indicates landform.
2. (a) Low pressure system / depression / cyclone [1]
Not acceptable: "Typhoon" (no eye shown) or just "L" without naming the system type.
(b) Marking descriptors:
- Level 3 (3–4 marks): Clear explanation using pressure data and wind patterns to explain contrasting weather. Links Singapore's position to ITCZ/low pressure influence and Hong Kong's position to high pressure/colder conditions.
- Level 2 (1–2 marks): Partial explanation with some map evidence, or explanation of one location only.
- Level 1 (0 marks): Generic or irrelevant answer.
Sample answer for 4 marks: Singapore (1008 hPa, 27°C) is located near the ITCZ and the low pressure centre [1], where converging winds rise, causing cloud formation and rainfall [1]. The temperature of 27°C indicates warm, humid conditions with likely convectional rain. In contrast, Hong Kong (1012 hPa, 22°C) is near the high pressure centre and on the cold side of the cold front [1]. The higher pressure and lower temperature (22°C compared to 27°C) suggest cooler, drier, and more stable conditions with winds from the north bringing colder air [1].
Key concept: Pressure systems determine weather; low pressure = rising air, cloud, rain; high pressure = sinking air, clearer skies; fronts bring abrupt weather changes.
(c) Wind direction: South-westerly / south-west (accept south to southwest) [1] Strength: Light to moderate (shown by widely spaced isobars compared to the strong gradient near the low pressure centre) [1]
Evidence required: Must reference isobar spacing or specific isobar values. Bangkok is in a relatively weak pressure gradient between 1004 and 1008 hPa.
3. (a) Any one valid limitation:
- Choropleth maps use average values across whole countries, hiding internal variations (e.g., rural vs. urban density differences) [1]
- Boundaries are arbitrary political lines, not natural population boundaries [1]
- Colour classes group very different values together, losing precision [1]
- Small countries may be hard to distinguish visually [1]
Key concept: Choropleth maps generalize continuous data into bounded areas, creating the ecological fallacy of assuming uniformity within units.
(b) Three valid push/pull factors with explanatory link:
- Economic pull: Singapore offers high-paying jobs in finance, technology, and services, attracting economic migrants from across Southeast Asia [1]
- Political push/pull: Political instability or conflict in neighbouring countries pushes people toward Singapore's stable governance [1]
- Educational pull: World-class universities and schools attract international students and their families [1]
- Healthcare pull: Advanced medical facilities attract medical tourists and retirees [1]
- Historical/linguistic pull: Existing ethnic Chinese, Malay, and Indian communities create network migration effects [1]
Any three well-developed factors with clear push/pull identification and Singapore-specific link: 3 marks.
SECTION B: Graphical and Data Skills
[Total: 24 marks]
4. (a) January (and February, both 28°C) [1]
Accept "January and February" or either month. Temperature values are equal at 28°C.
(b) Working:
- Sum all monthly rainfall values: 320 + 280 + 200 + 60 + 20 + 5 + 2 + 5 + 10 + 40 + 120 + 250 [1 for correct method with some values]
- = 1312 mm [1]
Common error: Adding temperature values by mistake, or omitting months. Answer only without working: 1 mark maximum.
(c) Two valid descriptive points:
- Annual temperature range is small / temperatures are consistently high throughout the year [1]
- Slight cooling occurs during June–August (winter months in Southern Hemisphere), with minimum in July (19°C) [1]
Alternative valid point: Bimodal pattern with peaks in January/February and December related to wet season cloud cover effects.
(d) Dry season: June, July, August (accept May–September or any month combination where rainfall <50mm) [1]
Reasoning for 2 marks:
- Rainfall in June (5 mm), July (2 mm), and August (5 mm) is extremely low, all below 10 mm [1]
- This contrasts sharply with wet season months (November–March) where monthly rainfall exceeds 120 mm, with January reaching 320 mm [1]
- These months coincide with the coolest period, suggesting reduced evaporation and possible seasonal wind shift (semi-arid/tropical grassland climate pattern) [1 for extension]
Key concept: Tropical climates may have distinct wet/dry seasons due to seasonal ITCZ movement; Southern Hemisphere winter (June–August) brings drier conditions when sun is north.
(e) One valid response with explanation:
Agriculture / farming: Farmers may struggle with irrigation during June–August when rainfall is minimal (5 mm or less monthly) and temperatures still reach 19–21°C, causing soil moisture deficit [1]. Crop selection must account for this dry period, or irrigation infrastructure is essential [1].
Tourism: The dry season may attract tourists seeking reliable sunshine, benefiting beach and outdoor activities with minimal rainfall interruption [1]. However, water sports dependent on river flows may be affected by low water levels [1].
Hydroelectric power: Reduced river flows during dry season may limit electricity generation from run-of-river schemes [1].
Any valid human activity with explicit climate data link: 2 marks.
5. (a) Working:
- Sum 65+ age groups: 65-69 (2.0 + 2.2 = 4.2%) + 70-74 (1.6 + 1.9 = 3.5%) + 75-79 (1.0 + 1.4 = 2.4%) + 80+ (0.6 + 1.0 = 1.6%) [1 for method with correct grouping]
- = 4.2 + 3.5 + 2.4 + 1.6 = 11.7% [1]
Accept 11.7% or working leading to this. Common error: Using only male or only female values, or including 60-64 group.
(b) Two valid features:
- Narrow base: The youngest age groups (0–4: 5.8% + 5.5% = 11.3%; 5–9: 10.9%) are much narrower than typical for a growing population, indicating below-replacement fertility [1]
- Bulge in upper sections / wide top: The pyramid becomes wider in older age groups relative to younger ones, with females outnumbering males in older ages (e.g., 80+: 1.0% female vs. 0.6% male) [1]
- Steepest sides in middle age groups with gradual rather than sharp narrowing toward top, showing survival to old age [1]
(c) Evaluation marking (4 marks):
Policy A – Increase retirement age:
- Strengths: Immediately retains experienced workers, reduces pension/dependency ratio burden, maintains tax base without requiring 18+ years for new workers to enter labour force [1]
- Limitations: May block promotion opportunities for younger workers; not all older workers can physically/mentally continue; may not address long-term demographic decline if fertility stays low [1]
Policy B – Cash incentives for children:
- Strengths: Addresses root cause (low fertility), potential long-term labour supply increase; supported by evidence that childcare costs deter childbearing [1]
- Limitations: Takes 18+ years for economic impact; expensive for government; may have limited effect if cultural preferences for small families are strong; does not solve immediate labour shortage [1]
Judgment (1 mark available within 4): Policy A more effective short-term; Policy B more effective long-term; combined approach most effective. Must justify with temporal considerations.
Sample 4-mark answer: Policy A is more effective in the short term because it immediately extends working life and tax contributions without waiting for children to grow up [1]. However, it only delays rather than solves the ageing problem [1]. Policy B addresses the root cause but requires 18–20 years before children enter the workforce, by which time the old-age dependency ratio will have worsened dramatically [1]. Therefore, both policies should be implemented together, with Policy A as an immediate measure and Policy B for long-term sustainability [1].
6. (a) Working:
- Change = 8438 − 4426 = 4012 [1 for method]
- Percentage change = (4012 / 4426) × 100 = 90.6% [1]
Accept 90.6% or 90.6 (no penalty for missing % if clear context). Common error: Using 2023 as base year, giving 47.5%.
(b) Southeast Asia [1]
Working: 4125 − 2856 = 1269 (largest absolute increase, though Northeast Asia has largest percentage increase).
(c) Two valid reasons:
- Post-COVID recovery: 2022 had travel restrictions; 2023 saw full reopening of borders and resumption of international travel [1]
- Economic rebound in source regions: Improved economic conditions in Southeast Asia and Northeast Asia increased disposable income for travel [1]
- Singapore's marketing campaigns: Targeted tourism promotion such as "SingapoReimagine" to attract visitors [1]
- Increased flight connectivity: Airlines restored and added routes to Singapore [1]
7. (a) Two valid descriptive points:
- There is a positive correlation between GDP per capita and life expectancy: as GDP per capita increases, life expectancy generally increases [1]
- The relationship is non-linear / shows diminishing returns: at lower GDP levels (below ~US10,000),smallincreasesinGDPbringlargelifeexpectancygains;athigherGDPlevels(above US30,000), further wealth increases bring minimal life expectancy improvements [1]
(b) One valid reason with explanation:
- Lifestyle factors: Japan's diet and health behaviours (lower obesity, traditional diet) may promote longevity despite lower GDP than Singapore [1]
- Healthcare system efficiency: Japan's universal healthcare may deliver better health outcomes per dollar spent [1]
- Income inequality: Singapore's high GDP per capita may mask inequality; average wealth doesn't translate to health access for all citizens [1]
- Social factors: Stronger community and family support networks in Japan may contribute to elderly wellbeing [1]
- Stress and work culture: Singapore's competitive work environment may negatively impact health despite high income [1]
(c) Two valid comparative points:
- A scatter graph shows individual data points as separate entities without implying continuity between them; countries are discrete cases, not a continuous variable [1]
- A line graph would incorrectly suggest a predictable sequence or trend between the plotted points when there is no natural order to countries [1]
- Scatter graphs clearly display correlation patterns and outliers (e.g., Japan vs. Singapore) that line graphs obscure [1]
- Multiple countries can be labelled individually without overcrowding the axis [1]
SECTION C: Data Response and Synthesis
[Total: 16 marks]
8. (a) Marking descriptors:
- Level 3 (3 marks): Detailed description with specific data references showing trend and variability.
- Level 2 (2 marks): General trend described with some data.
- Level 1 (0–1 marks): Vague description or no data.
Sample 3-mark answer: Singapore's rainfall shows high inter-annual variability with no clear increasing or decreasing trend [1]. The highest rainfall occurred in 2021 (3080 mm) and 2016 (3010 mm), while the lowest was in 2018 (1710 mm) and 2015 (1850 mm) [1 for specific data]. The range is approximately 1370 mm between maximum and minimum, indicating unreliable rainfall that challenges water planning [1]. Years alternate between relatively wet and dry without predictable pattern, consistent with equatorial influences and climate variability [1 for extension].
(b) Marking: Must reference BOTH graph AND table for full marks.
4-mark answer structure:
- NEWater and desalination are weather-independent [1]: Table shows local catchment water depends on rainfall (20%, vulnerable to variability shown in graph where rainfall ranged 1710–3080 mm) [1]
- NEWater (30%): Recycles used water, creating a renewable loop not dependent on rainfall; however, energy-intensive [1 from table]
- Desalinated water (10%): Unlimited source from seawater; highest energy cost but completely independent of rainfall variability shown in graph [1 from table]
- Combined importance: Together they provide 40% of supply that is rainfall-independent, crucial as demand rises from 430 to 680 million gallons/day by 2040 while rainfall remains unreliable [1 synthesis using both sources]
(c) Evaluation (5 marks):
Marking descriptors:
- Level 4 (5 marks): Balanced evaluation with clear judgment, considering multiple strengths AND limitations with specific reference to the Four National Taps.
- Level 3 (3–4 marks): Some balance, with developed explanation of either strengths or limitations.
- Level 2 (1–2 marks): One-sided or generic answer.
- Level 1 (0 marks): Irrelevant or no evaluation.
Sample 5-mark answer:
Diversification significantly reduces but does not eliminate vulnerability [1 for qualified judgment].
Strengths:
- Reduces single-source dependency: Imported water (50%) is vulnerable to Malaysia agreement expiry in 2061 and political relations; diversification hedges this risk [1]
- Addresses rainfall variability: Graph shows 1370 mm range in annual rainfall; NEWater and desalination (40% combined) provide stable supply regardless of drought [1]
- Scalability: NEWater and desalination can expand capacity unlike land-limited catchments [1]
Limitations:
- Energy vulnerability: Both NEWater and desalination are energy-intensive; rising energy costs or supply disruptions would affect water security [1]
- High costs: Desalination has highest energy cost; scaling to 100% would be economically unfeasible [1]
- Incomplete replacement: Even with diversification, 20% local catchment and 50% imports remain vulnerable to climate and geopolitical factors [1]
- Environmental impacts: Desalination brine disposal affects marine ecosystems; NEWater requires sophisticated treatment infrastructure [1]
Judgment: The Four National Taps strategy is necessary but insufficient alone; Singapore must also pursue demand management, water conservation, and renewable energy to fully secure water supply [1]
9. (a) Hard engineering / groynes and sea wall (accept either or both) [1]
(b) 3-mark explanation:
Groynes are perpendicular structures built from coastline into sea [1]. They trap sediment moving by longshore drift, preventing it from being carried away from the beach; this builds up beach width which absorbs wave energy [1]. The sea wall provides a physical barrier that reflects wave energy back to sea, preventing direct erosion of the coastline behind it [1].
(c) Advantage (1 mark): Immediate and predictable protection; long lifespan; effective against severe storms; protects infrastructure directly behind [1]
Disadvantage (1 mark): More expensive to construct and maintain than beach nourishment; groynes starve downdrift beaches causing erosion elsewhere; sea walls reflect wave energy that scours beach material; visual/ environmental impact on natural coastline; cannot adapt to sea level rise unlike ecosystem-based approaches [1]
END OF ANSWER KEY
Free quiz and exam paper access
Enter your details to view this paper
Your access is remembered on this device.