AI Generated Exam Paper
Secondary 3 Geography Practice Paper 3
Free Sec 3 Geography Practice Paper 3, Kimi2.6 AI version, with questions, answers, and O Level-style practice for Singapore students.
These static practice materials are generated from the site's syllabus and paper-generation workflow, with source and model context shown so students and parents can evaluate the material before use.
Questions
TuitionGoWhere Practice Paper - Geography Secondary 3
TuitionGoWhere Practice Paper (AI)
Subject: Geography
Level: Secondary 3
Paper: Practice Paper
Version: 3 of 5
Duration: 1 hour 15 minutes
Total Marks: 50
Name: _________________________________
Class: _________________________________
Date: _________________________________
Instructions to Candidates
- Answer ALL questions.
- Write your answers in the spaces provided.
- For questions requiring calculations, show all working clearly.
- Use of calculators is allowed.
- Marks are indicated in brackets [ ] at the end of each question or part question.
- The total number of marks for this paper is 50.
Section A: Map Skills (20 marks)
Answer all questions in this section.
1. Study the map extract below.
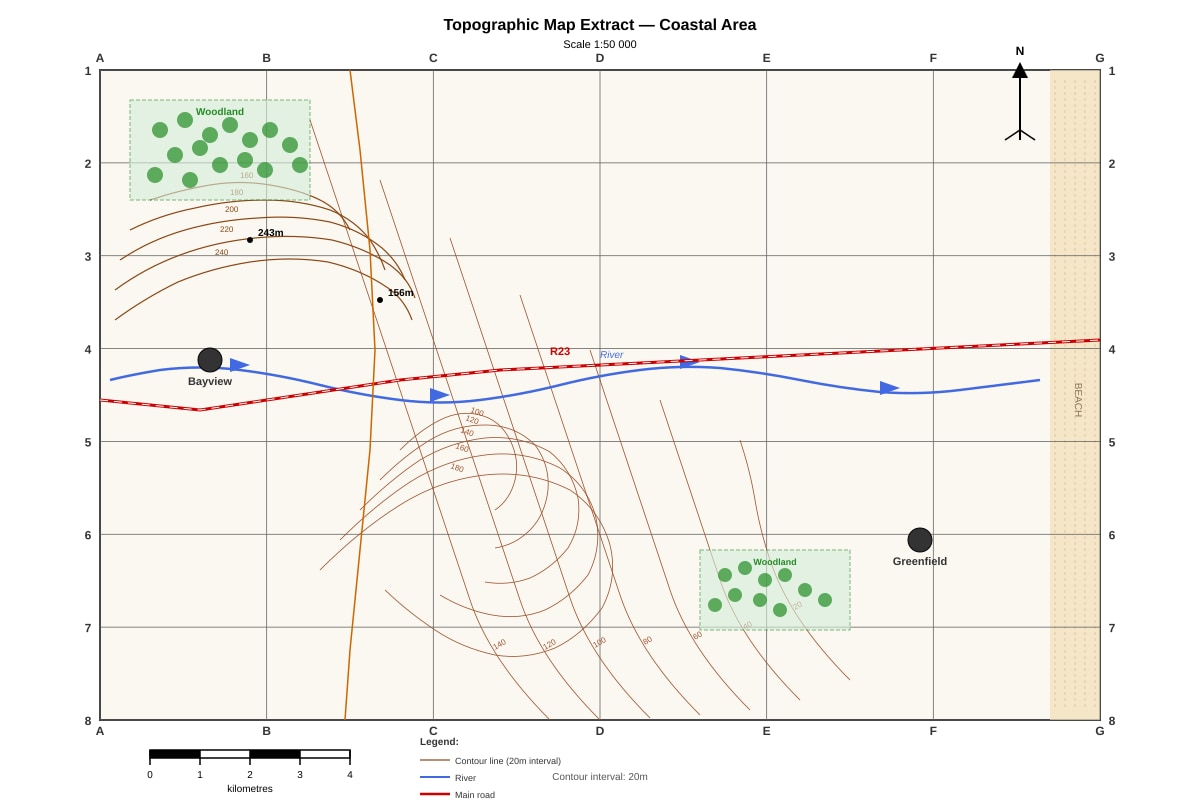
Generated map for Q1.
(a) State the six-figure grid reference of the spot height 243m shown on the map. [1]
(b) Calculate the straight-line distance, in kilometres, between Bayview (grid reference B4) and Greenfield (grid reference F6). Show your working. [2]
(c) Describe the relief of the area shown in the north-west corner of the map (between grid lines A–C and 5–8). [2]
(d) Explain one reason why the road R23 follows the route shown rather than taking a straight line across the map. [2]
[Total: 7 marks]
2. Study the weather map below.
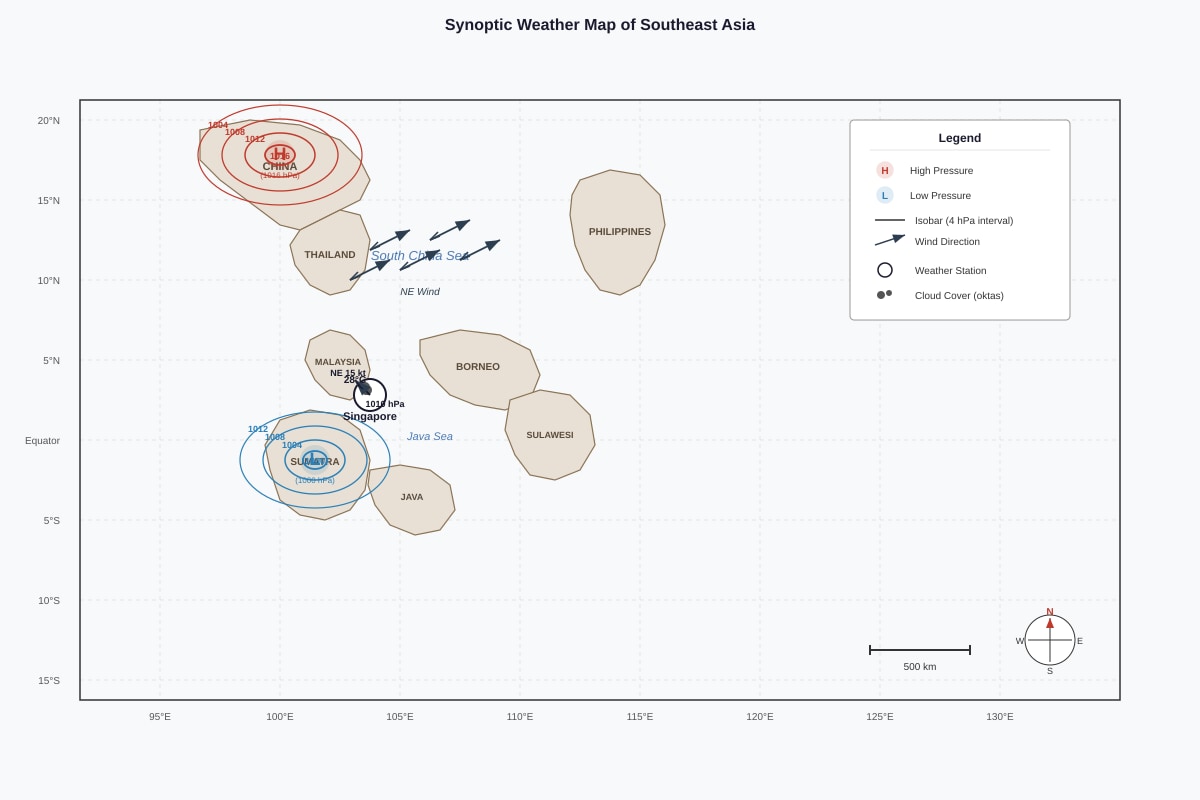
Generated map for Q2.
(a) Identify the pressure, in hPa, recorded at the Singapore weather station. [1]
(b) Calculate the pressure gradient between the centre of the high pressure system (1016 hPa) and the low pressure system (1000 hPa). The straight-line distance between their centres is 1200 km. Show your working and state the units. [2]
(c) Using evidence from the map, explain why Singapore is experiencing cloudy weather at this time. [3]
(d) Predict how the wind direction at Singapore might change if the low pressure system over Sumatra moves north-east towards the Malay Peninsula. Explain your reasoning. [2]
[Total: 8 marks]
3. Study the land-use map below showing part of a Singapore new town.
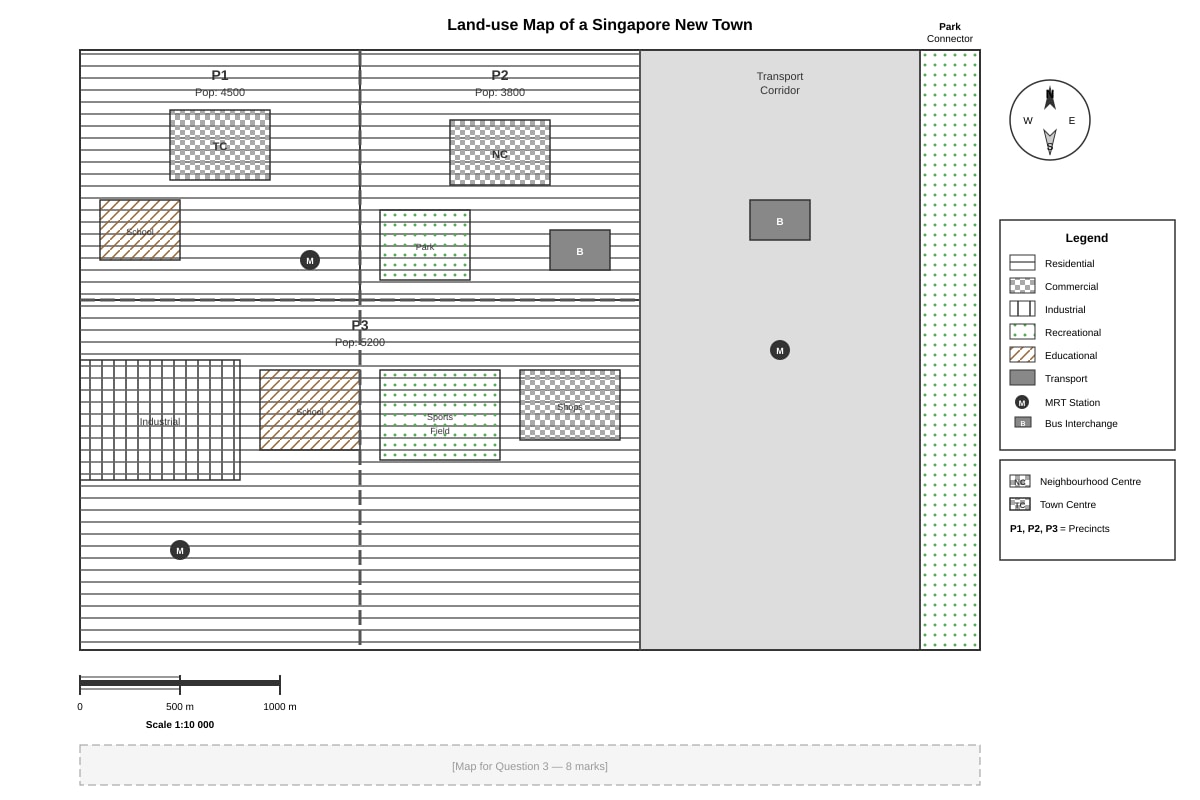
Generated map for Q3.
(a) Name the land-use zone that occupies the largest area on this map. [1]
(b) Calculate the total population served by the neighbourhood centre (NC). Show your working. [1]
(c) Suggest one reason why the MRT station is located where it is shown on the map. [2]
[Total: 5 marks]
Section B: Graphical and Data Skills (20 marks)
Answer all questions in this section.
4. Study the climate graph below for Station X.
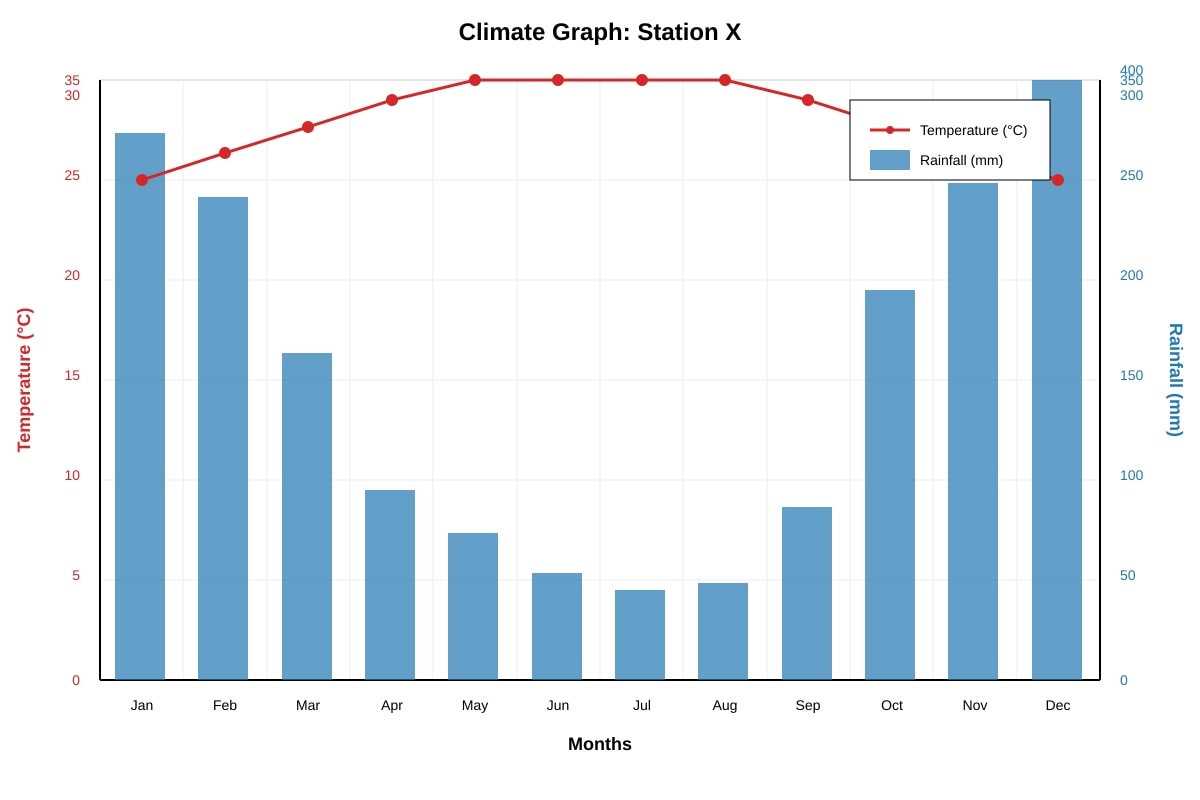
Generated graph for Q4.
(a) Identify the month with the highest temperature. [1]
(b) Calculate the annual temperature range. Show your working. [1]
(c) Describe the seasonal pattern of rainfall at Station X. [2]
(d) Calculate the total annual rainfall. Show your working. [2]
(e) Identify the climate type experienced at Station X and explain how the rainfall pattern is linked to the movement of the overhead sun and wind systems. [4]
[Total: 10 marks]
5. Study the population pyramid below showing data for Singapore in 2020 and a projected pyramid for 2040.
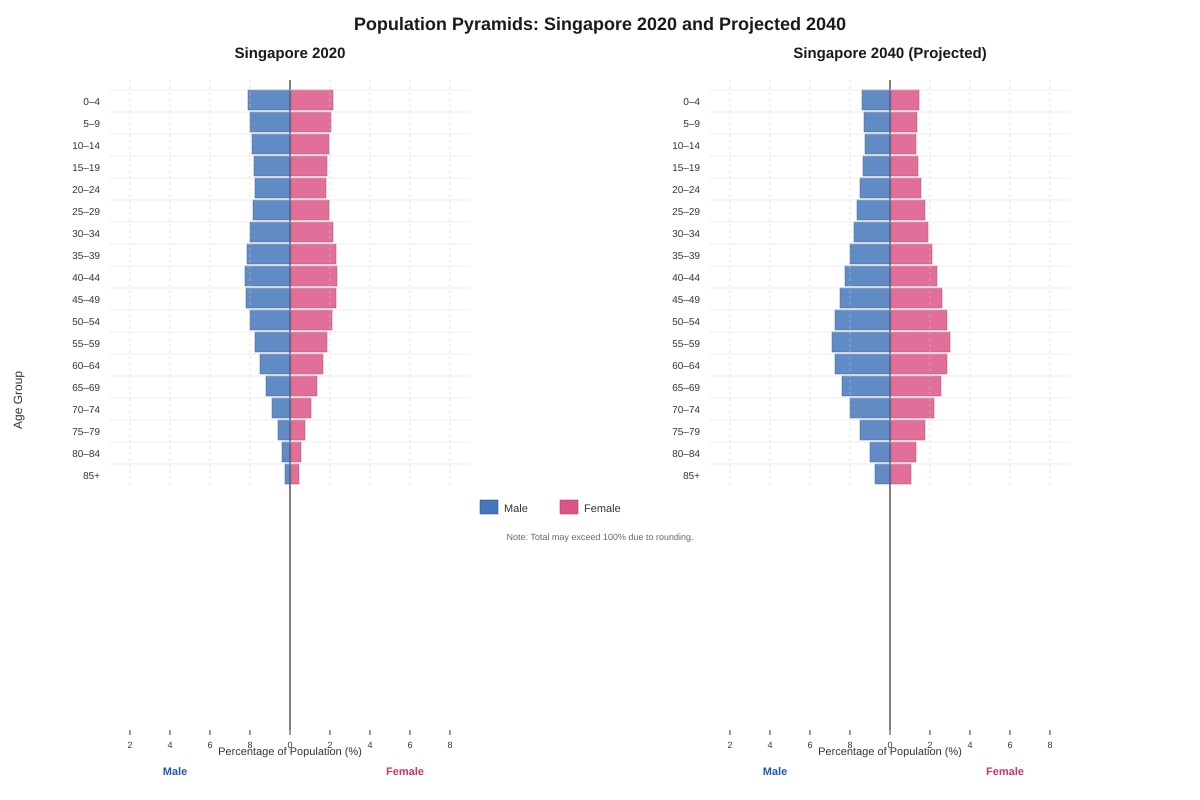
Generated graph for Q5.
(a) Compare the shape of the base (ages 0–14) of the two pyramids. [2]
(b) Describe the change in the proportion of elderly (65+) between 2020 and 2040. [2]
(c) Identify one social challenge that Singapore may face in 2040 based on these projections, and explain how the government could respond using geographical data skills to target interventions. [3]
(d) Explain why a dependency ratio calculated from these pyramids would be useful for urban planners in Singapore. [3]
[Total: 10 marks]
Section C: Data Interpretation and Application (10 marks)
Answer all questions in this section.
6. The table below shows tourist arrival data for Singapore.
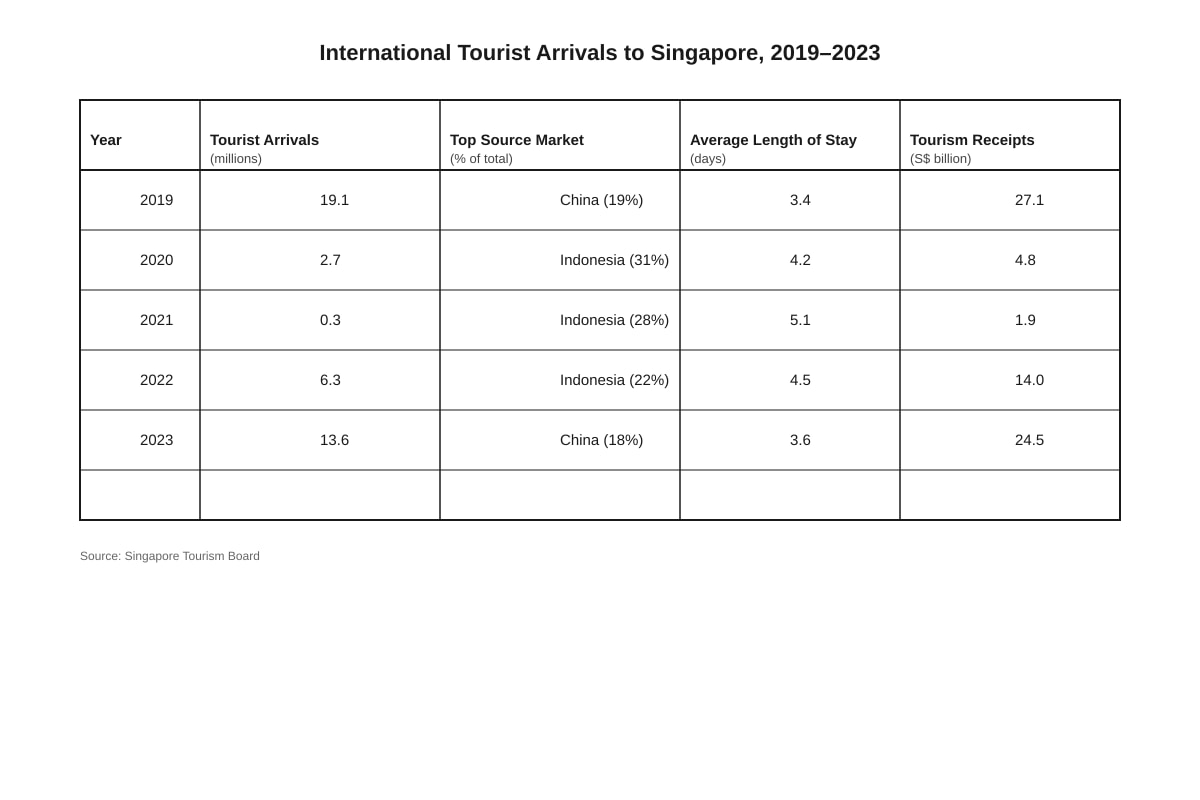
Generated table for Q6.
(a) Calculate the percentage decrease in tourist arrivals from 2019 to 2020. Show your working. [2]
(b) Identify the pattern in average length of stay between 2020 and 2023. [1]
(c) Suggest one reason why Indonesia replaced China as the top source market in 2020–2022, and explain why China returned as the top or near-top source market by 2023. [3]
(d) Using data from the table, explain whether Singapore's tourism industry had recovered by 2023. [4]
[Total: 10 marks]
END OF PAPER
[Blank page for additional working if needed]
Answers
TuitionGoWhere Practice Paper - Geography Secondary 3
Answer Key and Marking Scheme Version: 3 of 5
Total Marks: 50 Duration: 1 hour 15 minutes
Section A: Map Skills (20 marks)
Question 1
(a) State the six-figure grid reference of the spot height 243m.
Answer: E6 7 (accept 467 658 or equivalent based on precise map reading from the described grid system) [1]
Marking note: Award mark for correct six-figure reference. First two figures = easting, next two = northing, final figure of each = estimated tenths.
(b) Calculate the straight-line distance, in kilometres, between Bayview (grid reference B4) and Greenfield (grid reference F6).
Working:
- Grid distance B4 to F6: From B to F = 4 grid squares east; from 4 to 6 = 2 grid squares north
- Using Pythagoras: √(4² + 2²) = √(16 + 4) = √20 ≈ 4.47 grid squares
- At 1:50,000 scale, 1 grid square (typically 2cm on map) = 1 km, OR measure diagonal directly
- Distance = 4.5 km (accept 4.4–4.6 km depending on precise measurement)
Answer: 4.5 km (accept range 4.2–4.8 km with valid working) [2]
Marking notes:
- [1] for correct method (Pythagoras or scale measurement attempt)
- [1] for correct final answer with units (km)
Common error: Students may forget to convert from cm to km, or use wrong scale relationship.
(c) Describe the relief of the area shown in the north-west corner of the map (between grid lines A–C and 5–8).
Answer: (any two valid points):
- High/steep relief / land rises from east to west [1]
- Ridge pattern shown by V-shaped contours pointing east [1]
- Valley/gentler slope in the south shown by wider-spaced contours [1]
- Maximum height above 240m / steep gradients indicated by close contour spacing [1]
Marking notes: [2] for two distinct, accurate descriptions using contour evidence.
(d) Explain one reason why the road R23 follows the route shown rather than taking a straight line across the map.
Answer: (any one valid reason with explanation):
- Road follows the valley/route of gentler gradient to allow easier vehicle movement [1] + contours are wider spaced along the route reducing construction costs [1]
- OR road avoids steep ridge/escarpment in north-west where contours are close together [1] + would require expensive cutting and filling/tunneling [1]
- OR road connects settlements (Bayview and Greenfield) which are the main destination points [1] + straight line would miss these population centres reducing utility [1]
Marking notes: [2] for valid reason [1] + linked explanation using map evidence [1]
Question 2
(a) Identify the pressure, in hPa, recorded at the Singapore weather station.
Answer: 1010 hPa [1]
Direct recall from map reading. Must include unit for full mark.
(b) Calculate the pressure gradient between the centre of the high pressure system (1016 hPa) and the low pressure system (1000 hPa).
Working:
- Pressure difference = 1016 − 1000 = 16 hPa
- Distance = 1200 km
- Pressure gradient = Pressure difference ÷ Distance = 16 ÷ 1200 = 0.0133 hPa/km
Answer: 0.013 hPa/km (accept 0.013–0.0133) [2]
Marking notes:
- [1] for correct pressure difference (16 hPa) and correct formula
- [1] for correct calculation with units
Common error: Reversing formula (distance ÷ pressure) or omitting units.
(c) Using evidence from the map, explain why Singapore is experiencing cloudy weather at this time.
Answer:
- Singapore is located near the edge of a low pressure system / on the pressure trough between H and L [1]
- Wind is from northeast (NE 15 knots) bringing maritime air from South China Sea [1]
- This air is warm and moist; rising pressure at 1010 hPa is relatively low, encouraging uplift and cloud formation [1]
- 6 oktas cloud cover indicates mostly cloudy sky, consistent with convergence/moist air rising
Marking notes: [3] for three distinct linked points using map evidence. Must reference at least two map features.
(d) Predict how the wind direction at Singapore might change if the low pressure system over Sumatra moves north-east towards the Malay Peninsula.
Answer:
- Wind direction would shift to become more southerly or south-westerly [1]
- Winds blow from high to low pressure; if L moves closer to Singapore, the pressure gradient would reorient, causing winds to blow towards the low from the west/southwest rather than from the northeast [1]
Marking notes: [2] for correct prediction with explanation of pressure-gradient mechanism.
Question 3
(a) Name the land-use zone that occupies the largest area on this map.
Answer: Residential [1]
Identified by horizontal stripe pattern covering most of the map area.
(b) Calculate the total population served by the neighbourhood centre (NC).
Working:
- NC typically serves its own precinct plus adjacent precincts
- Based on map: NC is located in P2, likely serves P1, P2, P3 (three precincts shown)
- Total population = 4500 + 3800 + 5200 = 13,500
Answer: 13,500 (accept if student identifies P1+P2+P3 or nearest two precincts with valid reasoning: 8300 or 9000 with explanation) [1]
Marking note: Award mark for any reasonable interpretation with working shown.
(c) Suggest one reason why the MRT station is located where it is shown on the map.
Answer: (any one valid reason with explanation):
- Located at town centre/transport node for maximum accessibility [1] to serve the largest number of residents from all precincts [1]
- OR located at intersection of major movement corridors [1] to integrate with bus interchange (B) for multi-modal transfer [1]
- OR positioned to avoid expensive underground construction under industrial zone [1] which may have structural foundations/services [1]
Section B: Graphical and Data Skills (20 marks)
Question 4
(a) Identify the month with the highest temperature.
Answer: July [1]
Direct reading from graph: 32°C
(b) Calculate the annual temperature range.
Working:
- Highest temperature: 32°C (July)
- Lowest temperature: 26°C (January)
- Range = 32 − 26 = 6°C
Answer: 6°C [1]
Must show working for full mark.
(c) Describe the seasonal pattern of rainfall at Station X.
Answer: (any two distinct points):
- Wet season from October to January with heavy rainfall (200–350mm/month) [1]
- Dry season from May to August with very low rainfall (20–60mm/month) [1]
- OR bimodal pattern with secondary wet season in March [1]
- Strong seasonal contrast / monsoonal pattern [1]
Marking notes: [2] for two accurate descriptive points with month or season references.
(d) Calculate the total annual rainfall.
Working: Total = 320 + 280 + 180 + 90 + 60 + 30 + 20 + 25 + 80 + 210 + 290 + 350 = 1935 mm
Answer: 1935 mm [2]
Marking notes:
- [1] for correct method (sum of all 12 months)
- [1] for correct final answer with unit
(e) Identify the climate type experienced at Station X and explain how the rainfall pattern is linked to the movement of the overhead sun and wind systems.
Answer:
- Climate type: Tropical monsoon / Tropical climate with distinct wet and dry seasons [1]
Explanation:
- Overhead sun: In summer (June–August), overhead sun is north of the equator; Station X likely in Northern Hemisphere tropical zone [1]
- Wind systems: Dry season (May–August) coincides with southwest monsoon bringing rain to areas further north/west; Station X is in rain shadow or under subtropical high pressure influence [1]
- Wet season (October–January): Overhead sun moves south; northeast monsoon brings moist air from ocean, causing heavy rainfall [1]
- Inter-monsoon periods: March and October show transitional rainfall as ITCZ passes overhead [1]
Marking notes: [4] for climate identification [1] + three linked explanation points with seasonal mechanism.
Question 5
(a) Compare the shape of the base (ages 0–14) of the two pyramids.
Answer:
- 2020: Broad base showing higher proportion of young dependents; 0–4 age group at 4.2%, declining through 5–9 and 10–14 [1]
- 2040: Narrower base showing lower proportion of young; 0–4 at 2.8%, significantly smaller than 2020 [1]
- Declining fertility / birth rates evident in the contraction [1]
Marking notes: [2] for explicit comparison (must reference both pyramids, not just describe one).
(b) Describe the change in the proportion of elderly (65+) between 2020 and 2040.
Working (implicit):
- 2020 elderly: approximately 1.0 + 1.2 + ... ≈ 15% (estimated from tapering top)
- 2040 elderly: 80+ alone is 3.5%, with bulging 60–64 at 5.5% and 55–59 at 5.8%
Answer:
- Significant increase in elderly proportion [1]
- Pyramid top becomes wider / more rectangular in upper sections; 80+ more than triples from 1.0% to 3.5% [1]
- Aging population / demographic ageing evident [1]
Marking notes: [2] for description showing increase with specific data reference.
(c) Identify one social challenge that Singapore may face in 2040, and explain how the government could respond using geographical data skills to target interventions.
Answer:
- Challenge: Increased healthcare burden / strain on working population / elderly care needs / reduced tax base [1]
- Data skills response: Use GIS to map elderly concentration by precinct/zone [1]; overlay with healthcare facility locations to identify service gaps [1]; use data to plan new eldercare centres/integrated care hubs in underserved areas
OR
- Challenge: Labour shortage / economic slowdown [1]
- Data skills response: Analyse dependency ratios by region [1]; target foreign worker policies or automation investment in areas with lowest worker-to-dependent ratios [1]
Marking notes: [3] for challenge [1] + two linked data skill applications.
(d) Explain why a dependency ratio calculated from these pyramids would be useful for urban planners in Singapore.
Answer:
- Dependency ratio = (young + elderly) ÷ working population × 100 [1]
- Shows burden on economically active population [1]
- Higher ratio in 2040 means fewer workers supporting more dependents; planners need to ensure sufficient housing, transport, healthcare infrastructure for dependent populations [1]
- Spatial planning: areas with highest elderly dependency need more healthcare facilities, accessible transport, barrier-free design; areas with youth dependency need schools, childcare [1]
Marking notes: [3] for definition [1] + two applied planning uses.
Section C: Data Interpretation and Application (10 marks)
Question 6
(a) Calculate the percentage decrease in tourist arrivals from 2019 to 2020.
Working:
- Decrease = 19.1 − 2.7 = 16.4 million
- Percentage decrease = (16.4 ÷ 19.1) × 100 = 85.9%
Answer: 85.9% (accept 85–86%) [2]
Marking notes:
- [1] for correct formula and decrease calculation
- [1] for correct final percentage
Common error: Dividing by 2.7 instead of 19.1 (using wrong base year).
(b) Identify the pattern in average length of stay between 2020 and 2023.
Answer: The average length of stay increased from 2020 to 2021 (peak 5.1 days), then decreased towards 2023 (3.6 days) / inverted U-shape or return toward pre-pandemic norm [1]
(c) Suggest one reason why Indonesia replaced China as the top source market in 2020–2022, and explain why China returned as the top or near-top source market by 2023.
Answer:
- Indonesia rise: Travel corridors/bubble arrangements with nearby countries during COVID-19 pandemic [1]; Indonesia is geographically proximate, allowing land/short-haul air links to remain partially open when long-haul was restricted [1]
- China return: China reopened borders and lifted quarantine requirements in late 2022/early 2023 [1]; large outbound Chinese tourist market resumed; cultural affinity and established tourism infrastructure for Chinese visitors in Singapore [1]
Marking notes: [3] for three distinct linked points (need not be balanced between both parts; depth in one part with valid reason acceptable).
(d) Using data from the table, explain whether Singapore's tourism industry had recovered by 2023.
Answer:
- Partial recovery / near full recovery evident: [1]
- Tourist arrivals: 13.6m vs 19.1m in 2019 = 71% of pre-pandemic level [1]
- Tourism receipts: S24.5bvsS27.1b in 2019 = 90% of pre-pandemic level, much closer recovery in spending [1]
- Average length of stay nearly back to normal (3.6 vs 3.4 days) [1]
- However: China still only 18% vs 19% previously; total volume shortfall suggests not complete recovery [1]
Marking notes: [4] for balanced judgement with at least three specific data comparisons and conclusion.
Mark Summary
| Section | Question | Marks |
|---|---|---|
| A | 1 | 7 |
| A | 2 | 8 |
| A | 3 | 5 |
| B | 4 | 10 |
| B | 5 | 10 |
| C | 6 | 10 |
| TOTAL | 50 |
End of Answer Key
Free quiz and exam paper access
Enter your details to view this paper
Your access is remembered on this device.