AI Generated Exam Paper
Secondary 3 Geography Practice Paper 3
Free Sec 3 Geography Practice Paper 3, HY3 AI version, with questions, answers, and O Level-style practice for Singapore students.
These static practice materials are generated from the site's syllabus and paper-generation workflow, with source and model context shown so students and parents can evaluate the material before use.
Questions
TuitionGoWhere Practice Paper - Geography Secondary 3
TuitionGoWhere Practice Paper (AI)
Version: 3 of 5
Subject: Geography
Level: Secondary 3
Paper: Practice Paper (Map Graph Data Skills)
Duration: 45 minutes
Total Marks: 40
Name: ______________________
Class: _________
Date: ___________
Instructions:
- This practice paper tests map, graph, and data skills based on the Secondary 3 Geography syllabus.
- Answer all questions in the spaces provided.
- Use the data, maps, and graphs given. Show workings where needed.
- Section marks and question marks add up to 40.
Section A: Map Reading and Basic Graphs (Questions 1–8) [16 marks]
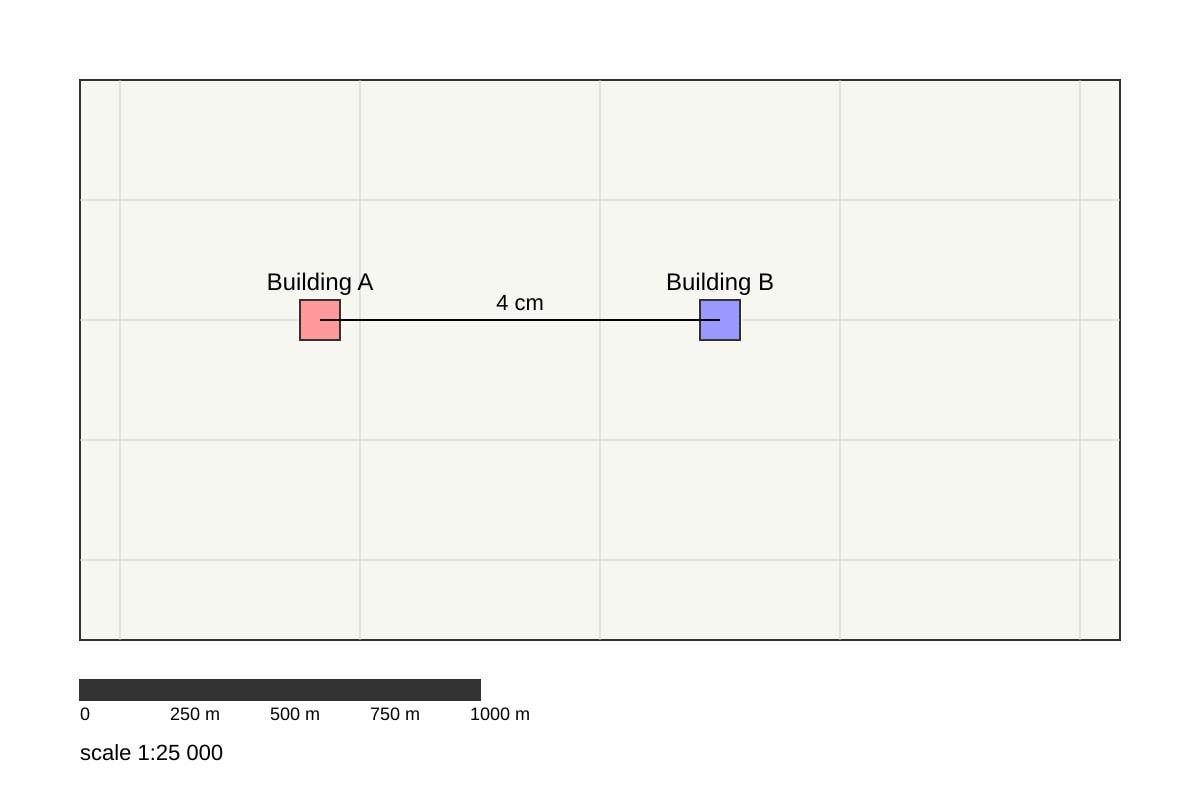
1. Study the map extract below. The map scale is 1:25 000. Two buildings are 4 cm apart on the map. What is the actual ground distance in kilometres? [2]
Image pending generation: map for Q1.
2. On the same map, a lake has a grid reference of 4826. What is the six-figure grid reference for a point at the centre of the lake if it is 0.3 grid squares east and 0.4 grid squares north of the 4826 corner? [2]
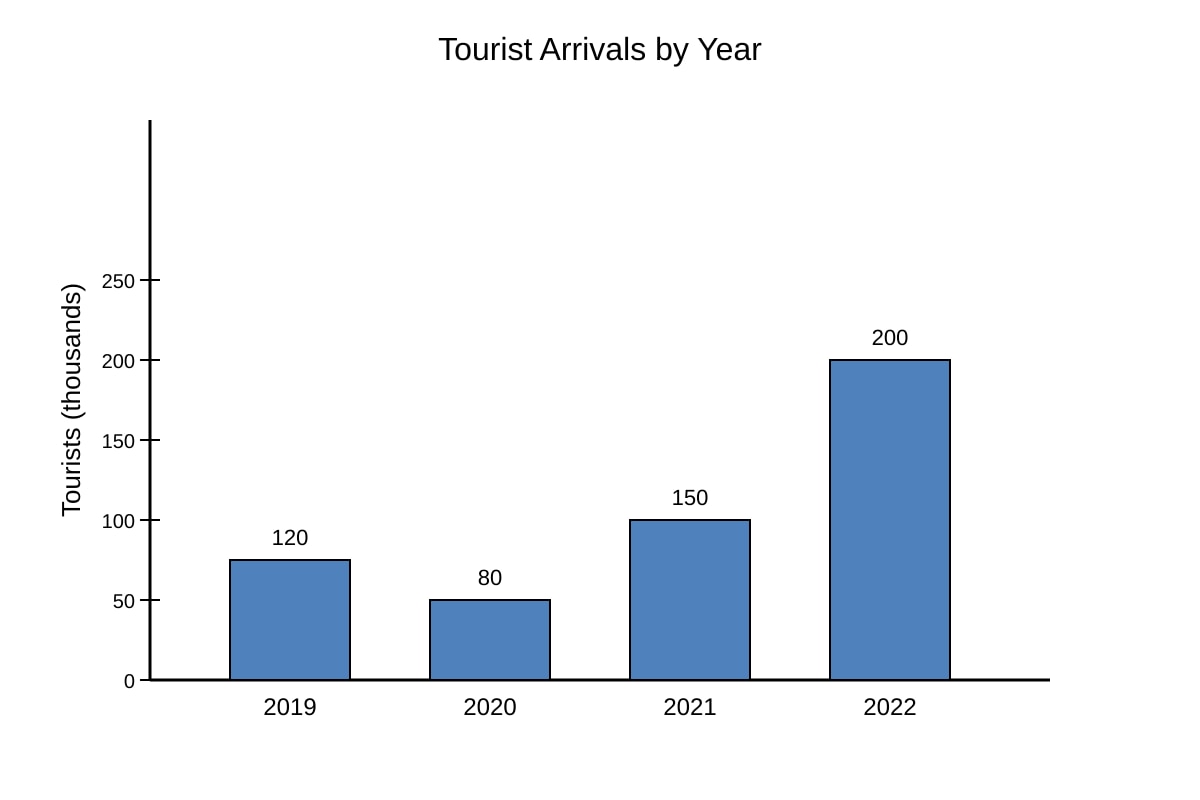
3. The bar graph shows the number of tourists visiting a town from 2019 to 2022.
2019: 120, 2020: 80, 2021: 150, 2022: 200 (in thousands).
In which year was there the largest increase in tourists compared to the previous year? [1]
Image pending generation: graph for Q3.
4. Using the bar graph in Q3, calculate the percentage decrease in tourists from 2019 to 2020. [2]
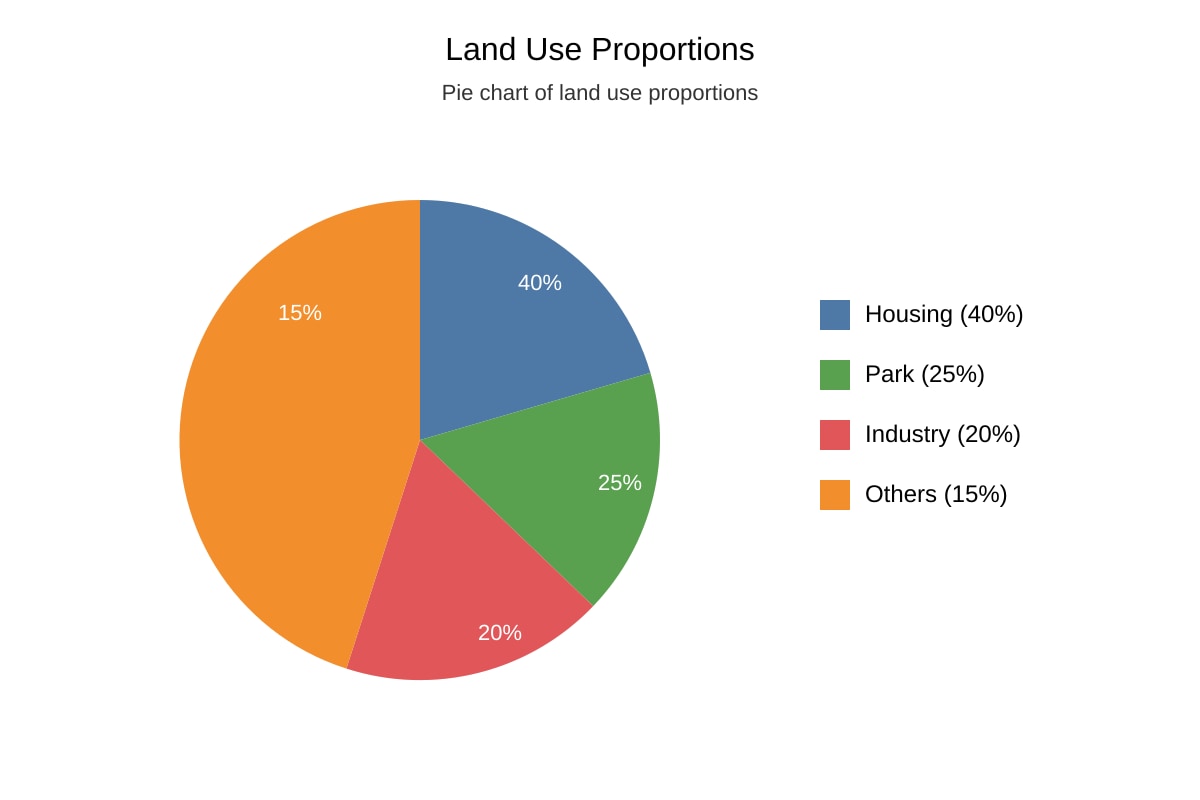
5. A pie chart shows land use: Housing 40%, Park 25%, Industry 20%, Others 15%. Which land use occupies the smallest angle in degrees? [1]
Image pending generation: chart for Q5.
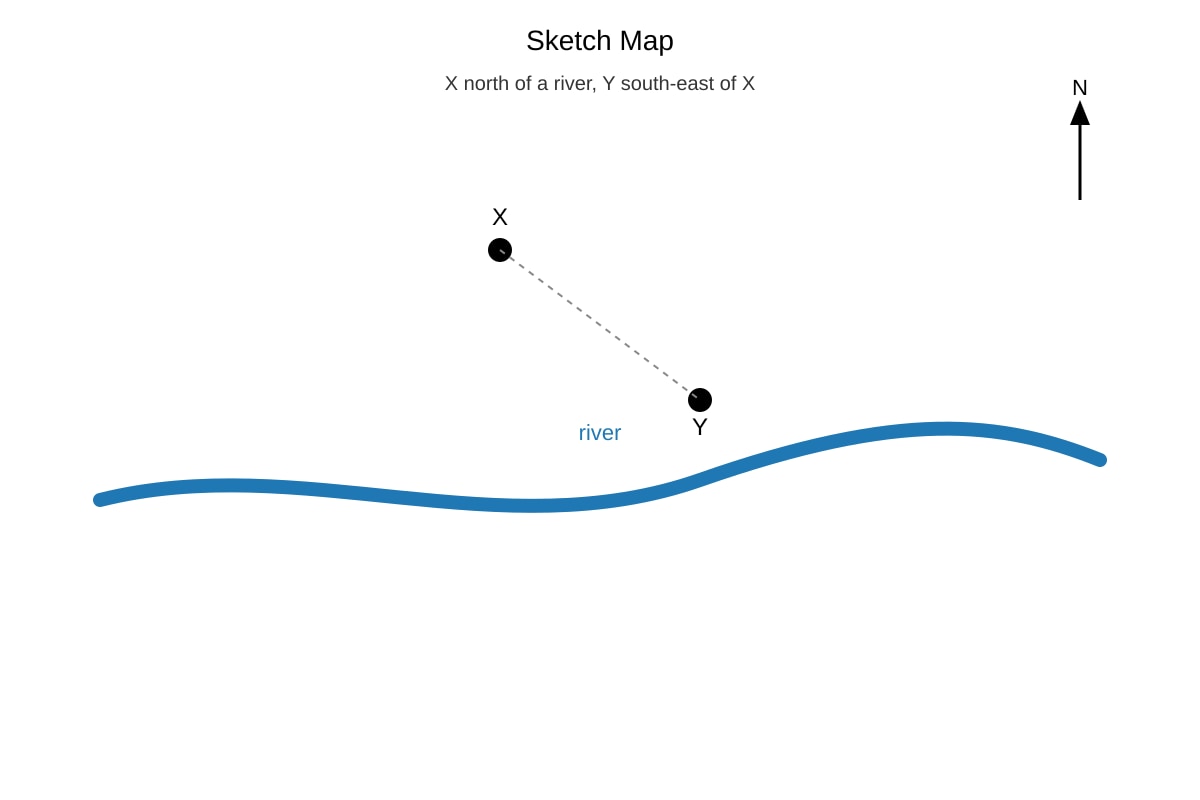
6. Give the compass direction from Point X (north of river) to Point Y (south-east of X) as shown. [1]
Image pending generation: map for Q6.
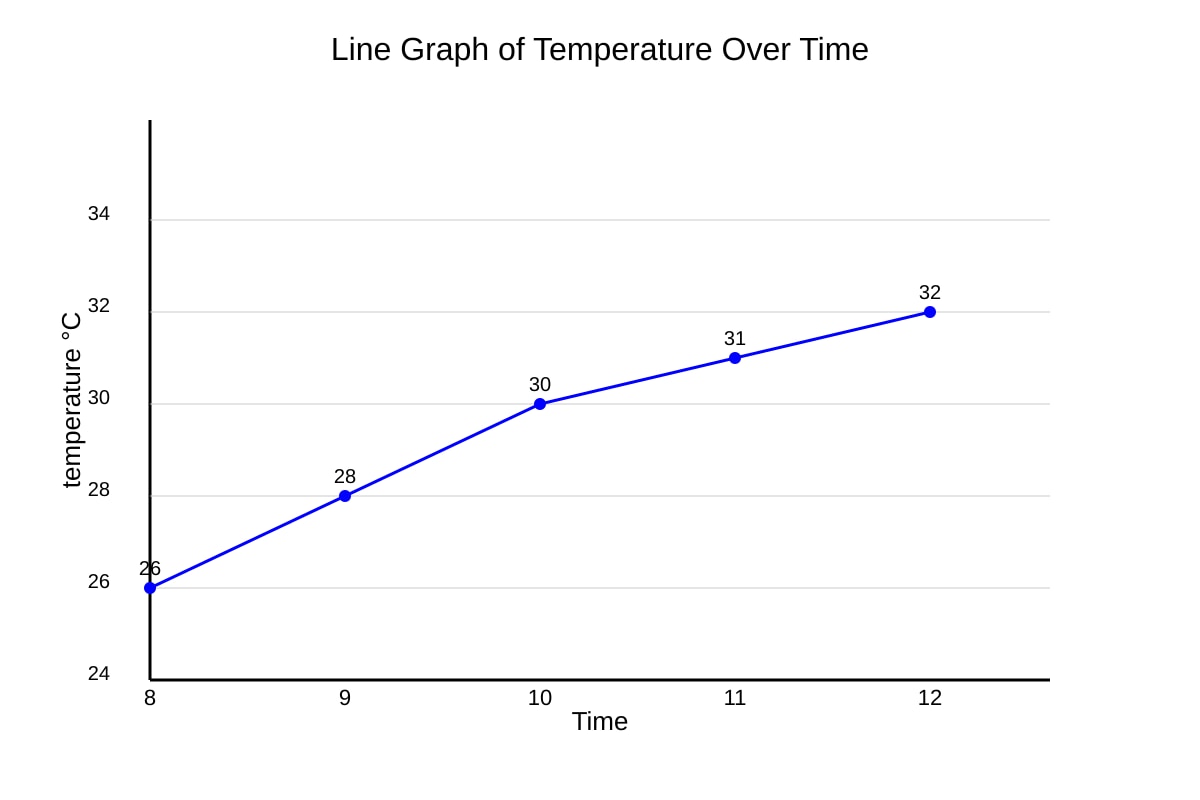
7. A line graph shows temperature from 8am to 12pm: 26°C, 28°C, 30°C, 31°C, 32°C. What is the mean temperature? [2]
Image pending generation: graph for Q7.
8. State one advantage of using a bar graph instead of a table for the tourist data. [1]
Section B: Data Tables and Interpretation (Questions 9–14) [12 marks]
The table below shows rainfall (mm) and visitor count at a park.
| Month | Rainfall (mm) | Visitors |
|---|---|---|
| Jan | 200 | 500 |
| Feb | 150 | 700 |
| Mar | 100 | 900 |
| Apr | 50 | 1100 |
9. Which month had the highest number of visitors? [1]
10. Calculate the total rainfall over the four months. [2]
11. Describe the relationship between rainfall and visitor numbers shown in the table. [2]
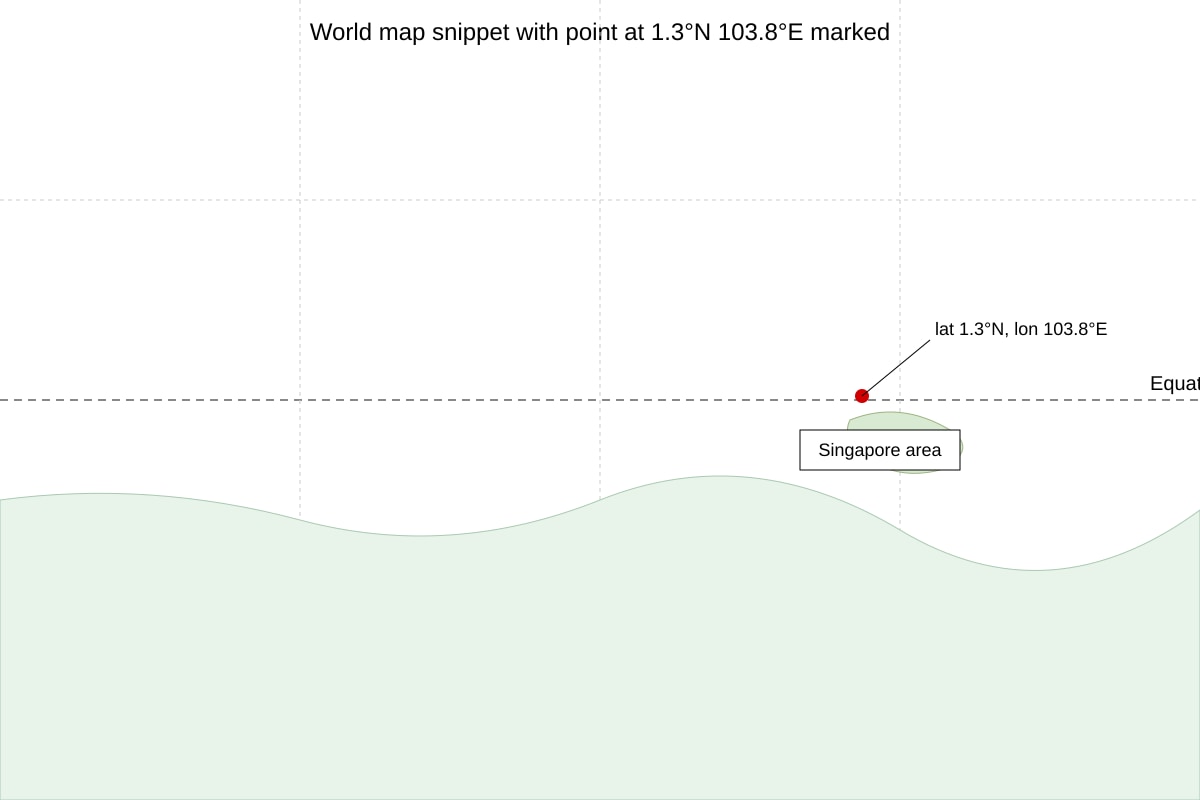
12. A map shows the park is located at 1.3°N, 103.8°E. What type of geographical coordinate is this? [1]
Image pending generation: map for Q12.
13. Convert 200 mm rainfall to cm. [1]
14. If a stratified sample of 40 visitors is taken from the total, and Feb has 700 of 3200 total visitors, how many Feb visitors should be sampled? [2]
15. The total visitors = 500+700+900+1100 = 3200. What is the ratio of Jan visitors to Apr visitors in simplest form? [1]
16. State why a researcher might use a questionnaire instead of observation to collect visitor data. [2]
Section C: Graph Construction and Synthesis (Questions 17–20) [12 marks]
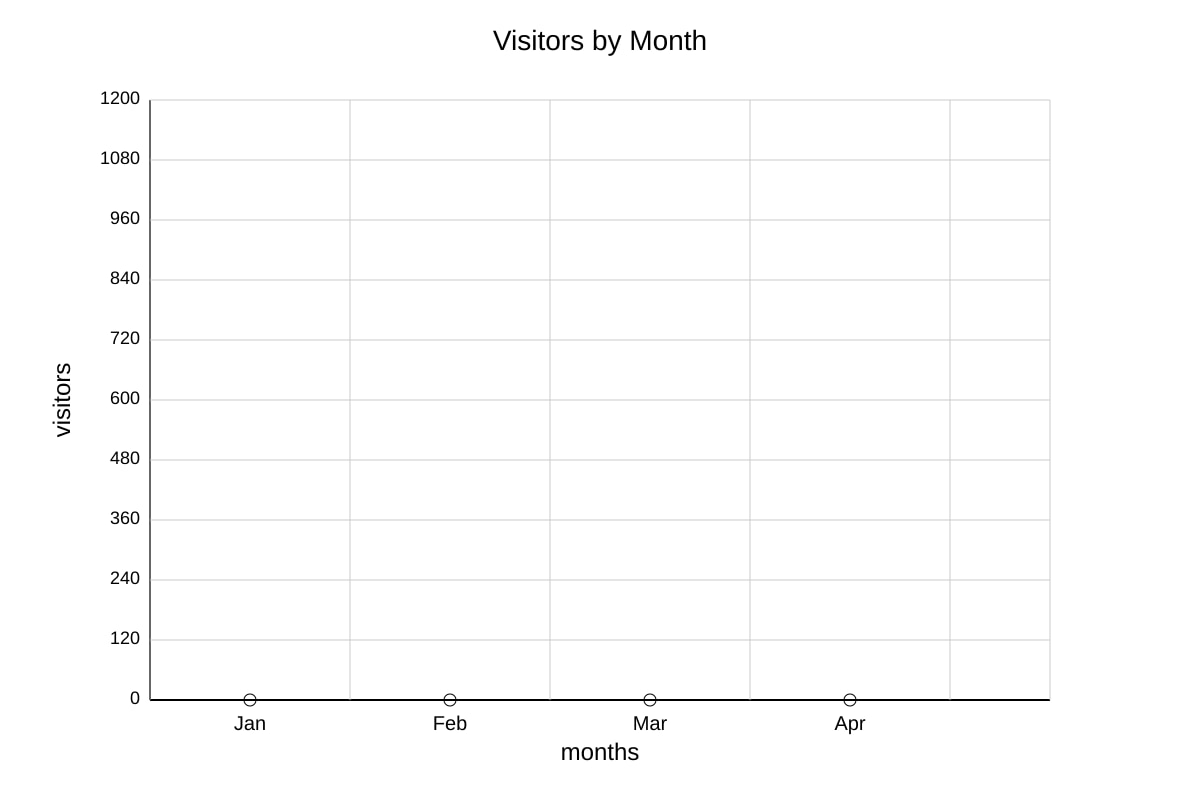
17. Using the table in Section B, plot a line graph of visitors by month on the grid. Label axes. [3]
Image pending generation: graph for Q17.
18. A climate graph combines rainfall bars and temperature line. Give two features that must be shown. [2]
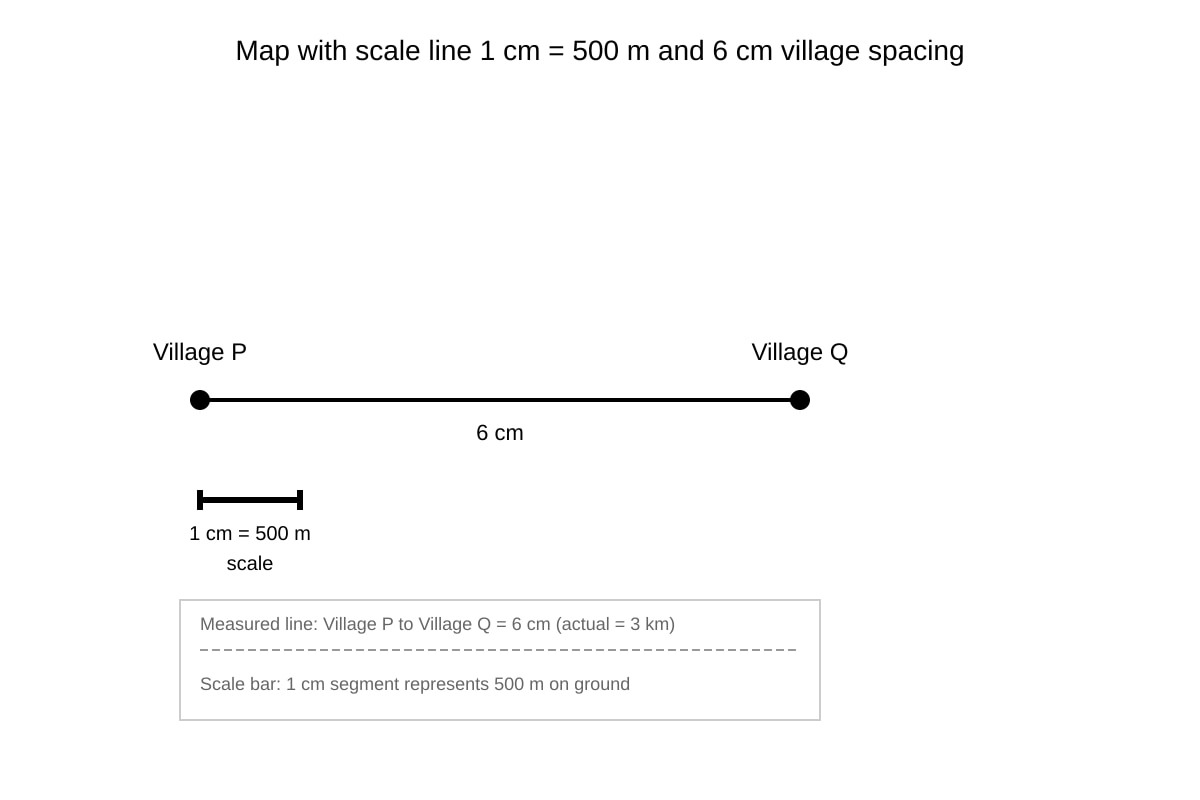
19. A map has scale 1 cm = 500 m. Two villages are 6 cm apart. What is the actual distance in km? [2]
Image pending generation: map for Q19.
20. Explain how a geographer uses sustainable development to assess the park's tourism data. [3]
Answers
TuitionGoWhere Practice Paper Answers - Geography Secondary 3 (Version 3)
Total Marks: 40
Section A Answers (16 marks)
Q1 [2 marks]
Actual distance = map distance × scale denominator = 4 cm × 25 000 = 100 000 cm.
Convert to km: 100 000 cm ÷ 100 000 = 1 km.
Answer: 1 km.
Teaching note: Map scale 1:25 000 means 1 unit on map = 25 000 same units on ground. Always convert cm to km by ÷100 000.
Q2 [2 marks]
Four-figure 4826 means square easting 48, northing 26. Add 0.3×100=30 to easting → 483; add 0.4×100=40 to northing → 266. Six-figure: 483266.
Answer: 483266.
Common mistake: mixing order; always easting first then northing.
Q3 [1 mark]
Increases: 2020 vs 2019 = -40 (drop); 2021 vs 2020 = +70; 2022 vs 2021 = +50. Largest increase = 2021.
Answer: 2021.
Q4 [2 marks]
Decrease = (120−80)/120 × 100 = 40/120 × 100 = 33.3%.
Answer: 33.3% decrease.
Marking: 1 mark formula, 1 mark answer.
Q5 [1 mark]
Smallest % = 15% Others. Angle = 15% × 360° = 54°.
Answer: Others (54°).
Teaching: pie angle = % × 3.6.
Q6 [1 mark]
From X to Y south-east.
Answer: South-east (SE).
Q7 [2 marks]
Mean = (26+28+30+31+32)/5 = 147/5 = 29.4°C.
Answer: 29.4°C.
Q8 [1 mark]
Advantage: visual comparison easier; trend seen quickly. (Any one)
Answer: Shows trend at a glance.
Section B Answers (12 marks)
Q9 [1] Apr (1100).
Q10 [2] Total = 200+150+100+50 = 500 mm.
Q11 [2] Negative relationship: as rainfall decreases, visitors increase. (1 mark pattern, 1 mark example)
Q12 [1] Latitude and longitude (decimal degrees).
Q13 [1] 200 mm = 20 cm (÷10).
Q14 [2] (700/3200)×40 = 8.75 ≈ 9. Answer: 9 visitors.
Q15 [1] 500:1100 = 5:11.
Q16 [2] Questionnaire can reach opinions/motivation; observation misses reasons. (2 points)
Section C Answers (12 marks)
Q17 [3] Plot Jan 500, Feb 700, Mar 900, Apr 1100; join line; label axes. (1 plot, 1 join, 1 label)
Q18 [2] Rainfall bars, temperature line, dual y-axes, months x-axis. (any 2)
Q19 [2] 6 cm × 500 m = 3000 m = 3 km.
Q20 [3] Use sustainable development: balance economic (visitors income), social (enjoyment), environmental (rainfall/ecosystem). Assess if current levels meet needs without harming future. (1 each)
Free quiz and exam paper access
Enter your details to view this paper
Your access is remembered on this device.