AI Generated Exam Paper
Secondary 3 Geography Practice Paper 2
Free Sec 3 Geography Practice Paper 2, DeepSeek AI version, with questions, answers, and O Level-style practice for Singapore students.
These static practice materials are generated from the site's syllabus and paper-generation workflow, with source and model context shown so students and parents can evaluate the material before use.
Questions
TuitionGoWhere Practice Paper - Geography Secondary 3
TuitionGoWhere Practice Paper (AI)
Subject: Geography Level: Secondary 3 Paper: Practice Paper 2 (Map, Graph, and Data Skills) Version: 2 of 5 Duration: 1 hour 15 minutes Total Marks: 40
Name: _________________________ Class: _________________________ Date: _________________________
Instructions to Candidates
- This paper consists of three sections (A, B, and C).
- Answer all questions.
- Write your answers in the spaces provided.
- The use of calculators is permitted where necessary.
- Marks for each question are indicated in brackets [ ].
- You are advised to spend about 25 minutes on each section.
Section A: Map Reading and Interpretation (12 marks)
Answer all questions in this section. Base your answers on the map extract provided (Fig. 1), which shows a coastal town and its surrounding area.
Fig. 1: Topographic Map of Port Ashton (Scale 1:25,000)
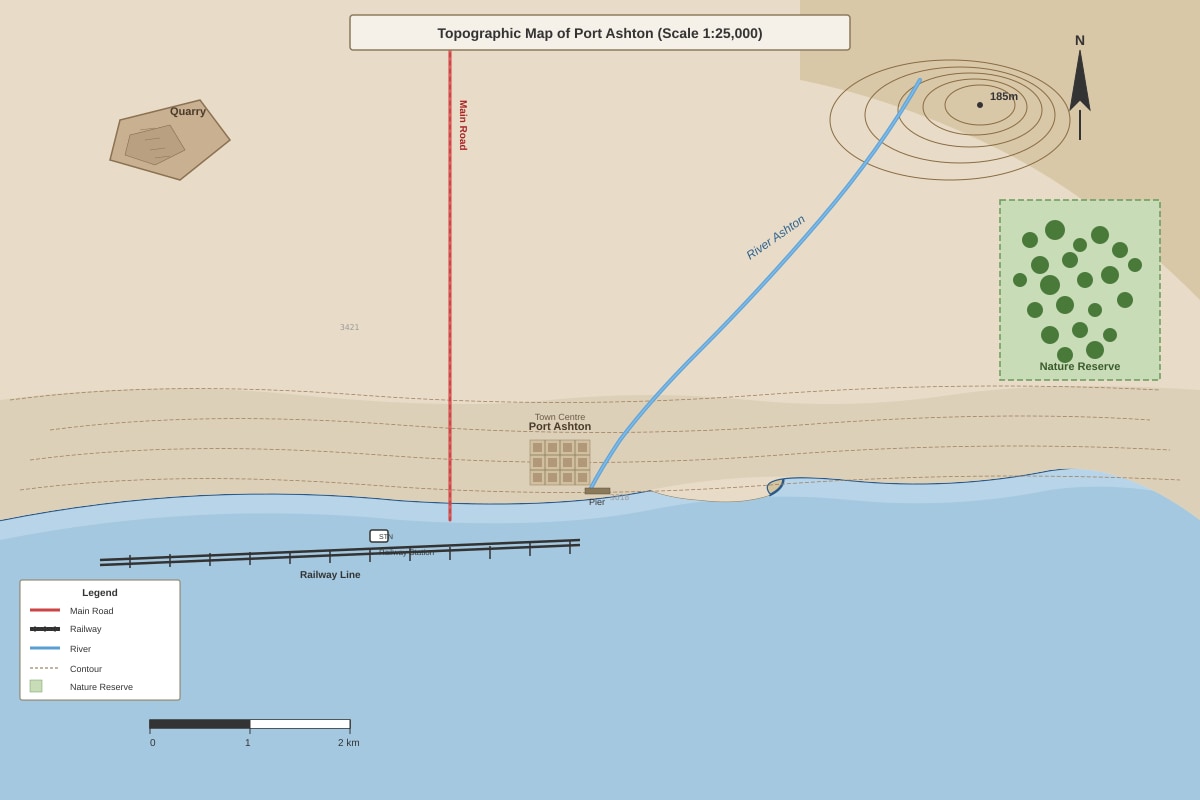
Generated map for this question.
1. State the four-figure grid reference of the quarry in the north-west of the map. [1]
2. Measure the straight-line distance, in kilometres, from the railway station (grid square 3421) to the pier at the river mouth (grid square 3618). [2]
3. Describe the relief of the land in the north-eastern part of the map extract. [3]
4. Using map evidence, explain two reasons why the town of Port Ashton developed at its present location. [4]
Reason 1: ________________________________________________________________________
Reason 2: ________________________________________________________________________
5. Identify the direction of flow of the main river. Using map evidence, explain one way you can tell this from the map. [2]
Direction: _________________________
Evidence: ________________________________________________________________________
Section B: Graph and Data Interpretation (14 marks)
Answer all questions in this section. Study the data provided carefully.
Fig. 2: Climate Data for Station X (Tropical Monsoon Climate)
| Month | Jan | Feb | Mar | Apr | May | Jun | Jul | Aug | Sep | Oct | Nov | Dec |
|---|---|---|---|---|---|---|---|---|---|---|---|---|
| Temp (°C) | 26 | 27 | 29 | 30 | 30 | 29 | 28 | 28 | 28 | 28 | 27 | 26 |
| Rainfall (mm) | 10 | 20 | 30 | 60 | 220 | 480 | 550 | 520 | 380 | 250 | 100 | 20 |
6. Calculate the annual temperature range for Station X. [1]
7. Calculate the total annual rainfall for Station X. [1]
8. Describe the pattern of rainfall shown in the data for Station X. [3]
9. Explain two reasons why Station X experiences a distinct wet and dry season. [4]
Reason 1: ________________________________________________________________________
Reason 2: ________________________________________________________________________
10. A student states, “The hottest months at Station X are also the wettest.” Using data from Fig. 2, evaluate the accuracy of this statement. [3]
11. Suggest one way the rainfall pattern at Station X might affect agricultural activities in the region. [2]
Section C: Data Response and Fieldwork Skills (14 marks)
Answer all questions in this section.
Fig. 3: Tourist Arrivals in Country Y by Region of Origin (2024)
| Region of Origin | Number of Tourists (millions) |
|---|---|
| Asia-Pacific | 12.5 |
| Europe | 4.2 |
| Americas | 2.8 |
| Middle East & Africa | 1.5 |
12. Using the data in Fig. 3, construct a pie chart to show the proportion of tourists to Country Y from each region. Show your calculations for the angle of each sector. [5]
Calculations:
Asia-Pacific: ____________________
Europe: ____________________
Americas: ____________________
Middle East & Africa: ____________________
Draw your pie chart in the space below. Label each sector clearly.
[Space for pie chart]
13. Identify the region that accounts for the largest share of tourists to Country Y. Suggest one reason for this pattern. [2]
Region: _________________________
Reason: _________________________________________________________________________
14. A student wants to investigate the environmental impact of tourism at a popular beach destination. State a suitable hypothesis for this investigation. [1]
15. Describe how the student could use systematic sampling to select survey sites along the beach. [3]
16. The student collected data on litter density at 10 sites. The results (pieces of litter per 100m²) were: 5, 8, 12, 7, 15, 9, 11, 6, 14, 13. Calculate the mean litter density. [2]
17. The student also recorded the distance of each site from the main tourist entrance. Suggest one way the student could present the relationship between litter density and distance from the entrance. [1]
END OF PAPER
Answers
TuitionGoWhere Practice Paper - Geography Secondary 3
Answer Key and Marking Scheme
Paper: Practice Paper 2 (Map, Graph, and Data Skills) Version: 2 of 5 Total Marks: 40
Section A: Map Reading and Interpretation (12 marks)
1. State the four-figure grid reference of the quarry in the north-west of the map. [1]
- Answer: 3224 (Accept 3124 or 3225 depending on exact map placement; any reasonable four-figure reference locating the quarry symbol in the NW).
- Marking: 1 mark for a correct four-figure reference.
2. Measure the straight-line distance, in kilometres, from the railway station (grid square 3421) to the pier at the river mouth (grid square 3618). [2]
- Answer: Approximately 3.5 km (accept 3.3 km to 3.7 km).
- Marking: 1 mark for correct measurement on the map (e.g., 14 cm), 1 mark for correct conversion using the scale (1:25,000 means 1 cm = 0.25 km; 14 cm × 0.25 = 3.5 km). Award partial credit for correct method with minor calculation error.
3. Describe the relief of the land in the north-eastern part of the map extract. [3]
- Answer: The north-eastern part is characterised by steep slopes and high elevation. There is a prominent hill with a spot height of 185 metres. The contour lines are closely spaced, indicating a steep gradient. The land slopes downwards towards the south and west.
- Marking: 1 mark for identifying high elevation (mentioning the 185m spot height or "high land"), 1 mark for describing steep slopes (reference to closely spaced contours), 1 mark for describing the direction of the slope or overall shape. Accept any three distinct, accurate observations.
4. Using map evidence, explain two reasons why the town of Port Ashton developed at its present location. [4]
- Answer:
- Reason 1 (Water supply/flat land): The town is located on flat land near the river mouth, as indicated by the widely spaced contour lines. This flat land is easier to build on, and the river provides a source of fresh water.
- Reason 2 (Transport/trade): The town is located on a bay, providing a natural harbour for boats (evidenced by the pier). The presence of a railway line and a main road also suggests good transport links, facilitating trade and movement.
- Marking: 2 marks for each reason (1 mark for the reason, 1 mark for specific map evidence). Accept other valid reasons such as defensive site (headland), bridging point, or proximity to resources (quarry). Maximum 4 marks.
5. Identify the direction of flow of the main river. Using map evidence, explain one way you can tell this from the map. [2]
- Answer:
- Direction: North-east to south-west (or from the hills in the NE towards the bay in the SW).
- Evidence: The river flows from higher land (contours in the NE) to lower land (the coast). / The river joins the sea at the bay, and rivers flow downhill to the sea. / The V-shape of the contour lines points upstream (towards the NE).
- Marking: 1 mark for the correct direction, 1 mark for a valid piece of map evidence.
Section B: Graph and Data Interpretation (14 marks)
6. Calculate the annual temperature range for Station X. [1]
- Answer: 4°C (30°C - 26°C = 4°C).
- Marking: 1 mark for the correct answer with unit. Accept 4°C.
7. Calculate the total annual rainfall for Station X. [1]
- Answer: 2640 mm (10+20+30+60+220+480+550+520+380+250+100+20 = 2640).
- Marking: 1 mark for the correct answer with unit. Accept 2640 mm.
8. Describe the pattern of rainfall shown in the data for Station X. [3]
- Answer: Station X experiences a distinct wet and dry season. Rainfall is very low from December to March (dry season), with the lowest rainfall in January (10 mm). Rainfall increases sharply from April, peaking in July (550 mm), and remains high until September, before decreasing rapidly from October. The wettest months are June to September.
- Marking: 1 mark for identifying the seasonal pattern (wet/dry seasons), 1 mark for quoting data to support the description (e.g., naming months and values), 1 mark for describing the trend of increase/decrease or identifying the peak. Accept any three distinct, data-supported points.
9. Explain two reasons why Station X experiences a distinct wet and dry season. [4]
- Answer:
- Reason 1 (Seasonal wind shift/Monsoon): Station X is in a tropical monsoon climate zone. In the wet season (summer months), winds blow from the ocean to the land, carrying large amounts of moisture, which leads to heavy rainfall. In the dry season (winter months), the wind direction reverses, blowing from the dry continental interior to the sea, bringing little moisture.
- Reason 2 (ITCZ movement): The Inter-Tropical Convergence Zone (ITCZ) is a belt of low pressure near the equator. It migrates seasonally with the overhead sun. When the ITCZ is over Station X, it brings heavy convectional rainfall. When it moves away, the region experiences dry conditions.
- Marking: 2 marks for each well-explained reason. Award 1 mark for a basic identification and 2 marks for a full explanation linking cause to the seasonal rainfall pattern. Maximum 4 marks.
10. A student states, “The hottest months at Station X are also the wettest.” Using data from Fig. 2, evaluate the accuracy of this statement. [3]
- Answer: The statement is partially accurate but not entirely true. The hottest months are April and May (both 30°C). While rainfall increases in these months (60 mm and 220 mm), they are not the wettest. The wettest months are July (550 mm) and August (520 mm), when the temperature is slightly lower at 28°C. Therefore, the peak rainfall occurs slightly after the peak temperature.
- Marking: 1 mark for identifying the hottest months and their rainfall, 1 mark for identifying the wettest months and their temperature, 1 mark for a clear evaluative judgement on the statement's accuracy. Accept well-reasoned alternative evaluations.
11. Suggest one way the rainfall pattern at Station X might affect agricultural activities in the region. [2]
- Answer: The distinct wet and dry season means farmers can only grow crops during the wet season when there is sufficient water (rain-fed agriculture). During the dry season, irrigation would be necessary for crop growth, which may be costly or unavailable. Alternatively, the heavy rainfall in the wet season could lead to flooding, damaging crops.
- Marking: 1 mark for identifying a valid effect (e.g., seasonal cropping, need for irrigation, flood risk), 1 mark for a brief explanation linking the rainfall pattern to the agricultural activity. Maximum 2 marks.
Section C: Data Response and Fieldwork Skills (14 marks)
12. Using the data in Fig. 3, construct a pie chart to show the proportion of tourists to Country Y from each region. Show your calculations for the angle of each sector. [5]
- Answer:
- Total tourists: 12.5 + 4.2 + 2.8 + 1.5 = 21.0 million
- Calculations:
- Asia-Pacific: (12.5 / 21.0) × 360° = 214.3° (accept 214°)
- Europe: (4.2 / 21.0) × 360° = 72.0°
- Americas: (2.8 / 21.0) × 360° = 48.0°
- Middle East & Africa: (1.5 / 21.0) × 360° = 25.7° (accept 26°)
- Pie chart: Should be accurately drawn with sectors proportional to the calculated angles. Each sector must be clearly labelled with the region name and percentage (optional but good practice).
- Marking: 1 mark for correct total, 1 mark for all four correct angle calculations, 1 mark for accurate sector drawing, 1 mark for correct labels, 1 mark for overall neatness and title. Deduct marks for significant inaccuracies in angles or missing labels.
13. Identify the region that accounts for the largest share of tourists to Country Y. Suggest one reason for this pattern. [2]
- Answer:
- Region: Asia-Pacific.
- Reason: Country Y is likely located in the Asia-Pacific region itself, so tourists from neighbouring countries find it closer, cheaper, and more convenient to travel there. / There are strong economic and cultural ties within the Asia-Pacific region encouraging travel.
- Marking: 1 mark for correct identification, 1 mark for a plausible reason. Accept any geographically sound reason.
14. A student wants to investigate the environmental impact of tourism at a popular beach destination. State a suitable hypothesis for this investigation. [1]
- Answer: "Litter density increases with proximity to the main tourist entrance." / "Water quality is lower at sites with higher tourist density." / "There is a significant difference in vegetation cover between high-traffic and low-traffic areas of the beach."
- Marking: 1 mark for a clear, testable statement that links an environmental variable to a tourism variable. It must not be a question.
15. Describe how the student could use systematic sampling to select survey sites along the beach. [3]
- Answer: The student would first decide on a sampling interval (e.g., every 50 metres). Starting from a random point at one end of the beach, they would then select survey sites at regular intervals along the beach (e.g., at 0m, 50m, 100m, 150m, etc.) until the entire length is covered. This ensures an evenly spaced, representative sample of the whole beach.
- Marking: 1 mark for defining a clear interval, 1 mark for describing the process of applying the interval from a starting point, 1 mark for explaining that this covers the whole area evenly. Maximum 3 marks.
16. The student collected data on litter density at 10 sites. The results (pieces of litter per 100m²) were: 5, 8, 12, 7, 15, 9, 11, 6, 14, 13. Calculate the mean litter density. [2]
- Answer: Sum = 5+8+12+7+15+9+11+6+14+13 = 100. Mean = 100 / 10 = 10 pieces of litter per 100m².
- Marking: 1 mark for correct sum (100), 1 mark for correct division and answer with units. Award full marks for correct answer only.
17. The student also recorded the distance of each site from the main tourist entrance. Suggest one way the student could present the relationship between litter density and distance from the entrance. [1]
- Answer: A scatter graph (or scatter plot).
- Marking: 1 mark for "scatter graph" or "scatter plot". Accept "line graph" if the student explains plotting distance on the x-axis and litter density on the y-axis.
END OF ANSWER KEY
Free quiz and exam paper access
Enter your details to view this paper
Your access is remembered on this device.