AI Generated Exam Paper
Secondary 3 Geography Practice Paper 1
Free Sec 3 Geography Practice Paper 1, HY3 AI version, with questions, answers, and O Level-style practice for Singapore students.
These static practice materials are generated from the site's syllabus and paper-generation workflow, with source and model context shown so students and parents can evaluate the material before use.
Questions
TuitionGoWhere Practice Paper - Geography Secondary 3
TuitionGoWhere Practice Paper (AI)
Version: 1 of 5
Subject: Geography
Level: Secondary 3
Paper: Practice Paper (Topic: Map Graph Data Skills)
Duration: 45 minutes
Total Marks: 40
Name: ________________________
Class: ________
Date: ____________
Instructions:
- This practice paper tests map, graph, and data skills based on the Secondary 3 Geography syllabus.
- Answer all questions in the spaces provided.
- Section A: 10 short questions (1 mark each). Section B: 6 data-response questions (3 marks each). Section C: 4 applied questions (5 marks each).
- Use the extracted data and figures to support your answers.
Section A (10 marks)
Answer all questions. Each question carries 1 mark.
1. On a topographic map, a contour line joining points of equal height is used to show ______________.
2. A bar graph that shows changes over time is better replaced by a ______________ graph.
3. In a pie chart, the whole circle represents ______________%.
4. The title of a data table should state the ______________, place, and year.
5. A map scale of 1:25 000 means 1 cm on the map equals ______________ cm on the ground.
6. The x-axis on a line graph normally shows the ______________ variable.
7. A climate graph combines rainfall (bars) and ______________ (line).
8. To find the mean of 5 values, you divide the sum by ______________.
9. A choropleth map uses ______________ to show data differences across areas.
10. A legend on a map explains the ______________ used.
Section B (18 marks)
Answer all questions. Each question carries 3 marks.
11. Study the table below showing visitor numbers to a park.
| Month | Visitors |
|---|---|
| Jan | 120 |
| Feb | 150 |
| Mar | 180 |
Calculate the mean number of visitors. Show your working.
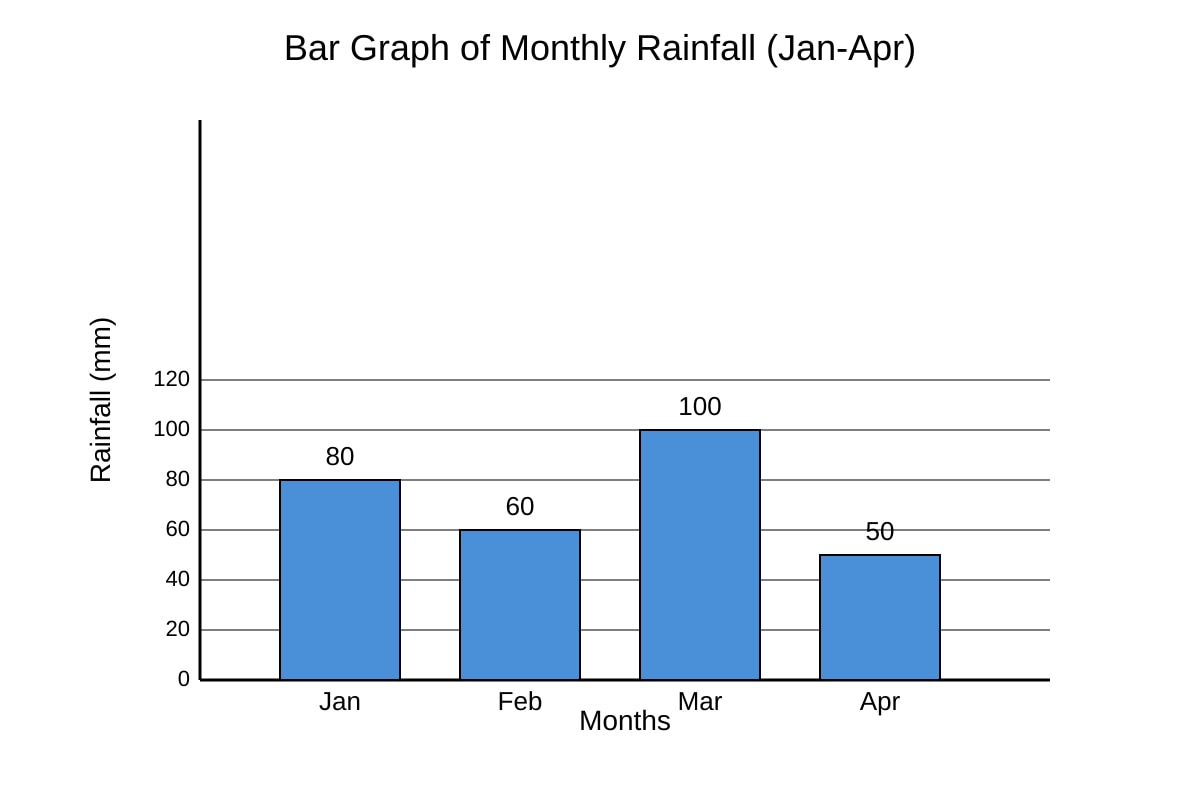
12. The bar graph in the figure below shows rainfall for 4 months.
Image pending generation: graph for Q12.
Which month had the highest rainfall? State one way the graph could be improved.
13. A map has a scale of 1:50 000. Two schools are 4 cm apart on the map. Calculate the actual distance in km.
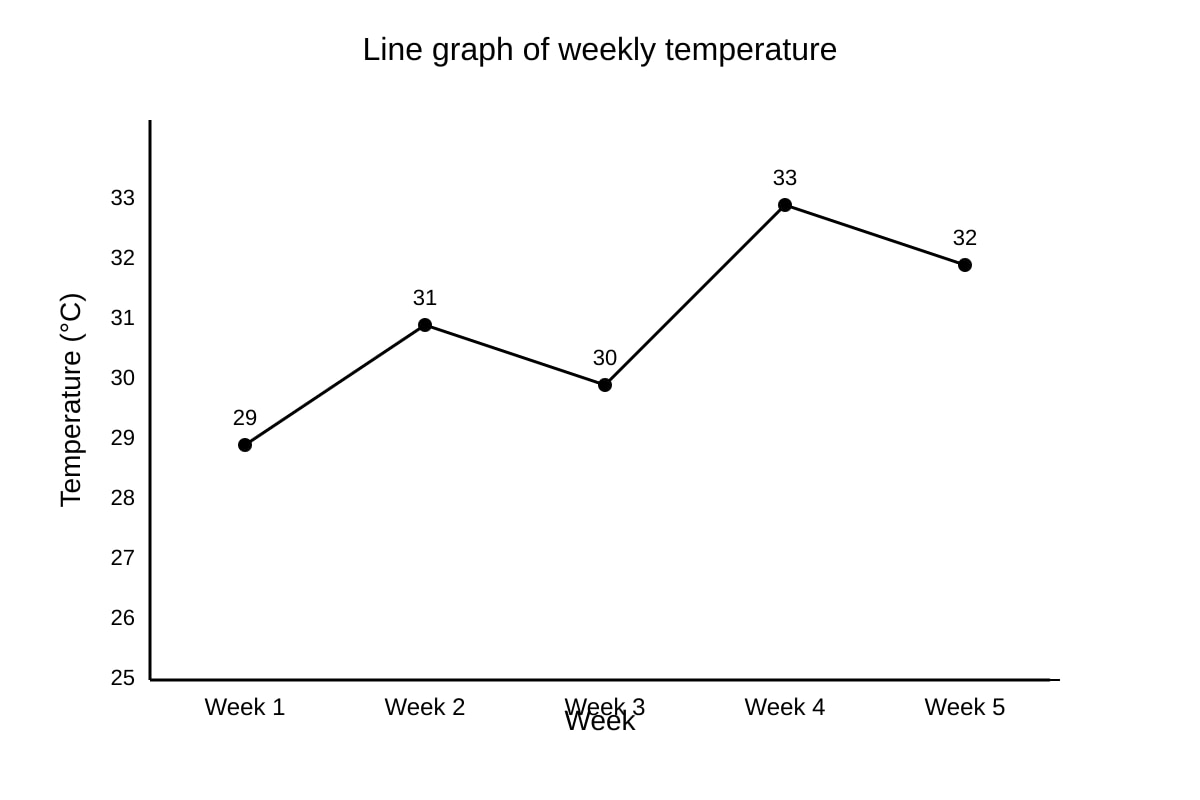
14. Study the line graph of temperature.
Image pending generation: graph for Q14.
Describe the trend from Week 1 to Week 4.
15. The pie chart shows land use: Housing 40%, Park 25%, Industry 20%, Others 15%. Which two uses cover more than half the area?
16. A student collected data using a questionnaire at a shopping mall. Give one reason why this is a convenience sample.
Section C (12 marks)
Answer all questions. Each question carries 5 marks.
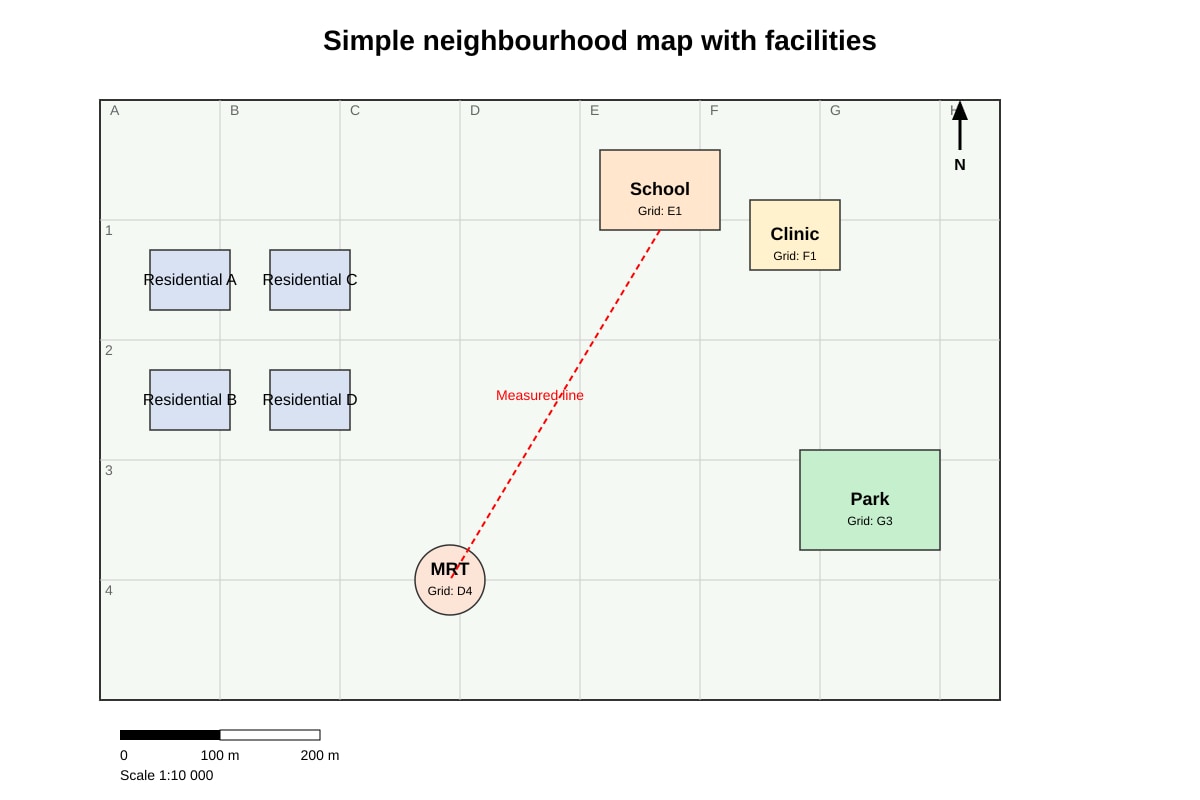
17. Study the map extract and table.
Image pending generation: map for Q17.
Using the map, explain how you would calculate the straight-line distance from School to MRT and why map scale is important. (5 marks)
18. The table shows population and waste (tonnes) for 3 towns.
| Town | Population | Waste |
|---|---|---|
| X | 20 000 | 500 |
| Y | 35 000 | 900 |
| Z | 50 000 | 1 200 |
Draw a suitable graph to compare waste against population. State the graph type and one conclusion. (5 marks)
19. A climate graph shows rainfall bars and temperature line for Singapore. Describe two skills needed to read it and state one pattern you would expect. (5 marks)
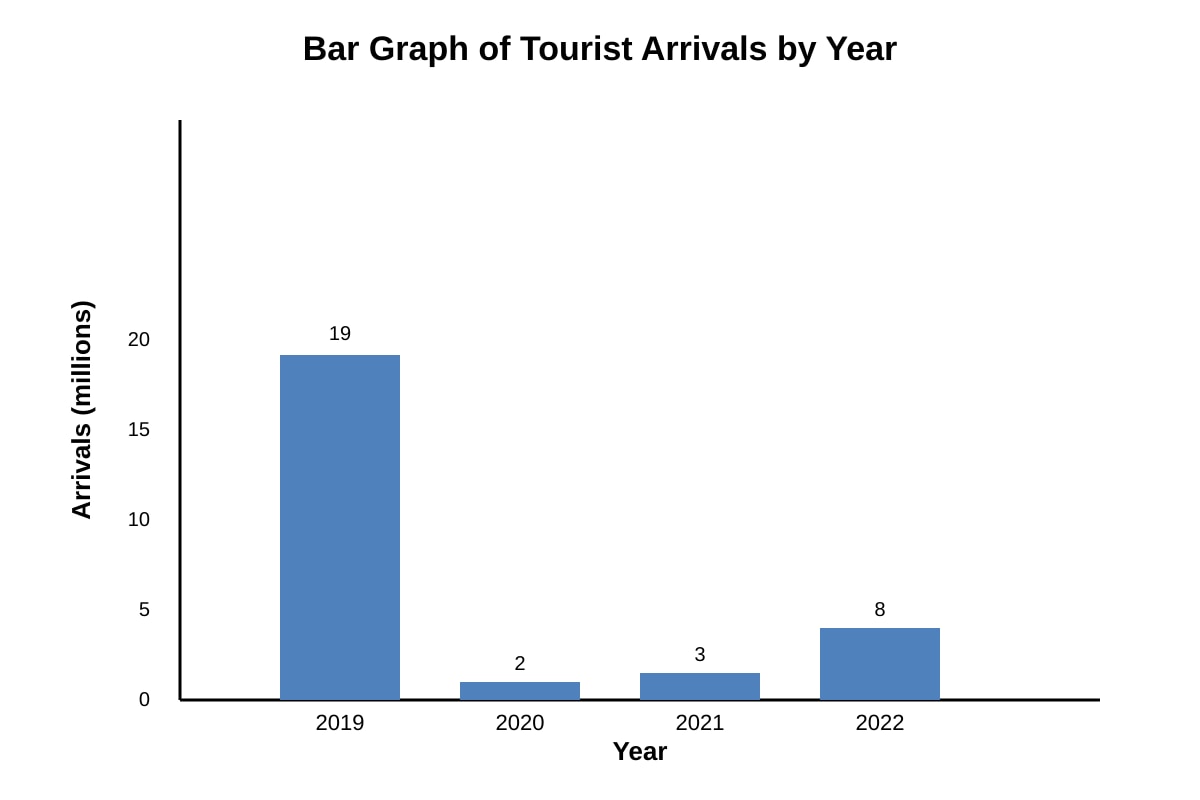
20. You are given a bar graph of tourist arrivals from 2019-2022.
Image pending generation: graph for Q20.
Explain how you would present this data in a written report using geographical methods. (5 marks)
Answers
TuitionGoWhere Practice Paper - Geography Secondary 3 (Answers)
Version: 1 of 5
Total Marks: 40
Section A (10 marks)
1. contour / height [1]
Teaching: Contour lines connect equal elevation; used to read relief.
2. line [1]
Teaching: Line graphs show continuous change over time better than bars.
3. 100 [1]
Teaching: Pie chart whole = 100% of data.
4. topic/variable [1]
Teaching: Good table title includes what, where, when.
5. 25 000 [1]
Teaching: Scale 1:25 000 → 1 cm map = 25 000 cm ground.
6. independent [1]
Teaching: X-axis is independent variable (e.g. time).
7. temperature [1]
Teaching: Climate graph = rainfall bars + temp line.
8. 5 [1]
Teaching: Mean = sum ÷ number of values (n=5).
9. colour shading [1]
Teaching: Choropleth uses shading to show spatial data.
10. symbols [1]
Teaching: Legend explains symbols/colours.
Section B (18 marks)
11. [3]
Working: (120+150+180) = 450; 450 ÷ 3 = 150.
Answer: Mean = 150 visitors.
Marks: 1 for sum, 1 for division, 1 for answer.
12. [3]
Answer: March (100 mm) highest [1]. Improvement: add data labels or title [2].
Teaching: Read tallest bar; graphs need clear title/labels.
13. [3]
Working: 4 cm × 50 000 = 200 000 cm [1]; = 2 000 m [1]; = 2 km [1].
Answer: 2 km.
14. [3]
Answer: Temperature increased from 29°C to 33°C (Week1-4) [2]; general rise [1].
Teaching: Describe trend using figures.
15. [3]
Answer: Housing (40%) + Park (25%) = 65% > 50% [2]; or Housing+Industry=60% [1].
Teaching: Add shares to exceed half.
16. [3]
Answer: Because respondents were chosen by ease of access at mall, not random [3].
Teaching: Convenience sample = readily available people.
Section C (12 marks)
17. [5]
Marking: Measure map distance with ruler (1); apply scale 1:10 000 (1); convert to ground distance (1); scale shows real-world ratio (1); explain accuracy need (1).
Answer: Use ruler on map, multiply by 10 000, convert cm to m; scale essential for real distance.
18. [5]
Marking: Graph type = scatter or bar (1); draw with 2 axes (1); conclude waste rises with population (2); neat (1).
Answer: Scatter plot; positive relationship.
19. [5]
Marking: Skill1 read bars (rain) (1); Skill2 read line (temp) (1); Pattern: high rain all year (3).
Answer: Skills: interpret dual axis; pattern: equatorial uniform climate.
20. [5]
Marking: State graph used (1); describe drop in 2020 (2); mention recovery (1); use methods (1).
Answer: Report with bar graph, note COVID drop, later rebound using data.
Free quiz and exam paper access
Enter your details to view this paper
Your access is remembered on this device.