AI Generated Quiz
Secondary 3 Elementary Mathematics Calculus Quiz
Free Sec 3 E Maths Calculus quiz, Qwen3.7 AI version, with questions, answers, and O Level-style practice for Singapore students.
These static practice materials are generated from the site's syllabus and paper-generation workflow, with source and model context shown so students and parents can evaluate the material before use.
Questions
Secondary 3 Elementary Mathematics Quiz - Estimation of Gradients
Name: __________________________
Class: __________________________
Date: __________________________
Score: ________ / 40
Duration: 45 Minutes
Total Marks: 40
Instructions:
- Answer all questions.
- Write your answers in the spaces provided.
- All non-exact numerical answers must be correct to 3 significant figures, unless otherwise specified.
- Calculators may be used.
- Note: This topic covers the estimation of gradients of curves by drawing tangents (Syllabus Item 6.11). It does not cover differentiation or integration formulas.
Section A: Basic Concepts and Linear Gradients (Questions 1–5)
[10 Marks]
1. State the formula for the gradient m of a straight line passing through two points (x1,y1) and (x2,y2).
[1]
2. Calculate the gradient of the line segment joining the points A(2,5) and B(6,13).
[1]
3. A straight line has a gradient of −3 and passes through the point (1,4). Find the y-coordinate when x=3.
[2]
4. Explain in one sentence what is meant by the "gradient of a curve" at a specific point.
[1]
5. If a curve is getting steeper as x increases, is the magnitude of the gradient increasing or decreasing?
[1]
Section B: Drawing Tangents and Estimating Gradients (Questions 6–15)
[20 Marks]
6. Describe the geometric relationship between a tangent to a curve at point P and the curve itself at that point.
[1]
7. To estimate the gradient of a curve at x=a, we draw a tangent at that point. Why is it important to use a sharp pencil and a long ruler when drawing this tangent?
[1]
8. You have drawn a tangent to a curve at point P. You identify two points on this tangent line: (2,10) and (6,2). Calculate the estimated gradient of the curve at point P.
[2]
9. Consider the graph of y=x2. At the point where x=2, the tangent passes through (2,4) and approximately (3,8). Estimate the gradient at x=2.
[2]
10.
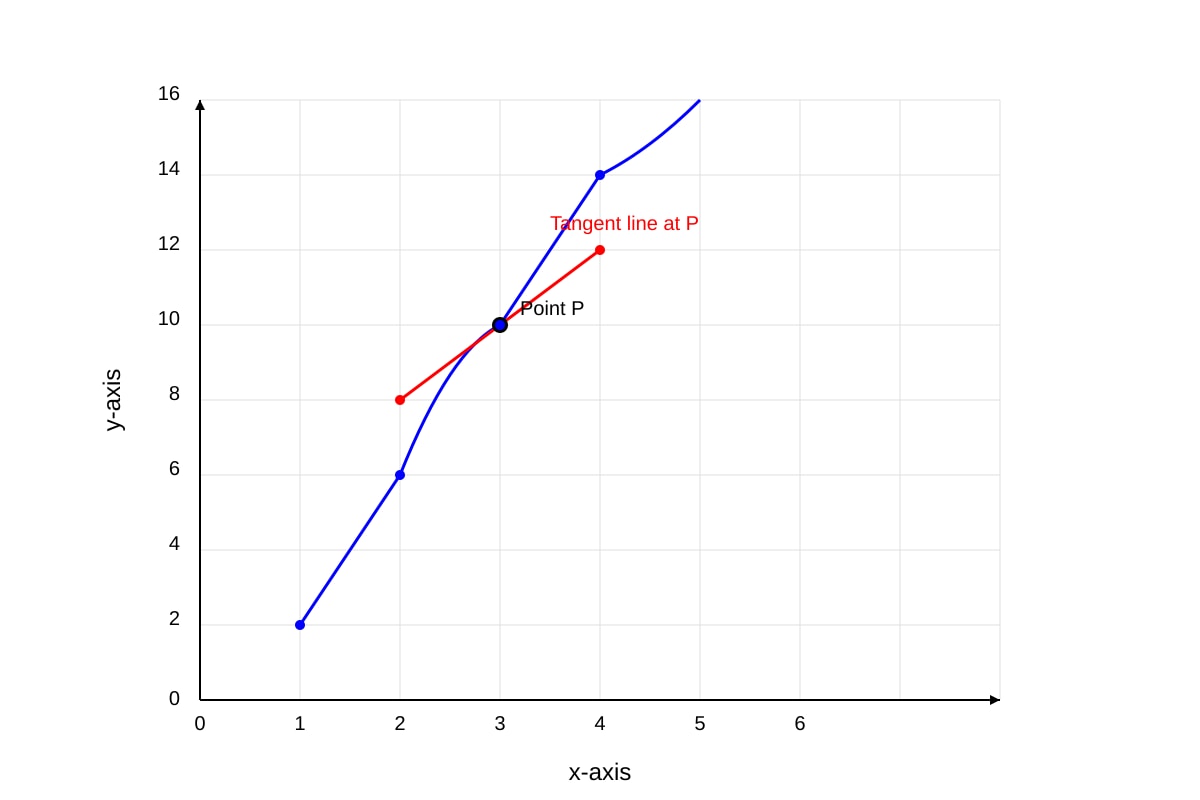
Generated graph for Q10.
Refer to the graph above. The straight line shown is the tangent to the curve at x=3.
(a) Read the coordinates of two clear points on the tangent line (not the curve) to calculate its gradient.
[2]
(b) Hence, state the estimated gradient of the curve at x=3.
[1]
11.
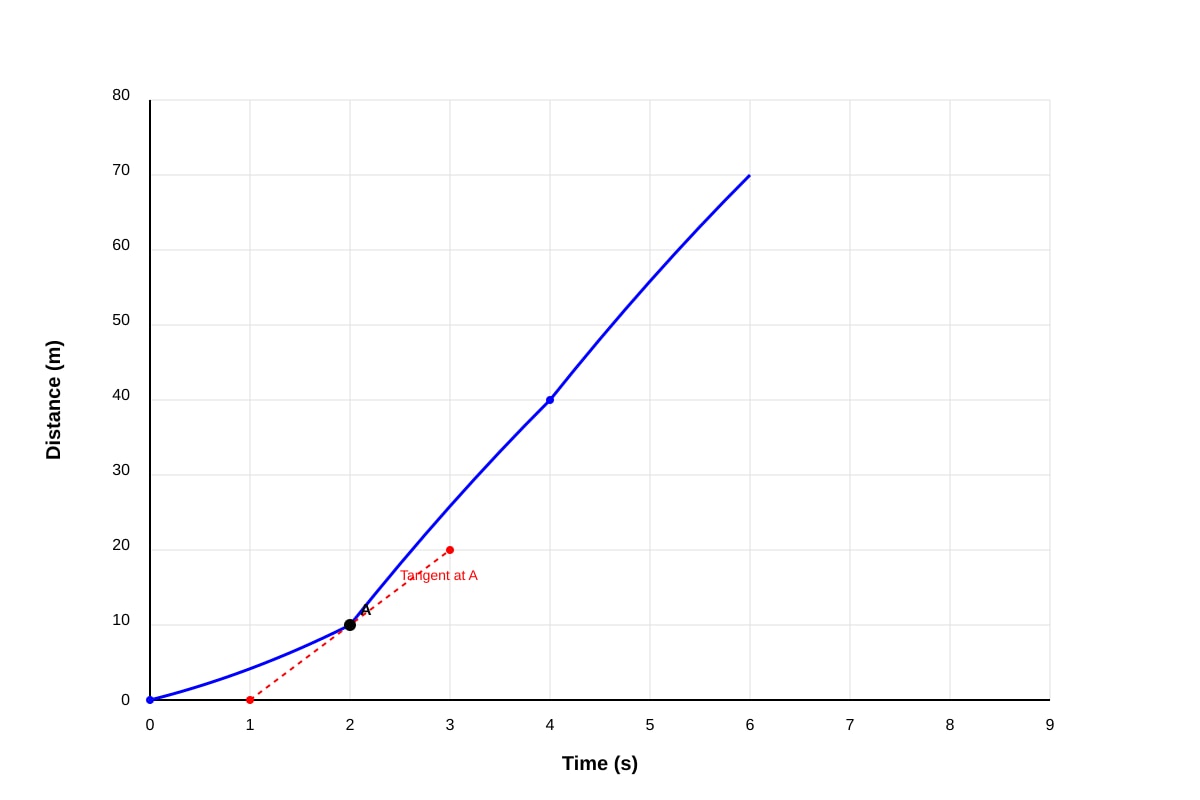
Generated graph for Q11.
The graph above shows the distance travelled by a cyclist over time.
(a) Draw a tangent to the curve at t=2 seconds. (Assume the line shown in the placeholder is the correct tangent for calculation purposes). Using the points (1,0) and (3,20) which lie on the tangent, calculate the gradient.
[2]
(b) What physical quantity does this gradient represent?
[1]
12. A student estimates the gradient of a curve at x=4 by drawing a chord (a line joining two points on the curve) instead of a tangent. The points used are (3,9) and (5,25).
(a) Calculate the gradient of this chord.
[2]
(b) Is this method likely to be more or less accurate than drawing a tangent for finding the instantaneous gradient at x=4? Explain briefly.
[1]
13.
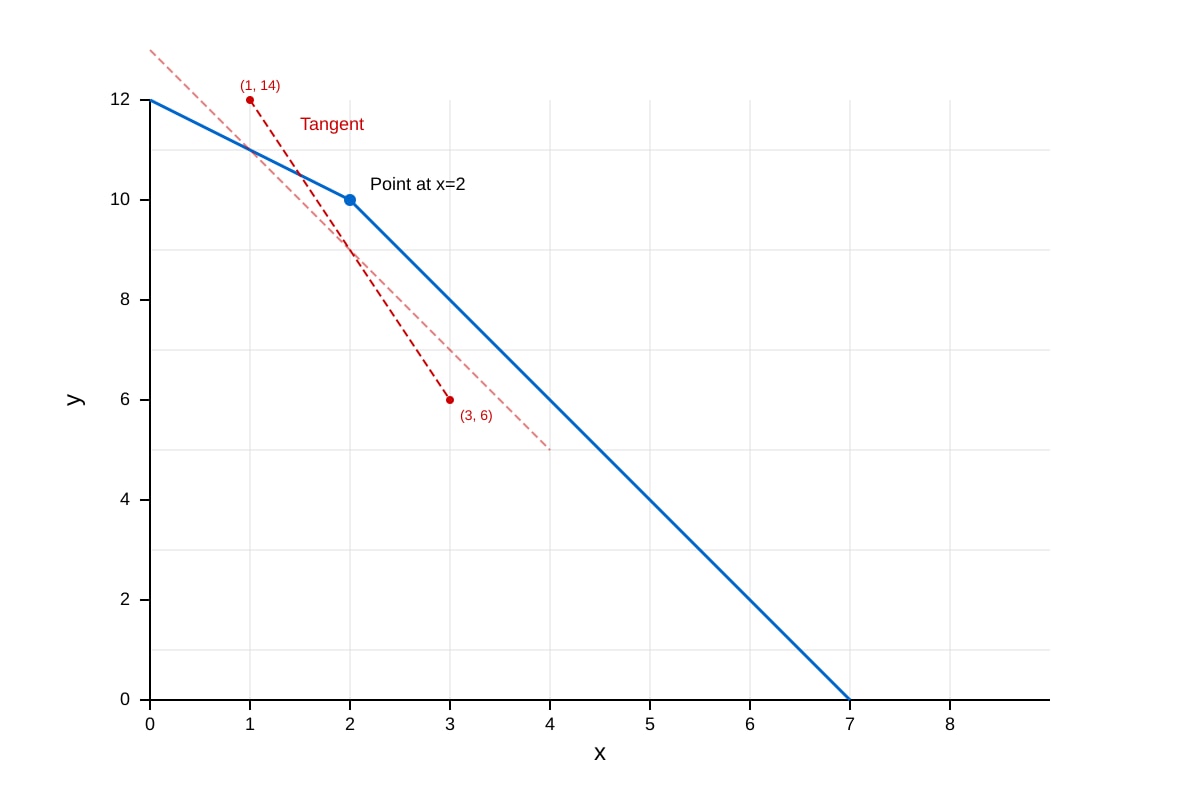
Generated graph for Q13.
Refer to the graph above.
(a) Determine the sign of the gradient at x=2 (positive or negative).
[1]
(b) Calculate the exact value of the gradient using the points (1,14) and (3,6) on the tangent.
[2]
14. Why might different students obtain slightly different values when estimating the gradient of the same curve at the same point by drawing tangents?
[1]
15. You are given the graph of y=x12 for x>0. At x=2, y=6. A tangent is drawn. It appears to pass through (0,12) and (4,0).
Calculate the estimated gradient at x=2 using these intercepts.
[2]
Section C: Application and Interpretation (Questions 16–20)
[10 Marks]
16. The graph below shows the temperature of a cup of coffee cooling down over time.
Image pending generation: graph for Q16.
(a) Calculate the rate of cooling at t=5 minutes using the tangent points (0,80) and (10,20).
[2]
(b) Explain why the rate of cooling changes as time increases, referring to the shape of the curve.
[1]
17. A ball is thrown vertically upwards. Its height h meters at time t seconds is given by a curve.
At t=1, the tangent is horizontal.
What is the gradient of the tangent at t=1?
[1]
18.
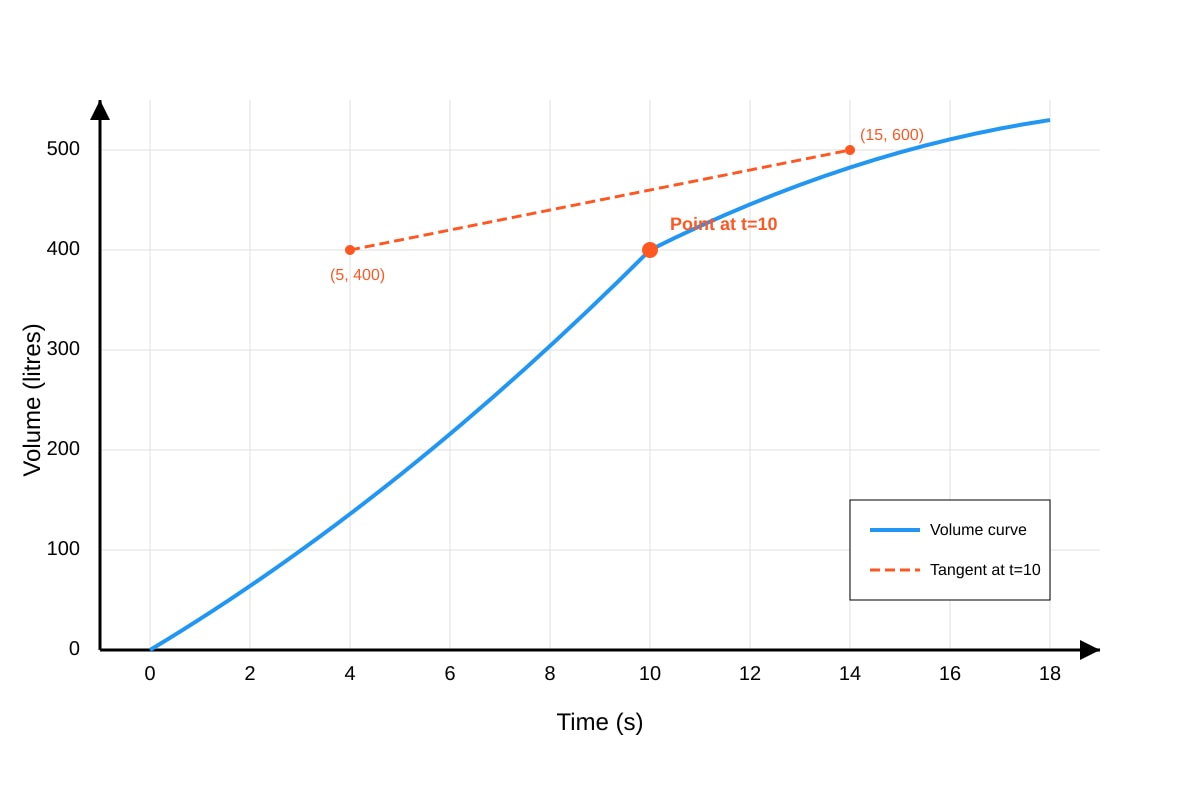
Generated graph for Q18.
Refer to the graph above showing the volume of water in a tank.
(a) Estimate the rate at which water is entering the tank at t=10 seconds.
[2]
(b) Is the rate of flow increasing or decreasing at this time? Justify your answer by looking at the steepness of the curve.
[1]
19. A company's profit P (in thousands) depends on the number of items sold x. The graph of P against x is a curve.
At x=100, the gradient of the tangent is 0.5.
Interpret the meaning of this gradient in the context of the problem.
[2]
20. Sketch a simple curve where the gradient is:
(a) Positive and constant.
(b) Positive and increasing.
(c) Zero.
Label each sketch clearly.
[3]
*** End of Quiz ***
Answers
Answer Key: Secondary 3 Elementary Mathematics Quiz - Estimation of Gradients
Total Marks: 40
Section A: Basic Concepts and Linear Gradients
1. Formula for gradient: m=x2−x1y2−y1 [1 mark] for correct formula.
2. Calculation: m=6−213−5=48=2 [1 mark] for correct answer.
3. Gradient m=−3. Equation: y−y1=m(x−x1). y−4=−3(x−1) When x=3: y−4=−3(3−1) y−4=−3(2) y−4=−6 y=−2 [1 mark] for substitution/working, [1 mark] for correct answer −2.
4. The gradient of a curve at a specific point is the gradient of the tangent to the curve at that point. It represents the instantaneous rate of change. [1 mark] for mentioning "tangent" or "instantaneous rate of change".
5. Increasing. [1 mark].
Section B: Drawing Tangents and Estimating Gradients
6. The tangent touches the curve at exactly one point in the immediate vicinity and has the same direction (gradient) as the curve at that point. [1 mark] for "touches at one point" or "same direction/gradient".
7. To minimize human error in drawing the line. A small error in the angle of the tangent leads to a large error in the calculated gradient, especially if the points chosen are close together. [1 mark] for referencing accuracy/error reduction.
8. Points: (2,10) and (6,2). m=6−22−10=4−8=−2 [1 mark] for substitution, [1 mark] for answer −2.
9. Points: (2,4) and (3,8). m=3−28−4=14=4 [1 mark] for substitution, [1 mark] for answer 4.
10. (a) Points on tangent: (2,5) and (4,13). m=4−213−5=28=4 [1 mark] for reading coordinates correctly from placeholder description, [1 mark] for calculation. (b) The estimated gradient is 4. [1 mark].
11. (a) Points on tangent: (1,0) and (3,20). m=3−120−0=220=10 [1 mark] for substitution, [1 mark] for answer 10. (b) Speed (or Velocity). [1 mark]. Note: Gradient of distance-time graph is speed.
12. (a) Points: (3,9) and (5,25). m=5−325−9=216=8 [1 mark] for substitution, [1 mark] for answer 8. (b) Less accurate. A chord gives the average gradient over an interval, whereas a tangent gives the instantaneous gradient at a specific point. [1 mark] for "less accurate" and brief reason.
13. (a) Negative. (The line goes down from left to right). [1 mark]. (b) Points: (1,14) and (3,6). m=3−16−14=2−8=−4 [1 mark] for substitution, [1 mark] for answer −4.
14. Drawing a tangent by eye is subjective. Different students may draw the line at slightly different angles, leading to different coordinate readings and thus different gradient calculations. [1 mark] for referencing subjectivity/drawing error.
15. Points: (0,12) and (4,0). m=4−00−12=4−12=−3 [1 mark] for substitution, [1 mark] for answer −3.
Section C: Application and Interpretation
16. (a) Points: (0,80) and (10,20). m=10−020−80=10−60=−6 The rate of cooling is 6∘C/min (magnitude). The gradient is −6. [1 mark] for calculation, [1 mark] for correct value. (b) The curve becomes less steep (flatter) as time increases. This means the magnitude of the gradient decreases, so the rate of cooling slows down as the coffee approaches room temperature. [1 mark] for linking flatness to slower rate.
17. 0. [1 mark]. Note: Horizontal lines have zero gradient. This corresponds to the maximum height.
18. (a) Points: (5,400) and (15,600). m=15−5600−400=10200=20 Rate is 20 litres/second. [1 mark] for substitution, [1 mark] for answer 20. (b) Decreasing. The curve is concave down (getting flatter), which means the gradient of the tangent is getting smaller. [1 mark] for "decreasing" with justification.
19. The gradient represents the marginal profit. A gradient of 0.5 means that at the sales level of 100 items, selling one additional item will increase the profit by approximately \0.5thousand(or$500$). [1 mark] for identifying it as rate of change of profit, [1 mark] for correct interpretation of units/value.
20. (a) A straight line sloping upwards. (b) A curve sloping upwards and getting steeper (concave up, like y=x2 for x>0). (c) A horizontal straight line. [1 mark] for each correct sketch.
Free quiz and exam paper access
Enter your details to view this paper
Your access is remembered on this device.