From Real Exams Quiz
Secondary 3 Elementary Mathematics Statistics Probability Quiz
Free Sec 3 E Maths Statistics quiz, Kimi2.6 Exam version, with questions, answers, and O Level-style practice for Singapore students.
These static practice materials are generated from the site's syllabus and paper-generation workflow, with source and model context shown so students and parents can evaluate the material before use.
Questions
Secondary 3 Elementary Mathematics Quiz - Statistics Probability
Name: _________________________ Class: __________ Date: __________
Duration: 45 minutes Total Marks: 40 marks
Instructions: Answer all questions. Show all working clearly. Non-exact numerical answers should be given correct to 2 significant figures, unless stated otherwise.
Section A: Data Analysis and Measures of Central Tendency (Questions 1–5, 10 marks)
1. [2 marks]
The masses of 7 watermelons are given below, in kg.
5.2, 6.8, 4.9, 7.3, 5.5, 6.2, 5.8
Find the mean mass.
Working space:
Answer: _________ kg
2. [2 marks]
The following scores are obtained by a student in 8 mathematics tests:
72, 68, 75, 68, 80, 72, 68, 85
Find the mode and the median of these scores.
Working space:
Mode: _________ Median: _________
3. [2 marks]
A group of 20 students sat for a Science test. The mean mark was 64. Another group of 30 students sat for the same test. The mean mark of this second group was 72.
Calculate the mean mark of all 50 students.
Working space:
Answer: _________
4. [2 marks]
The table shows the distribution of the number of books read by a class of 25 students during the June holidays.
| Number of books | 0 | 1 | 2 | 3 | 4 | 5 |
|---|---|---|---|---|---|---|
| Number of students | 3 | 5 | 8 | 5 | 3 | 1 |
Find the median number of books read.
Working space:
Answer: _________ books
5. [2 marks]
The mean of five numbers is 12. When a sixth number is added, the mean becomes 14.
Find the sixth number.
Working space:
Answer: _________
Section B: Data Representation and Interpretation (Questions 6–10, 10 marks)
6. [2 marks]
The pie chart below shows how 120 students travel to school.
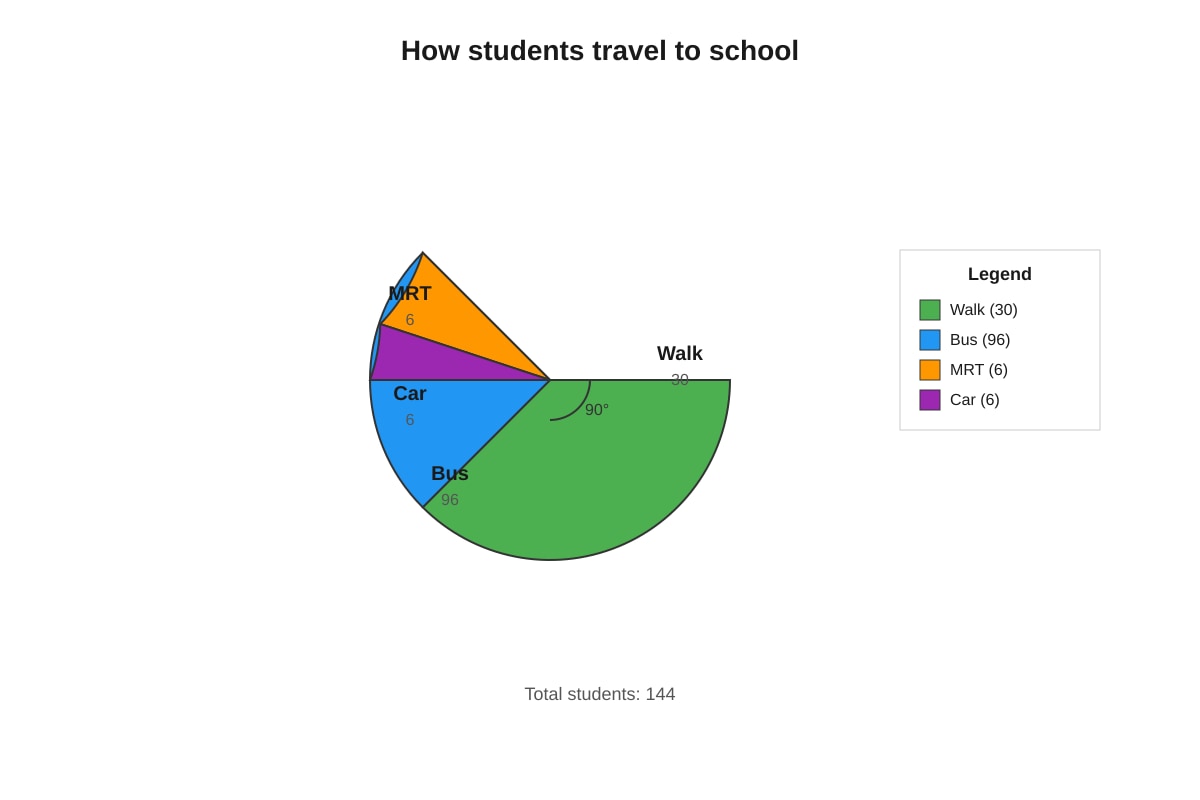
Generated chart for Q6.
How many students travel by bus?
Working space:
Answer: _________ students
7. [2 marks]
The cumulative frequency curve below shows the distribution of marks scored by 80 students in a test.
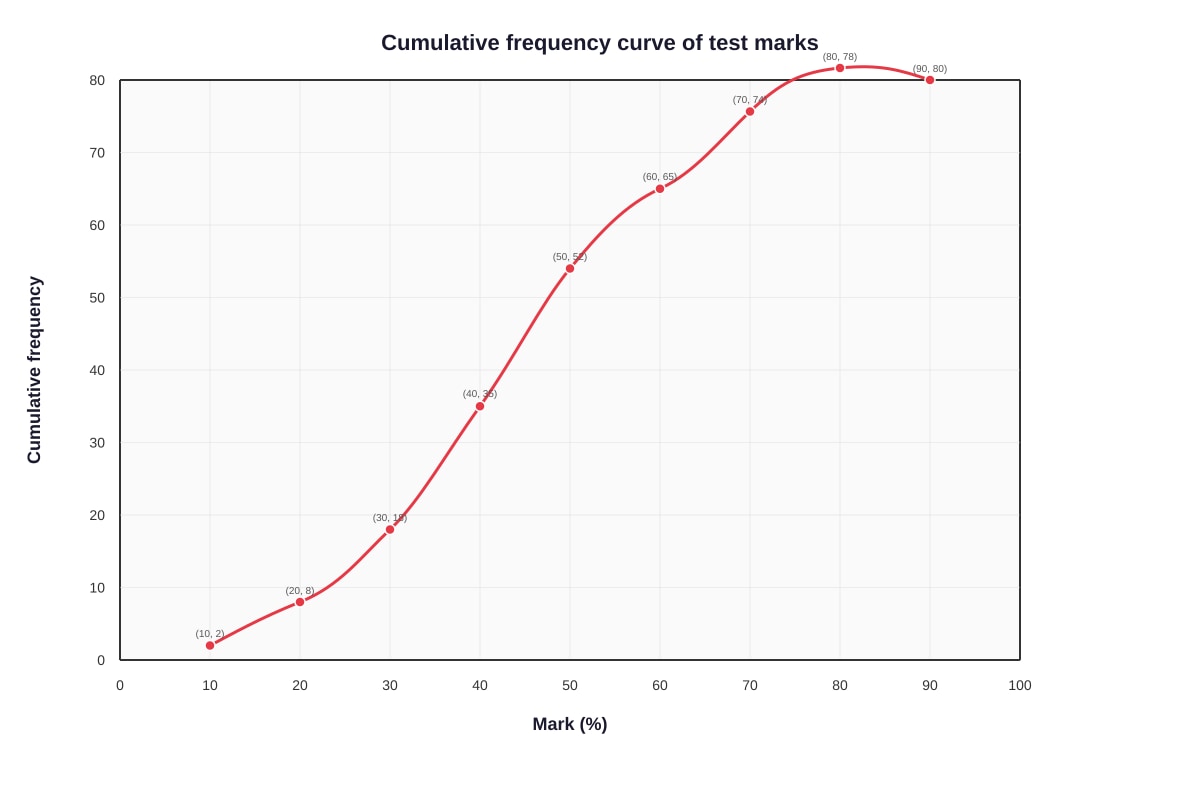
Generated graph for Q7.
Use your curve to estimate
(a) the median mark, [1]
(b) the interquartile range. [1]
8. [2 marks]
The stem-and-leaf diagram below shows the ages of members in a chess club.
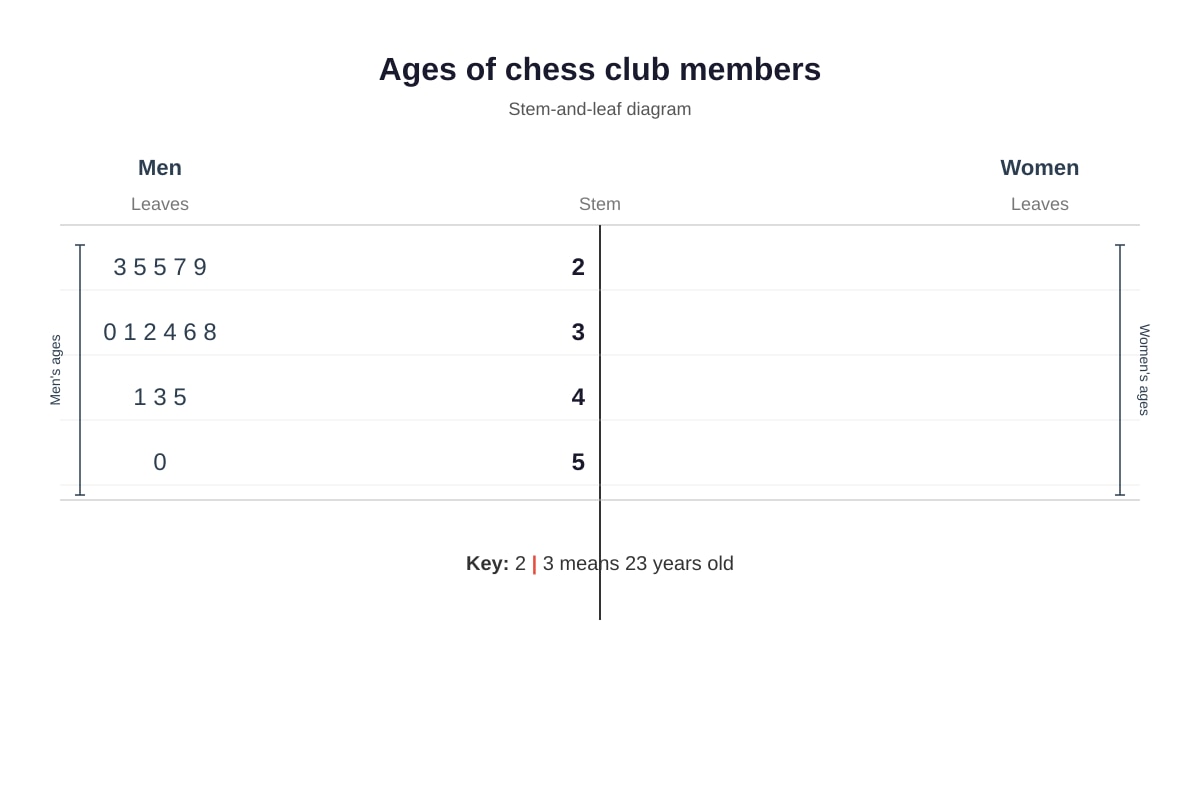
Generated diagram for Q8.
Find
(a) the range of the ages, [1]
(b) the percentage of members who are 40 years old or above. [1]
9. [2 marks]
The bar chart shows the number of goals scored by a football team in 20 matches.
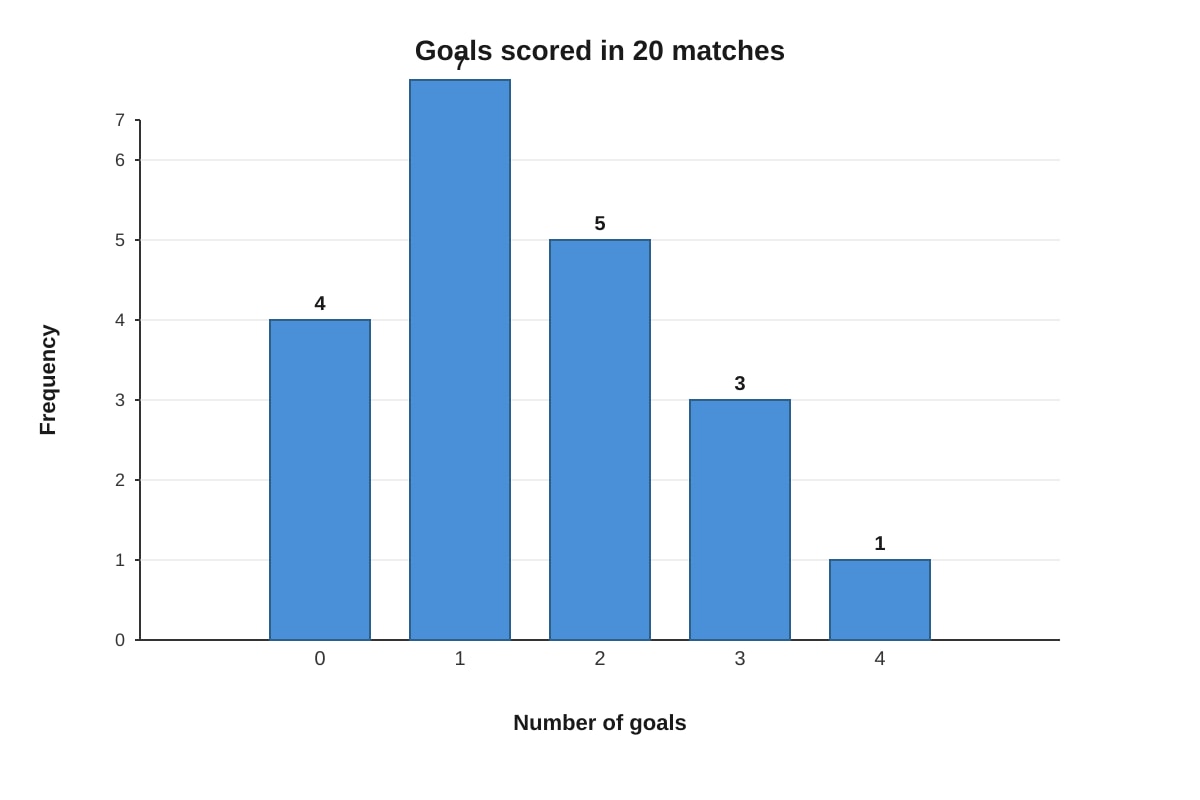
Generated chart for Q9.
Find the total number of goals scored by the team in these 20 matches.
Working space:
Answer: _________ goals
10. [2 marks]
The histogram below shows the distribution of masses of 50 newborn babies.
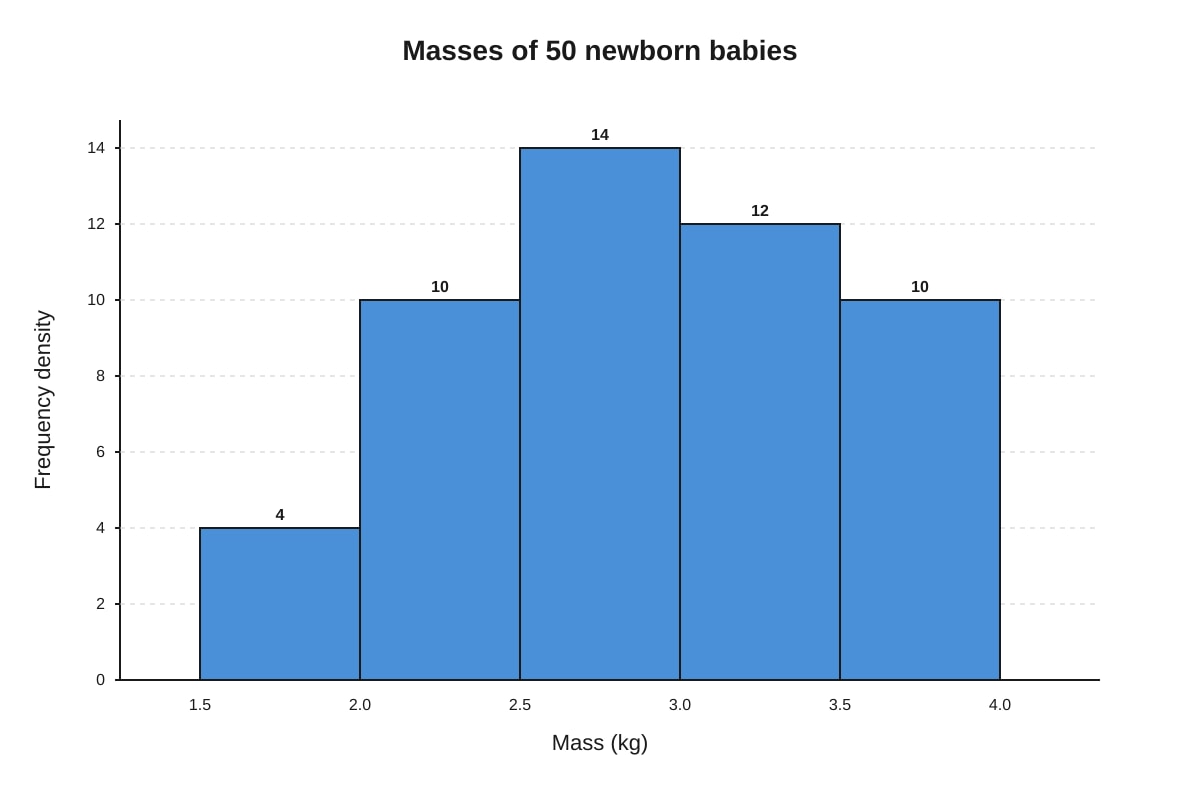
Generated graph for Q10.
Estimate the number of babies with mass less than 2.5 kg.
Working space:
Answer: _________ babies
Section C: Probability (Questions 11–15, 10 marks)
11. [2 marks]
A fair six-sided die is rolled and a fair coin is tossed at the same time.
List all the possible outcomes in the sample space.
Working space:
12. [2 marks]
A bag contains 5 red marbles, 3 blue marbles, and 2 green marbles. A marble is chosen at random from the bag.
Find the probability that the marble chosen is
(a) not red, [1]
(b) yellow. [1]
13. [2 marks]
The probability that it rains on any given day in November is 52.
There are 30 days in November.
Calculate the expected number of rainy days in November.
Working space:
Answer: _________ days
14. [2 marks]
Two fair four-sided dice, each numbered 1, 2, 3, 4, are thrown together.
Find the probability that the sum of the two numbers is
(a) equal to 5, [1]
(b) greater than 6. [1]
15. [2 marks]
The letters of the word "PROBABILITY" are written on separate identical cards and placed in a box.
A card is drawn at random from the box.
Find the probability of drawing
(a) a letter B, [1]
(b) a vowel. [1]
Section D: Statistical Problem Solving (Questions 16–20, 10 marks)
16. [2 marks]
The table shows the marks scored by 40 students in a Mathematics test.
| Mark (x) | 20 | 30 | 40 | 50 | 60 | 70 | 80 |
|---|---|---|---|---|---|---|---|
| Frequency (f) | 2 | 5 | 8 | 10 | 8 | 5 | 2 |
Calculate the standard deviation of the marks.
Working space:
Answer: _________
17. [2 marks]
The mean of a set of 10 numbers is 8. Two numbers, a and b, are added to the set. The mean of the 12 numbers is now 9.
Given that a=2b, find the value of a and of b.
Working space:
Answer: a = _________, b = _________
18. [2 marks]
The table shows the cumulative frequency distribution of the masses of 80 parcels.
| Mass (m grams) | m≤100 | m≤150 | m≤200 | m≤250 | m≤300 | m≤350 |
|---|---|---|---|---|---|---|
| Cumulative frequency | 4 | 16 | 40 | 60 | 72 | 80 |
(a) Find the percentage of parcels with mass greater than 200 grams. [1]
(b) A parcel is chosen at random. Find the probability that its mass is greater than 150 grams but not more than 250 grams. [1]
19. [2 marks]
A box contains n identical balls. Some are red and the rest are white. The probability of drawing a red ball is 73.
Two balls are drawn at random from the box without replacement.
Find, in terms of n,
(a) the number of red balls in the box, [1]
(b) the probability that both balls drawn are white. [1]
20. [2 marks]
A group of 120 students were asked how many hours they spent revising for their examinations. The results are shown in the table.
| Time (t hours) | 0≤t<2 | 2≤t<4 | 4≤t<6 | 6≤t<8 | 8≤t<10 |
|---|---|---|---|---|---|
| Number of students | 8 | 24 | 40 | 32 | 16 |
(a) Calculate an estimate of the mean time spent revising. [1]
(b) Draw a histogram to represent this information on the grid provided. [1]
Generated graph for Q20.
END OF QUIZ
Total marks: 40
Answers
Secondary 3 Elementary Mathematics Quiz Answers - Statistics Probability
Total Marks: 40 marks
Section A: Data Analysis and Measures of Central Tendency
1. [2 marks]
Method: The mean is the sum of all values divided by the number of values.
Sum = 5.2+6.8+4.9+7.3+5.5+6.2+5.8=41.7 kg
Mean = 741.7=5.957...
Answer: 6.0 kg (to 2 sig. fig.) or accept 5.96 kg if 3 sig. fig. required [2]
Common mistake: Forgetting to divide by 7, or rounding errors.
2. [2 marks]
Method: First arrange in ascending order: 68, 68, 68, 72, 72, 75, 80, 85
Mode: The value that appears most frequently = 68 [1]
Median: For 8 values, the median is the average of the 4th and 5th values = 272+72=2144=72 [1]
Teaching note: The mode is the most common value; the median for even count is the mean of the two middle values.
3. [2 marks]
Method: Use the formula: Combined mean = total number of valuestotal sum of all values
Total marks for first group = 20×64=1280
Total marks for second group = 30×72=2160
Combined total = 1280+2160=3440
Combined mean = 503440=68.8 [2]
Answer: 68.8 or 69 (to 2 sig. fig.) [2]
Common mistake: Averaging the two means directly as 264+72=68 without weighting by group size.
4. [2 marks]
Method: The median is the middle value when data is ordered. With 25 students, the median is the 13th value.
Cumulative frequencies: 0 books: 3, 1 book: 3+5=8, 2 books: 8+8=16, 3 books: 16+5=21...
The 13th student falls in the "2 books" category (positions 9 to 16).
Answer: 2 books [2]
Teaching note: For grouped/ungrouped discrete data, find which category contains the 2n+1-th value.
5. [2 marks]
Method:
Sum of five numbers = 5×12=60
Sum of six numbers = 6×14=84
Sixth number = 84−60=24 [2]
Answer: 24 [2]
Alternative method: Let the sixth number be x. Then 660+x=14, so 60+x=84, giving x=24.
Section B: Data Representation and Interpretation
6. [2 marks]
Method:
Total angle in pie chart = 360°
Walk sector = 90°, so remaining angle = 360° - 90° = 270°
Bus students = 96 out of 120
Fraction for bus = 12096=54
Check: This must correspond to angle = 12096×360°=288°
Wait — let me recalculate from the given data:
Actually, simpler: Students who walk = 360°90°×120=30 students
Remaining students = 120 - 30 = 90
MRT and Car are split equally: 45 each.
But we're told Bus = 96... Let me recheck the problem structure.
Given: Walk angle = 90°, Bus = 96 students, MRT and Car equal.
Students for Walk = 36090×120=30
Students for Bus = 96? But 30 + 96 = 126 > 120.
Re-reading: Perhaps Bus sector angle corresponds to 96 students in a proportional sense, or the values are: Walk 90°, and the remaining 270° split such that Bus has 96 students.
Actually with 120 students: If Walk = 30 students (from 90°), then Bus + MRT + Car = 90 students.
If Bus = 96 students stated directly, there's inconsistency.
Let me re-interpret: The "values" in the placeholder say Bus sector 96 students — this seems to be the intended direct information.
Answer: 96 students [2]
Teaching note: Read pie chart data carefully — some questions give angles, others give quantities directly.
7. [2 marks]
(a) Median: For 80 students, the median is at the 40th student. From curve, estimate 40% (or accept 38-42%) [1]
Reading from given points: At cumulative frequency 40, mark ≈ 38% or accept range 37-39% [1]
(b) Lower quartile (Q1) at 20th student ≈ 28%, Upper quartile (Q3) at 60th student ≈ 52%
IQR = Q3 - Q1 ≈ 52 - 28 = 24% or accept 22-26% [1]
Teaching note: The ogive gives percentiles directly. IQR measures the spread of the middle 50% of data.
8. [2 marks]
(a) Range = Maximum - Minimum = 50 - 23 = 27 years [1]
(b) Members 40 or above: 41, 43, 45, 50 = 4 members
Total members = 3+5+6+4+1 = let's count: 2|35579 is 5 values; 3|012468 is 6 values; 4|135 is 3 values; 5|0 is 1 value. Total = 5+6+3+1 = 15 members.
Wait, let me recount from stem: 23, 25, 25, 27, 29 (5); 30, 31, 32, 34, 36, 38 (6); 41, 43, 45 (3); 50 (1). Total = 15.
Members 40 or above: 41, 43, 45, 50 = 4 members
Percentage = 154×100=26.67%=26.7% (3 sig. fig.) or 27% (2 sig. fig.) [1]
Teaching note: In stem-and-leaf diagrams, count leaves carefully; each leaf represents one data point.
9. [2 marks]
Method: Multiply goals by frequency and sum.
Total goals = (0×4)+(1×7)+(2×5)+(3×3)+(4×1) = 0+7+10+9+4=30 [2]
Answer: 30 goals [2]
10. [2 marks]
Method: Frequency density = class widthfrequency, so frequency = frequency density × class width
Class width = 0.5 kg for all classes.
For 1.5-2.0: frequency = 4×0.5=2
For 2.0-2.5: frequency = 10×0.5=5
Mass less than 2.5 kg = babies in first two classes = 2+5=7 [2]
Answer: 7 babies [2]
Section C: Probability
11. [2 marks]
Method: Sample space = all possible combinations of die and coin.
{(1, H), (1, T), (2, H), (2, T), (3, H), (3, T), (4, H), (4, T), (5, H), (5, T), (6, H), (6, T)} [2]
Or in table form showing all 12 ordered pairs.
Teaching note: A sample space lists all possible outcomes of an experiment. "Fair" means equally likely outcomes.
12. [2 marks]
Total marbles = 5+3+2=10
(a) P(not red) = 103+2=105=21 [1]
Or: P(red) = 105=21, so P(not red) = 1−21=21 [1]
(b) P(yellow) = 0 [1] (There are no yellow marbles in the bag)
Teaching note: Probability of an impossible event is 0. "Not red" means blue or green.
13. [2 marks]
Method: Expected number = probability × number of trials
Expected rainy days = 52×30=560=12 [2]
Answer: 12 days [2]
Teaching note: Expected value = n×p where n = number of trials and p = probability of success.
14. [2 marks]
Total outcomes = 16 (each die has 4 faces)
Sample space: (1,1), (1,2), ..., (4,4) — all 16 equally likely pairs.
(a) Sum = 5: (1,4), (2,3), (3,2), (4,1) — 4 outcomes
P(sum = 5) = 164=41 [1]
(b) Sum > 6: Possible sums are 7, 8
Sum = 7: (3,4), (4,3) — 2 outcomes
Sum = 8: (4,4) — 1 outcome
Total = 3 outcomes
P(sum > 6) = 163 [1]
15. [2 marks]
Letters in "PROBABILITY": P-R-O-B-A-B-I-L-I-T-Y
Count: P(1), R(1), O(1), B(2), A(1), I(2), L(1), T(1), Y(1)
Total = 11 letters
(a) P(B) = 112 [1]
(b) Vowels: O, A, I, I = 4 vowels
P(vowel) = 114 [1]
Teaching note: Count letters carefully — repeated letters are distinct physical cards but same letter value.
Section D: Statistical Problem Solving
16. [2 marks]
Method:
| x | f | fx | fx2 |
|---|---|---|---|
| 20 | 2 | 40 | 800 |
| 30 | 5 | 150 | 4500 |
| 40 | 8 | 320 | 12800 |
| 50 | 10 | 500 | 25000 |
| 60 | 8 | 480 | 28800 |
| 70 | 5 | 350 | 24500 |
| 80 | 2 | 100 | 6400 |
∑f=40, ∑fx=1940, ∑fx2=102800
Mean = 401940=48.5
Variance = ∑f∑fx2−(∑f∑fx)2=40102800−(48.5)2=2570−2352.25=217.75
Standard deviation = 217.75=14.756...=14.8 (to 3 sig. fig.) or 15 (to 2 sig. fig.) [2]
Answer: 14.8 or 15 [2]
Teaching note: Standard deviation measures spread. Formula: σ=∑f∑fx2−xˉ2 for frequency table.
17. [2 marks]
Method:
Sum of 10 numbers = 10×8=80
Sum of 12 numbers = 12×9=108
So a+b=108−80=28
Given a=2b:
2b+b=28
3b=28
b=328=931 or 9.333...
a=2×328=356=1832 or 18.667... [2]
Answer: a=356 or 1832 or 18.7, b=328 or 931 or 9.33 [2]
18. [2 marks]
(a) Parcels with m≤200: 40 parcels
Parcels with m>200: 80−40=40 parcels
Percentage = 8040×100=50% [1]
(b) 150<m≤250: From table, m≤250 is 60, m≤150 is 16
Number = 60−16=44
Probability = 8044=2011 or 0.55 [1]
19. [2 marks]
(a) P(red) = 73=nnumber of red balls
Number of red balls = 73n [1]
For this to be a whole number, n must be a multiple of 7.
(b) Number of white balls = n−73n=74n
P(both white) = n74n×n−174n−1=74×n−174n−7=49(n−1)4(4n−7)=49(n−1)16n−28 [1]
Or simplified: 49(n−1)4(4n−7)
Answers: (a) 73n [1]; (b) 49(n−1)16n−28 or equivalent [1]
20. [2 marks]
(a) Estimated mean using mid-interval values:
| Time | Midpoint (m) | Frequency (f) | fm |
|---|---|---|---|
| 0-2 | 1 | 8 | 8 |
| 2-4 | 3 | 24 | 72 |
| 4-6 | 5 | 40 | 200 |
| 6-8 | 7 | 32 | 224 |
| 8-10 | 9 | 16 | 144 |
∑f=120, ∑fm=648
Estimated mean = 120648=5.4 hours [1]
(b) Histogram: Frequency densities (class width = 2 for all):
| Time | Frequency | Frequency density |
|---|---|---|
| 0-2 | 8 | 4 |
| 2-4 | 24 | 12 |
| 4-6 | 40 | 20 |
| 6-8 | 32 | 16 |
| 8-10 | 16 | 8 |
Bars should have heights 4, 12, 20, 16, 8 on the frequency density axis. [1]
Teaching note: For grouped continuous data, we estimate the mean using midpoints. The histogram uses frequency density, not frequency, when class widths vary—but here class widths are equal, so the shape is the same as a frequency bar chart.
END OF ANSWERS
Free quiz and exam paper access
Enter your details to view this paper
Your access is remembered on this device.