From Real Exams Quiz
Secondary 3 Elementary Mathematics Statistics Probability Quiz
Free Sec 3 E Maths Statistics quiz, HY3 Exam version, with questions, answers, and O Level-style practice for Singapore students.
These static practice materials are generated from the site's syllabus and paper-generation workflow, with source and model context shown so students and parents can evaluate the material before use.
Questions
Free quiz and exam paper access
Enter your details to view this paper
Your access is remembered on this device.
Answers
Secondary 3 Elementary Mathematics Quiz - Statistics Probability (Answers)
Total Marks: 40
Section A: Data Handling and Averages
Q1. [2 marks]
Mean = (42 + 45 + 48 + 50 + 52 + 55 + 60) ÷ 7
= 352 ÷ 7 ≈ 50.29 kg
Teaching note: Mean is the sum of all values divided by the count. Add all masses, then divide by 7.
Common mistake: Forgetting to divide by number of students.
Q2. [1 mark]
Data ordered: 2,3,3,4,4,4,5,5,6,7. Median = average of 5th and 6th values = (4+4)/2 = 4.
Teaching note: For even count (10), median is mean of middle two.
Q3. [1 mark]
Mode = 4 (appears 3 times, most frequent).
Teaching note: Mode is the value with highest frequency.
Q4. [1 mark]
Total = 2+5+8+4+1 = 20 students.
Q5. [2 marks]
Mean = (10×2 + 20×5 + 30×8 + 40×4 + 50×1) ÷ 20
= (20+100+240+160+50) ÷ 20 = 570 ÷ 20 = 28.5
Teaching note: Multiply each score by frequency, sum, divide by total frequency.
Section B: Representing Data
Q6. [2 marks]
Angle = (30/120) × 360° = 90°.
Teaching note: Pie chart angle = (category total / overall total) × 360°.
Q7. [1 mark]
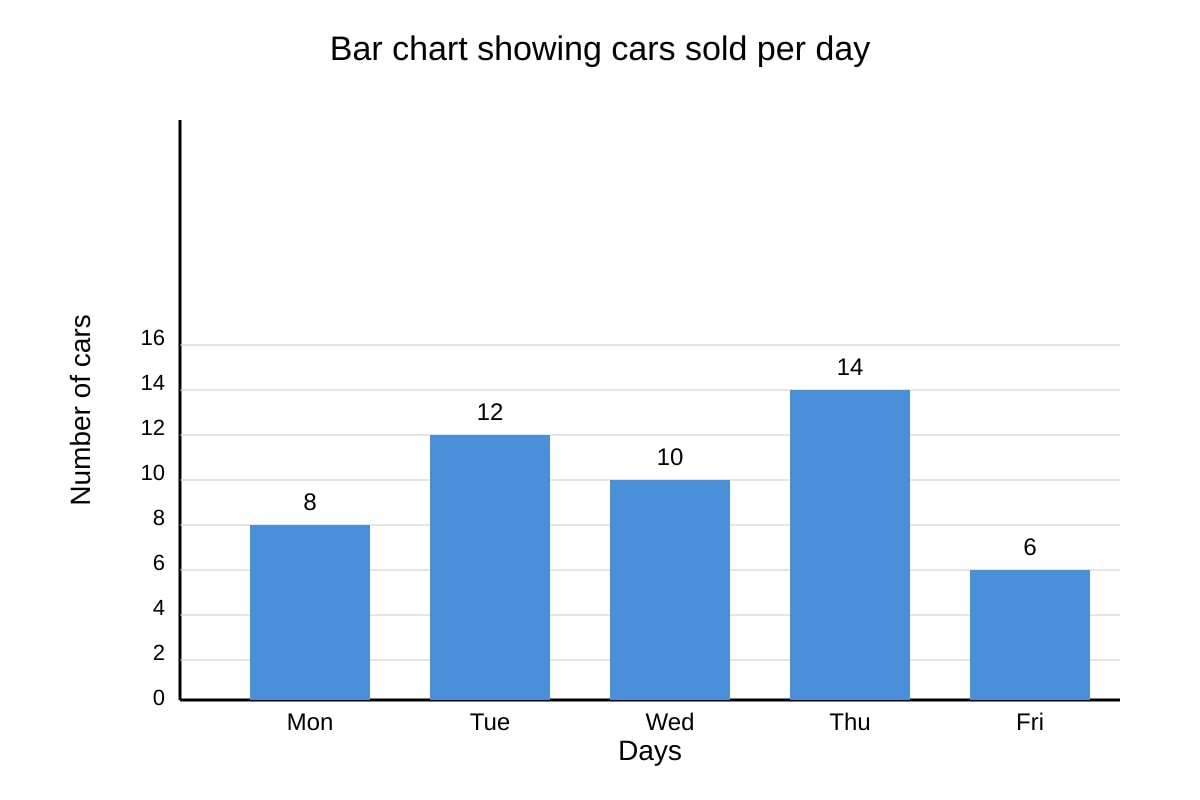
Total = 8+12+10+14+6 = 50 cars. (From placeholder values.)
Q8. [1 mark]
Thursday (14 cars, highest bar).
Q9. [2 marks]
Ages: 21,23,25,25,28,30,32,34,34,37,39,41. Range = 41 – 21 = 20.
Teaching note: Range = max – min from stem-and-leaf.
Q10. [2 marks]
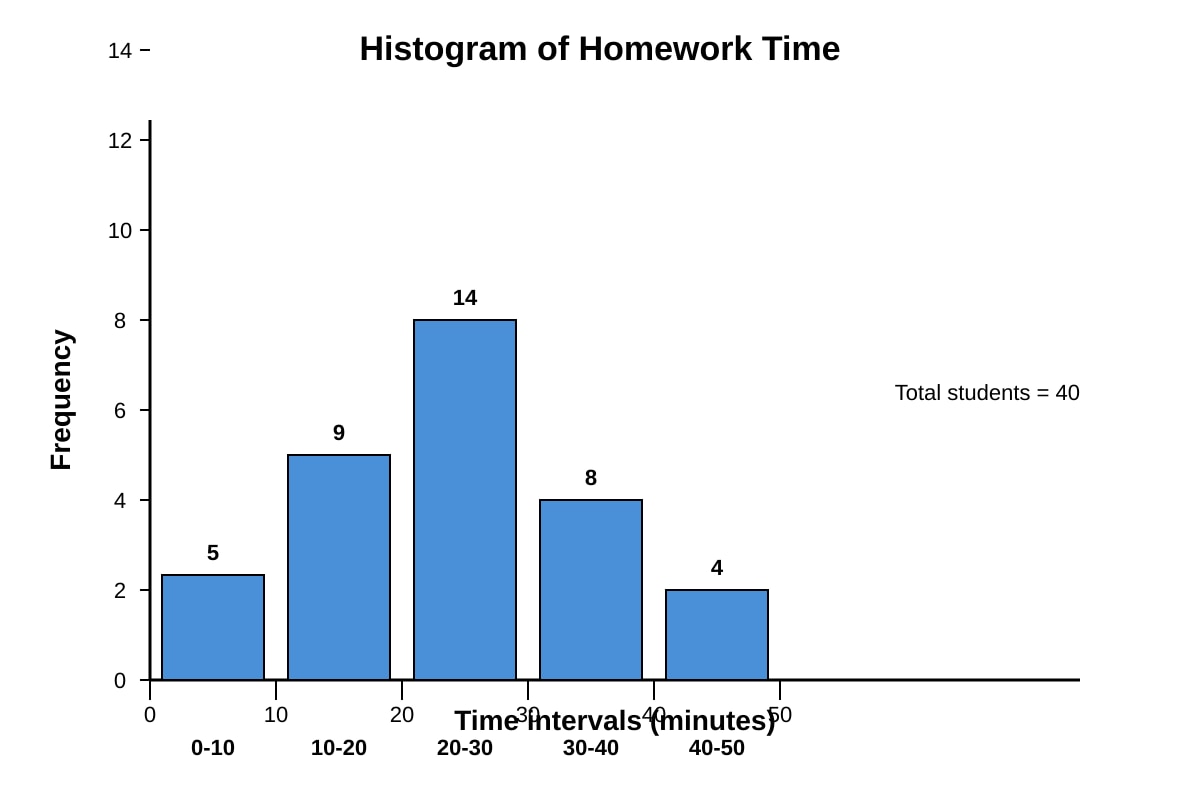
20 or more: 14 (20-30) + 8 (30-40) + 4 (40-50) = 26 students.
Section C: Probability
Q11. [1 mark]
Total = 5+3+2 = 10. P(red) = 5/10 = 1/2.
Q12. [1 mark]
Outcomes >4: 5,6 → 2 outcomes. P = 2/6 = 1/3.
Q13. [1 mark]
HH, HT, TH, TT.
Q14. [1 mark]
Exactly one head: HT, TH → 2/4 = 1/2.
Q15. [1 mark]
4 kings in 52 cards → P = 4/52 = 1/13.
Q16. [3 marks]
P(first black) = 6/10. After drawing one black, 5 black of 9 left → P(second black) = 5/9.
P(both) = (6/10)×(5/9) = 30/90 = 1/3.
Marking: 1m first prob, 1m second prob, 1m product & simplify.
Q17. [2 marks]
Rel freq of 2 = 12/60 = 0.2 (or 1/5).
Teaching note: Relative frequency = frequency / total trials.
Q18. [2 marks]
Odd numbers: 1,3,5 → freq 8+10+11 = 29. P ≈ 29/60.
Teaching note: Estimate probability from relative frequency.
Q19. [2 marks]
Mutually exclusive → P(A ∪ B) = P(A)+P(B) = 0.3+0.45 = 0.75.
Q20. [3 marks]
n(M ∪ S) = 18+12–5 = 25. P = 25/30 = 5/6.
Marking: 1m for union formula, 1m substitution, 1m final prob.