AI Generated Quiz
Secondary 3 Combined Science Scientific Inquiry Quiz
Free Sec 3 Combined Sci Scientific Inquiry quiz, Kimi2.6 AI version, with questions, answers, and O Level-style practice for Singapore students.
These static practice materials are generated from the site's syllabus and paper-generation workflow, with source and model context shown so students and parents can evaluate the material before use.
Questions
Free quiz and exam paper access
Enter your details to view this paper
Your access is remembered on this device.
Answers
Secondary 3 Combined Science Quiz - Scientific Inquiry: Answer Key
Total marks: 50
Section A: Multiple Choice and Short Response
1. The independent variable is the type/amount of fertiliser used / the presence or absence of the new fertiliser [1 mark]
Teaching note: The independent variable is the factor deliberately changed by the scientist. It is the "cause" being tested. The scientist controls this variable to observe its effect on plant growth (the dependent variable).
2. C — "Tomato plants grow taller when given 10 g of Fertiliser X per week compared to 5 g." [1 mark]
Teaching note: A good scientific hypothesis must be (i) testable through experimentation, (ii) specific with clear variables, and (iii) falsifiable. Option C specifies exact quantities, a measurable outcome (height), and a comparison. Option A is too vague; B introduces a non-scientific reason (cost); D uses subjective language ("like").
3. Any two of: [2 marks]
(i) It must be testable / falsifiable [1 mark]
(ii) It must be specific and clearly define the variables involved [1 mark]
Alternative acceptable answers: It should be based on prior knowledge/observations; it should predict a relationship between variables; it should be measurable.
Teaching note: A hypothesis is a proposed explanation that can be tested by controlled experiments. Vague, untestable, or purely opinion-based statements cannot function as scientific hypotheses.
4. (a) 52.1 cm³ is anomalous [1 mark]
Reason: It is significantly different from the other three readings (which cluster around 48.2–48.5 cm³) / It deviates substantially from the consistent pattern [1 mark]
(b) Mean = (48.2 + 48.5 + 48.3) ÷ 3 [1 mark]
= 144.9 ÷ 3 = 48.3 cm³ [1 mark]
Teaching note: Anomalous results are identified by their deviation from the general pattern of repeated measurements. Always recheck the calculation first. The anomalous value is excluded from mean calculations to avoid skewing the result. The consistent readings suggest the true value is close to 48.3 cm³.
5. Any two of: [2 marks]
- It provides a baseline for comparison [1 mark]
- It allows the scientist to determine whether changes in the experimental group are caused by the drug rather than other factors [1 mark]
- It helps identify and control for the placebo effect [1 mark]
Teaching note: The control group receives either no treatment or a placebo. Without this comparison, any observed change in the experimental group cannot be confidently attributed to the drug itself. Other variables (lifestyle, natural variation, psychological effects) could be responsible.
6. Any two of: [2 marks]
(i) Concentration of CO₂ in the water [1 mark]
(ii) Temperature of the water / Amount of water plant used / Species of water plant [1 mark]
Teaching note: In a fair test, only the independent variable (light intensity) should change. All other factors that could affect the rate of photosynthesis must be controlled. This ensures any observed differences in results are due to light intensity alone.
7. (a) Continuous variable (or quantitative variable) [1 mark]
(b) Dependent variable [1 mark]
Teaching note: Temperature can take any value within a range (continuous), unlike discrete variables that are counted in whole numbers. In this experiment, temperature responds to changes made by the experimenter, so it is the dependent variable—the outcome being measured.
8. Other scientists in the same field review the work to check for validity, reliability, and accuracy before publication [1 mark]
This helps identify errors, bias, or unsupported claims, improving the quality and trustworthiness of the research [1 mark]
Teaching note: Peer review is a quality control mechanism in science. It does not guarantee correctness, but it subjects research to critical scrutiny by independent experts, reducing the chance of flawed or fraudulent work being published.
9. A hypothesis is a tentative, testable prediction or proposed explanation for a specific observation, often based on limited evidence [1 mark]
A theory is a well-established, comprehensive explanation supported by extensive evidence from multiple investigations and experiments over time [1 mark]
Teaching note: The key distinction is confidence and scope. A hypothesis is a starting point for investigation and may be disproven. A theory (e.g., atomic theory, theory of evolution) has withstood repeated testing and integrates many findings, but remains open to refinement. In everyday language "theory" implies guesswork; in science it denotes robust explanation.
10. Percentage error = [(measured value – true value) / true value] × 100% [1 mark]
= [(15.6 – 15.2) / 15.2] × 100%
= (0.4 / 15.2) × 100% = 2.631...% = 2.6% [1 mark]
Teaching note: Percentage error quantifies measurement accuracy relative to the true or accepted value. Always use the true value as the denominator. The result is given to 2 significant figures as requested. Common error: using measured value as denominator gives wrong calculation.
Section B: Data Analysis and Experimental Design
11. (a) The temperature after 10 minutes / The final temperature / The temperature fall [1 mark]
Teaching note: The dependent variable is what is measured/observe in response to changes in the independent variable (container material). Temperature change is the outcome being assessed.
(b) Container A: 85 – 68 = 17°C [0.5 mark]
Container B: 85 – 62 = 23°C [0.5 mark]
Container C: 85 – 45 = 40°C [0.5 mark]
All three correct with units: [1.5 marks; allow 0.5 mark each, max 2 marks if working shown]
(c) Plastic (Container A) [1 mark]
It showed the smallest temperature fall (17°C), meaning it lost heat most slowly / It best prevented heat transfer from the hot water to the surroundings [1 mark]
Teaching note: Good insulators resist heat transfer. Smaller temperature drop indicates better insulation. Metal is a good conductor, so it loses heat rapidly. Glass is intermediate. This mirrors real-world applications like thermos flasks (plastic/stainless steel with vacuum layers).
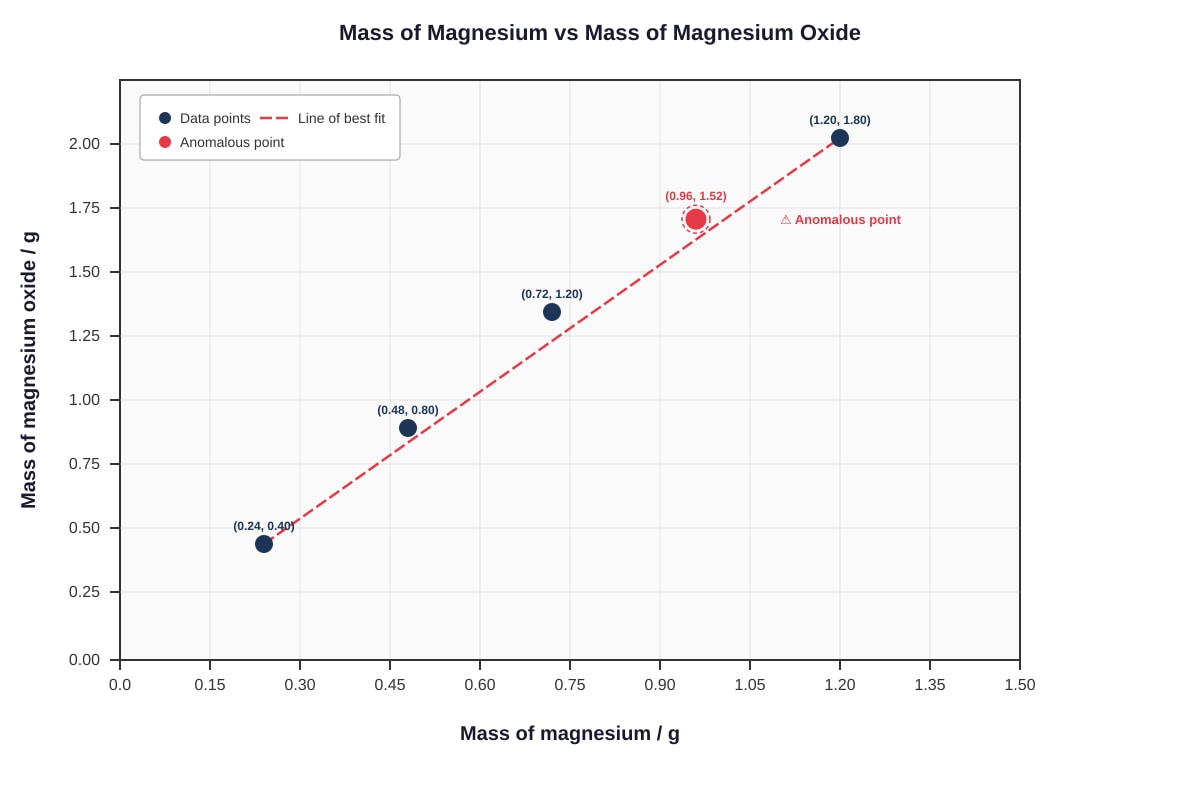
12. (a) Graph marks: [2 marks]
- Correct plotting of all five points (± half square tolerance) [1 mark]
- Line of best fit drawn straight, passing close to (0.24, 0.40), (0.48, 0.80), (0.72, 1.20), and (1.20, 1.80), ignoring anomalous point [1 mark]
Expected visual: Points at (0.24, 0.40), (0.48, 0.80), (0.72, 1.20), (0.96, 1.52) [anomalous, off line], (1.20, 1.80). Straight line through origin expected.
(b) (0.96, 1.52) [1 mark]
Possible reason: Incomplete combustion of magnesium / not all magnesium reacted / some magnesium oxide was lost as smoke / heating was insufficient / balance reading error [1 mark]
(c) From line of best fit: approximately 0.96–1.00 g (acceptable range 0.95–1.05 g) [1 mark]
Teaching note: The anomalous point lies below the expected line, suggesting product was lost or reactant not fully consumed. The expected ratio from the line is MgO mass ≈ 1.67 × Mg mass (theoretical: 40/24 = 1.67). For 0.60 g: 0.60 × 1.67 ≈ 1.00 g.
13. Marking scheme – any four valid points: [4 marks]
- Independent variable: Surface area of the solid (e.g., same mass of marble chips but different sizes: large chips, small chips, powder) [1 mark]
- Dependent variable: Rate of reaction (e.g., volume of CO₂ produced per unit time / time for collection of fixed volume) [1 mark]
- Control variables: (any two for 1 mark) — temperature of acid, concentration of acid, volume of acid, mass of solid, same apparatus
- Method: Use same mass of solid in different surface area forms; add to fixed volume and concentration of HCl; collect gas in inverted measuring cylinder/burette over water; measure volume at regular intervals or time to collect fixed volume; repeat for reliability [1 mark]
- Results processing: Plot graph of volume of gas against time for each surface area; calculate initial gradient as rate; compare times for fixed volume; present in table with repeats and means [1 mark]
Teaching note: This is a classic kinetic investigation. Greater surface area increases collision frequency between reactant particles, increasing rate. Controlling variables ensures fair comparison. Repeating and using means improves reliability.
14. Any two of: [2 marks]
(i) Colour matching is subjective / depends on interpretation of the observer [1 mark]
(ii) Universal indicator gives only approximate pH value (whole number precision) rather than decimal precision [1 mark]
(iii) Different batches/ages of indicator may give slightly different colours [1 mark]
(iv) Lighting conditions affect colour perception [1 mark]
Teaching note: pH meters provide objective, quantitative measurements typically to 0.1 or 0.01 pH unit. Universal indicator relies on qualitative colour comparison, introducing human judgment error and limited precision.
15. Any two valid problems: [2 marks]
- "Chemical-free" is misleading — all matter consists of chemicals; water is a chemical [1 mark]
- "Organic" does not mean safe — many natural substances are toxic (e.g., cyanide, botulinum toxin) [1 mark]
- Lack of scientific evidence cited; no controlled study data provided [1 mark]
- Confuses natural with safe, and synthetic with harmful — safety depends on dosage and testing, not origin [1 mark]
Teaching note: This is an example of scientific literacy in evaluating claims. The term "chemical" has been misused in marketing to mean "synthetic" or "harmful." Scientifically, everything is composed of chemicals. Safety requires empirical testing, not assumptions about natural origin.
16. Any two of: [2 marks]
- To account for natural variation in insect activity (time of day, weather, season) [1 mark]
- To improve reliability and check for consistency of results [1 mark]
- To reduce the effect of random error / anomalous counts on conclusions [1 mark]
- To identify patterns that might be missed in a single survey [1 mark]
Teaching note: Biological systems show natural variability. Single measurements may be unrepresentative. Repetition across different conditions provides a more reliable estimate of true population or typical behaviour. This is fundamental to ecological sampling methods.
Section C: Scientific Reasoning and Evaluation
17. (a) 0.01 s (or 0.1 s for analogue) — typical digital stopwatch resolution is 0.01 s [1 mark]
(b) 0.88 s [1 mark]
It is much larger than the other values which cluster around 0.42–0.46 s / The student likely missed the first clap and started timing late [1 mark]
(c) Any two of: [2 marks]
- Human reaction time in starting/stopping the stopwatch (typically 0.2–0.3 s, significant for short intervals) [1 mark]
- The clap sound is not instantaneous; the blocks take time to hit together [1 mark]
- Wind or temperature affects air density and thus speed of sound [1 mark]
- The distance to the wall may not be measured precisely; the echo travels 300 m total (there and back) [1 mark]
Teaching note: The total distance sound travels is 2 × 150 m = 300 m. With mean time ~0.44 s, calculated speed ≈ 682 m/s — far too high. Actually, reliable time should be ~0.88 s (using the anomalous result!) suggesting the other values are too low. The student likely timed multiple echoes or had systematic error. Expected calculation: 300 m ÷ 0.88 s ≈ 341 m/s. The "anomalous" 0.88 s may be correct! This teaches critical evaluation of data — sometimes what appears anomalous may be accurate.
Teacher note: This question contains deliberate ambiguity for discussion. The clustered low values with one high value could indicate the student timed 300 m (there and back) correctly in one instance, or made an error. The key learning is to examine methodology, not just apply rules about anomalies.
18. Any three valid points: [3 marks]
- Small sample size (only 10 participants) reduces reliability and may not represent broader population [1 mark]
- No control group mentioned — participants may have lost weight due to placebo effect, lifestyle changes, or natural variation [1 mark]
- "Proven by science" is vague — no details of study design, peer review, or replication provided [1 mark]
- No information on how weight loss was measured or over what time period [1 mark]
- Possible bias — company-funded research may selectively report favorable results [1 mark]
- Correlation vs. causation not established — other factors could explain weight loss [1 mark]
Teaching note: Scientific credibility requires transparent methodology, adequate controls, replication, and peer scrutiny. Marketing claims often misuse scientific language. The phrase "proven by science" is itself unscientific — science deals in evidence and probability, not absolute proof.
19. (a) "Extremely likely" indicates a very high level of confidence (typically >95% probability in IPCC terminology) [1 mark]
It reflects the strength of multiple independent lines of evidence and expert consensus, while acknowledging scientific uncertainty is never absolutely zero [1 mark]
(b) Carbon dioxide (CO₂) AND respiration / volcanic activity / forest fires / decomposition [1 mark]
OR Methane (CH₄) AND anaerobic decomposition / wetlands / termites / natural gas seeps [1 mark]
Teaching note: The IPCC uses calibrated uncertainty language: "extremely likely" = 95–100% probability. This careful wording respects scientific epistemology — conclusions are based on evidence strength, not absolute certainty. Greenhouse gases have both natural and anthropogenic sources; the issue is enhanced concentration from human activities.
20. Marking descriptors: [4 marks]
Strengths (up to 2 marks):
- Use of identical squares controls for size and thickness [1 mark]
- Multiple colours tested allows comparison [1 mark]
- Same environmental conditions (direct sunlight, same time) provides fair test for colour comparison [1 mark]
Weaknesses and Improvements (up to 3 marks):
- No control of light intensity — sunlight varies; improvement: use identical light sources at fixed distance [1 mark]
- Thermometers may absorb differently/different thermal masses — improvement: use identical thermometer types; consider using temperature probes for consistency [1 mark]
- No repetition — improvement: repeat measurement for each colour and calculate mean [1 mark]
- Temperature rise depends on ambient temperature — improvement: record starting temperature and calculate temperature change, or conduct in controlled temperature environment [1 mark]
- Fabric thickness/material may vary despite same size — improvement: use same fabric type, only vary dye colour [1 mark]
Teaching note: Validity concerns whether the test measures what it claims to measure (colour effect on absorption, not other factors). Reliability concerns consistency and repeatability. The design partially controls variables but lacks repetition and precise environmental control. The best experiments isolate one variable with robust controls and replication.
END OF ANSWER KEY