AI Generated Quiz
Secondary 3 Combined Science Scientific Inquiry Quiz
Free Sec 3 Combined Sci Scientific Inquiry quiz, HY3 AI version, with questions, answers, and O Level-style practice for Singapore students.
These static practice materials are generated from the site's syllabus and paper-generation workflow, with source and model context shown so students and parents can evaluate the material before use.
Questions
Free quiz and exam paper access
Enter your details to view this paper
Your access is remembered on this device.
Answers
Secondary 3 Combined Science Quiz - Scientific Inquiry (Answer Key)
Total Marks: 40
Topic: Scientific Inquiry (syllabus-first, LLM-inferred from Stage 4 patterns; not claimed as past-year derived)
Q1. B [1]
Teaching note: A scientific question must be testable by observation or experiment. Option B can be tested by measuring bubble rate at different light levels. A, C, D are subjective or non-testable.
Q2. C [1]
Teaching note: The independent variable is changed by the investigator to see its effect. Dependent variable responds; control variables are kept same.
Q3. B [1]
Teaching note: Temperature in °C is a continuous quantitative variable (can take any value in a range). Categorical = types; qualitative = descriptions; discrete = whole counts.
Q4. C [1]
Teaching note: Safety goggles protect eyes; pointing tube away prevents injury from vapour/explosion. A and B are dangerous.
Q5. B [1]
Teaching note: Conclusion must follow evidence from collected data, not opinion or textbook alone.
Q6. [2]
- To provide a baseline for comparison (1)
- To show that observed effect is due to independent variable and not other factors (1)
Teaching note: Control group receives no treatment or standard condition.
Q7. [2]
Working: Mass of salt = (52.8 – 45.2) g = 7.6 g (2 for correct subtraction and unit)
Answer: 7.6 g
Teaching note: Subtract beaker-only from beaker+salt.
Q8. [2]
Any two: measuring cylinder, pipette, burette, volumetric flask (1 each).
Teaching note: These give accurate volume; beakers are less accurate.
Q9. [2]
Independent: fertiliser concentration (1)
Dependent: height of maize plants (1)
Teaching note: Independent is changed; dependent is measured.
Q10. [2]
- To identify anomalies/errors (1)
- To calculate a more reliable mean (1)
Teaching note: Repeats reduce effect of random error.
Q11. [2]
As wing length increases, time to fall increases (1). Longer wings increase air resistance, slowing descent (1).
Teaching note: Trend is positive correlation in table.
Q12. [2]
Bar chart, line graph, pie chart (any one with reason e.g. “line graph shows trend” = 2).
Teaching note: Visuals help spot patterns.
Q13. [2]
The control remained unchanged (1), suggesting no unexpected heat input and experiment setup valid (1).
Teaching note: Control verifies apparatus stability.
Q14. [2]
Any two: burns from flame, gas leak, fire, hot equipment (1 each).
Teaching note: Risk assessment is part of inquiry.
Q15. [2]
So it can be supported or refuted by experiment (1); non-testable statements are not scientific (1).
Teaching note: Science relies on empirical test.
Q16. [4]
(a) Mint leaves lower boiling water temperature faster than plain water. [1]
(b) Independent: presence of mint leaves (1); Dependent: temperature decrease over time / cooling rate (1)
(c) Control: initial water volume (50 mL) kept same using measuring cylinder (1)
Teaching note: Hypothesis predicts relationship; variables identified clearly.
Q17. [3]
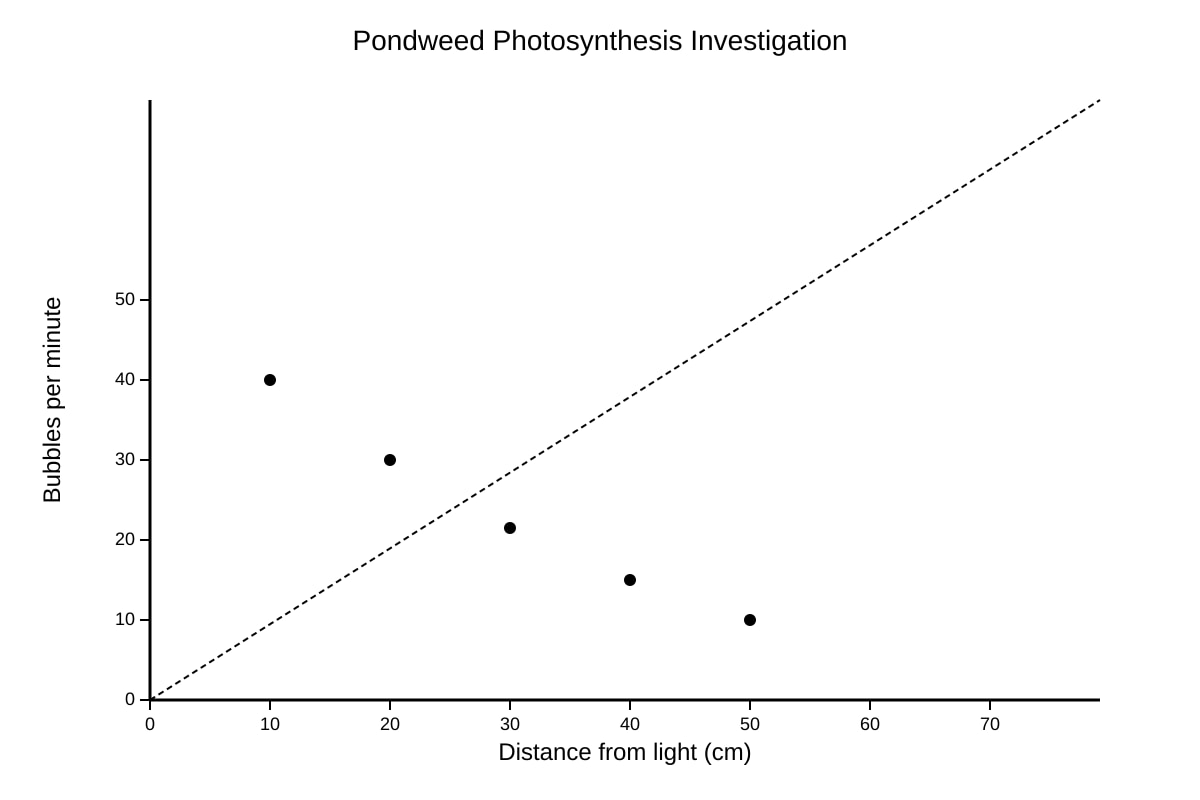
Relationship: As distance from light increases, bubbles per minute decrease (1). Indicates light intensity inversely affects photosynthesis rate (1). Less light = less energy for reaction, less oxygen produced (1).
Teaching note: Graph shows downward trend; bubble rate = proxy for photosynthesis.
Q18. [3]
(a) Mean = (1.8+2.0+1.9+2.1+1.7)/5 = 9.5/5 = 1.9 g [2]
(b) Reduces random error, gives typical value [1]
Teaching note: Sum ÷ n; mean represents central tendency.
Q19. [4]
Plan:
- Independent: water temperature (e.g., 20, 40, 60 °C) (1)
- Dependent: time for sugar to dissolve (1)
- Controls: same mass of sugar, same volume water, same stirring (1)
- Method: heat water to set temp, add sugar, time until clear, repeat (1)
Teaching note: Fair test needs variable isolation.
Q20. [4]
(a) Independent: air temperature (1); Dependent: echo time (1)
(b) Sound travels faster in warm air (1)
(c) Repeats reduce random error, confirm consistent pattern (2: 1 for repeat, 1 for reliability)
Teaching note: Reliability improved by replication.