From Real Exams Quiz
Secondary 3 Combined Science Scientific Inquiry Quiz
Free Sec 3 Combined Sci Scientific Inquiry quiz, HY3 Exam version, with questions, answers, and O Level-style practice for Singapore students.
These static practice materials are generated from the site's syllabus and paper-generation workflow, with source and model context shown so students and parents can evaluate the material before use.
Questions
Secondary 3 Combined Science Quiz - Scientific Inquiry
Name: ___________________________
Class: ________
Date: ____________
Score: _______ / 40
Duration: 45 minutes
Total Marks: 40
Instructions:
- Answer all 20 questions.
- Section A: Multiple-choice (1 mark each).
- Section B: Short structured questions (1–3 marks each).
- Section C: Data interpretation and extended response (2–5 marks each).
- Write clearly in the spaces provided.
Section A: Multiple-Choice (Questions 1–5)
1. Which of the following best describes a scientific hypothesis?
A. A proven fact accepted by all scientists
B. A testable prediction based on observation
C. A final conclusion drawn after an experiment
D. A random guess with no evidence
____ (1 mark)
2. In a fair test, the variable that is deliberately changed is the
A. controlled variable
B. independent variable
C. dependent variable
D. confounding variable
____ (1 mark)
3. Which instrument is most suitable for measuring a liquid volume of 25.0 cm³ with high accuracy in a school lab?
A. Beaker
B. Measuring cylinder
C. Test tube
D. Evaporating dish
____ (1 mark)
4. A student records the time taken for a reaction at different temperatures. The purpose of repeating each reading three times is to
A. impress the teacher
B. increase reliability of data
C. change the independent variable
D. reduce the number of variables
____ (1 mark)
5. Which of the following is an example of qualitative data?
A. 36.5 °C
B. 12.4 g
C. blue precipitate formed
D. 5.0 cm³
____ (1 mark)
Section B: Short Structured Questions (Questions 6–10)
6. State one reason why a control set-up is used in an experiment.
__________________________________________________________________ (1 mark)
7. Give one example of a categorical variable in a biology investigation.
__________________________________________________________________ (1 mark)
8. A student measures the mass of a crucible as 15.62 g using an electronic balance. State the precision of this measurement.
__________________________________________________________________ (1 mark)
9. List two safety precautions to take when heating a flammable liquid in a lab.
(i) ______________________________________________________________
(ii) ______________________________________________________________ (2 marks)
10. Explain why it is important to plot a line graph rather than a bar chart when showing the relationship between temperature and rate of reaction.
__________________________________________________________________ (2 marks)
Section C: Data Interpretation and Extended Response (Questions 11–20)
11. A class investigated the effect of light intensity on the rate of photosynthesis in pondweed. They counted bubbles produced in 3 minutes at different distances of a lamp.
| Distance of lamp (cm) | Bubbles in 3 min (Trial 1) | Bubbles in 3 min (Trial 2) | Bubbles in 3 min (Trial 3) |
|---|---|---|---|
| 10 | 42 | 40 | 44 |
| 20 | 30 | 31 | 29 |
| 30 | 20 | 22 | 21 |
| 40 | 12 | 13 | 11 |
Calculate the mean number of bubbles for the lamp at 20 cm. Show your working.
__________________________________________________________________ (2 marks)
12. Using the table in Q11, describe the trend shown between distance of lamp and rate of photosynthesis.
__________________________________________________________________ (2 marks)
13. State the independent variable and dependent variable in the investigation in Q11.
Independent: ______________________________________________________
Dependent: ________________________________________________________ (2 marks)
14. Suggest one control variable that should be kept constant in the Q11 experiment.
__________________________________________________________________ (1 mark)

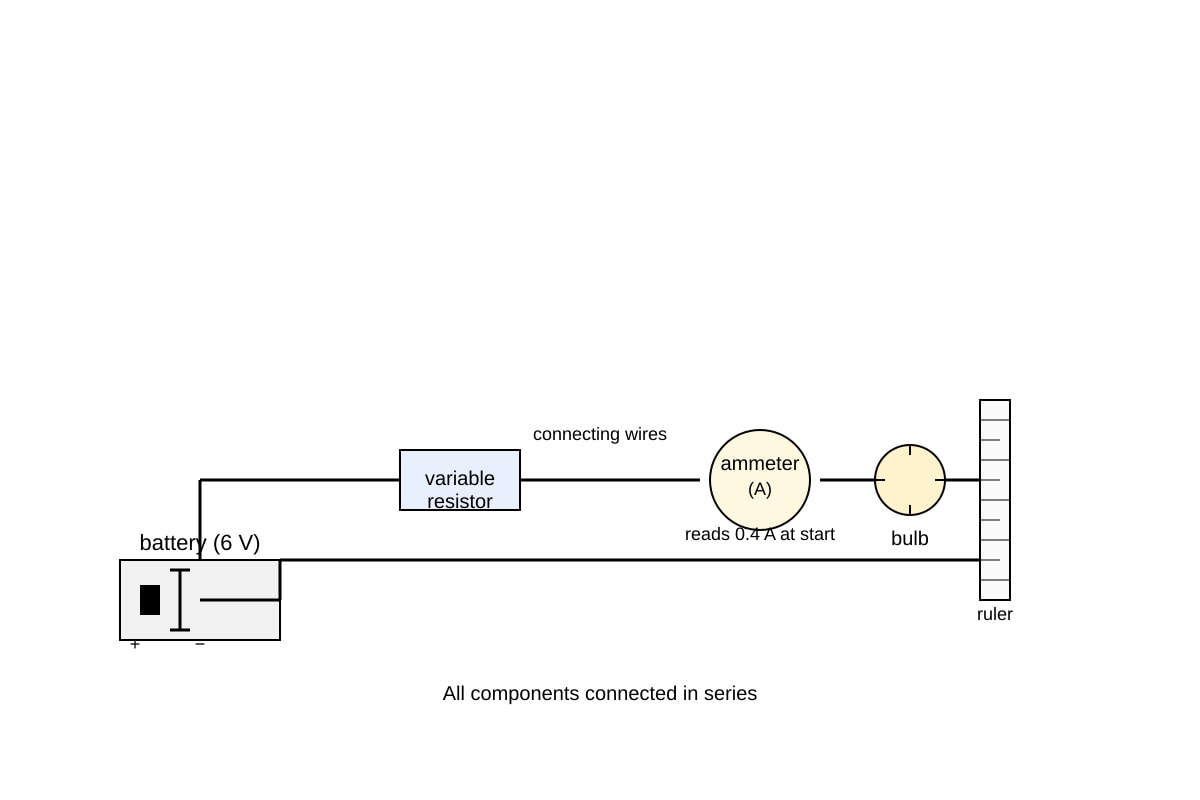
Generated experimental_setup for Q15.
15. The diagram shows an experimental set-up to test how resistance affects bulb brightness.
(a) Identify one variable that is independent in this set-up. (1 mark)
(b) State how the student could improve the reliability of the brightness observation. (1 mark)
16. A student wrote: "If I add more salt to water, then the boiling point will rise because dissolved particles disrupt escaping molecules."
(a) Underline the hypothesis in the statement. (1 mark)
(b) State how this hypothesis could be tested experimentally. (2 marks)
17. The following shows part of a lab report method:
"Measure 50 cm³ of solution A into a beaker. Add 5 g of solid B. Stir. Record temperature change."
Suggest two improvements to make the method reproducible.
(i) ______________________________________________________________
(ii) ______________________________________________________________ (2 marks)
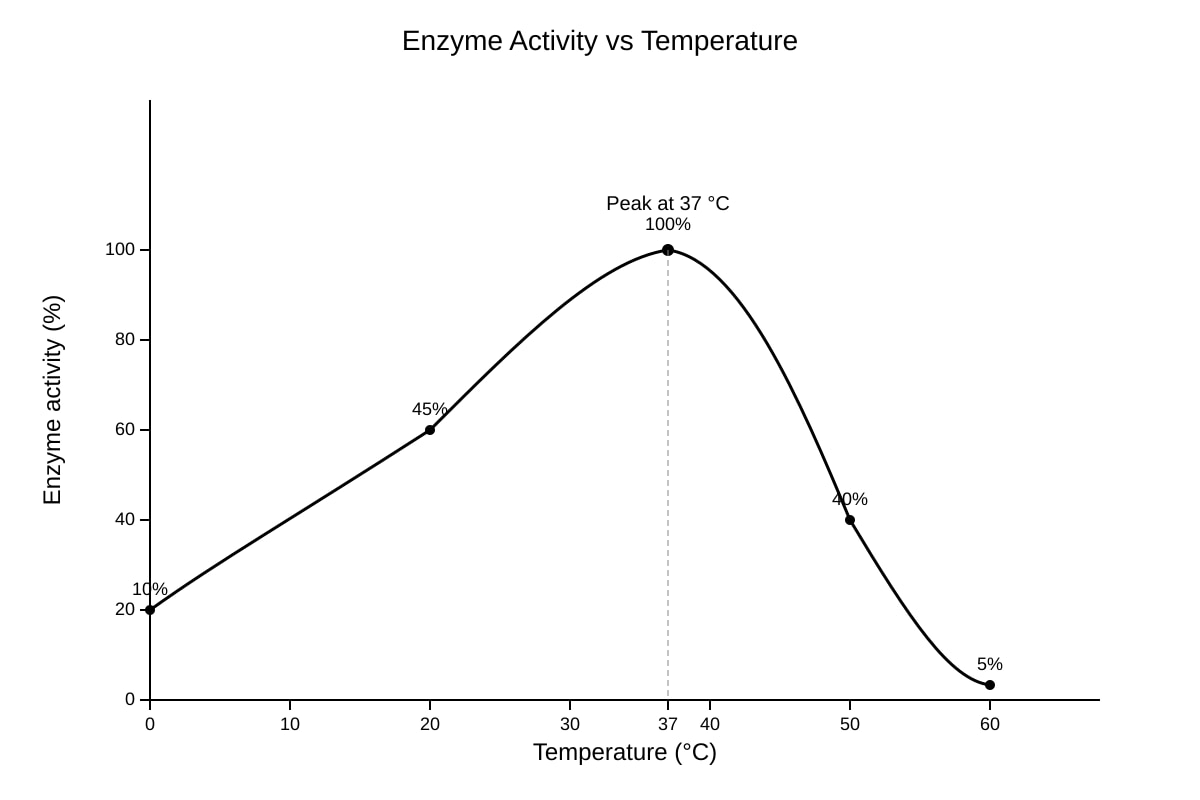
18.

Generated graph for Q18.
Using the graph, state the optimum temperature for the enzyme and explain what happens to activity above this temperature.
__________________________________________________________________ (3 marks)
19. Describe the steps of the scientific method from observation to conclusion in order. Give one sentence for each step.
(1) ______________________________________________________________
(2) ______________________________________________________________
(3) ______________________________________________________________
(4) ______________________________________________________________
(5) ______________________________________________________________ (5 marks)
20. A group investigated whether mint leaves reduce bacterial growth. They placed mint extract on one side of an agar plate and water on the other. After 2 days, a clear zone was seen around mint side only.
(a) State the purpose of the water side. (1 mark)
(b) Explain one limitation of this investigation and how to improve it. (2 marks)
Answers
Secondary 3 Combined Science Quiz - Scientific Inquiry (Answer Key)
Total Marks: 40
Topic: Scientific Inquiry
Section A: Multiple-Choice
1. B (1 mark)
Teaching note: A hypothesis is a testable prediction, not yet proven. A is wrong (that is a theory/law), C is conclusion, D is not scientific.
2. B (1 mark)
Teaching note: Independent variable is changed by investigator. Dependent responds to it. Controlled is kept same.
3. B (1 mark)
Teaching note: Measuring cylinder gives ±0.5 cm³ accuracy; beaker is less precise. Correct lab instrument choice is part of inquiry.
4. B (1 mark)
Teaching note: Repeats reduce random error and improve reliability, not to change variables.
5. C (1 mark)
Teaching note: Qualitative = descriptive (colour, state). Others are quantitative numeric.
Section B: Short Structured
6. To provide a comparison / show that the observed effect is due to the independent variable. (1 mark)
Teaching note: Control lacks treatment but same conditions.
7. e.g. type of leaf, species of plant, blood group. (1 mark)
Teaching note: Categorical = groups/names, not numbers.
8. 0.01 g (or to 2 decimal places). (1 mark)
Teaching note: Last digit shows precision of balance.
9. Any two: use fume hood, keep away from flame, wear goggles, use water bath not direct heat, have fire extinguisher. (2 marks, 1 each)
Teaching note: Flammable liquid needs ignition source avoided.
10. Because both variables are continuous (temperature, rate) and line shows relationship/trend; bar chart for categories. (2 marks)
Teaching note: Continuous vs categorical data choice.
Section C: Data Interpretation
11. Mean = (30 + 31 + 29) / 3 = 90 / 3 = 30 bubbles. (2 marks: 1 for sum, 1 for divide)
Working: 30+31+29=90; 90÷3=30.
12. As distance increases, bubbles decrease / rate decreases; closer lamp (more light) higher photosynthesis. (2 marks)
Teaching note: Inverse relationship with distance = direct with light intensity.
13. Independent: distance of lamp (or light intensity). Dependent: bubbles in 3 min (rate). (2 marks)
14. e.g. same pondweed amount, same water temp, same duration. (1 mark)
15. (a) Resistance set by variable resistor. (1 mark)
(b) Take multiple brightness readings / use light sensor. (1 mark)
16. (a) "If I add more salt to water, then the boiling point will rise…" (1 mark)
(b) Boil salt solutions of known concentrations, measure BP with thermometer, compare to pure water. (2 marks)
17. (i) State concentration of solution A. (ii) State initial temperature / use stirrer same speed. (2 marks)
Teaching note: Reproducible = exact quantities/conditions.
18. Optimum = 37 °C (1). Above it, activity falls (1) because enzyme denatures, shape lost (1). (3 marks)
19. (1) Observation: notice phenomenon. (2) Question: ask why/how. (3) Hypothesis: testable prediction. (4) Experiment: test with controls. (5) Conclusion: accept/reject hypothesis from data. (5 marks, 1 each)
20. (a) Control to show water alone no effect. (1 mark)
(b) Limitation: only one plate / no repeat. Improve: use more plates, repeat, measure zone size. (2 marks)
Free quiz and exam paper access
Enter your details to view this paper
Your access is remembered on this device.