AI Generated Quiz
Secondary 3 Biology Ecology Quiz
Free Sec 3 Biology Ecology quiz, Kimi2.6 AI version, with questions, answers, and O Level-style practice for Singapore students.
These static practice materials are generated from the site's syllabus and paper-generation workflow, with source and model context shown so students and parents can evaluate the material before use.
Questions
Secondary 3 Biology Quiz - Ecology
Name: _________________________________ Class: _________ Date: _____________
Duration: 45 minutes
Total Marks: 50
Score: ______ / 50
Instructions:
- Answer all questions in the spaces provided.
- Write in dark blue or black pen.
- For questions requiring calculations, show your working clearly.
- Read each question carefully before answering.
Section A: Multiple Choice (Questions 1–5)
Choose the correct answer for each question. Each question carries 2 marks.
1. Which of the following is a biotic factor in an ecosystem?
A. Light intensity
B. Soil pH
C. Predation pressure
D. Temperature
Answer: _________________
2. The diagram below shows a simplified food web in a mangrove ecosystem.
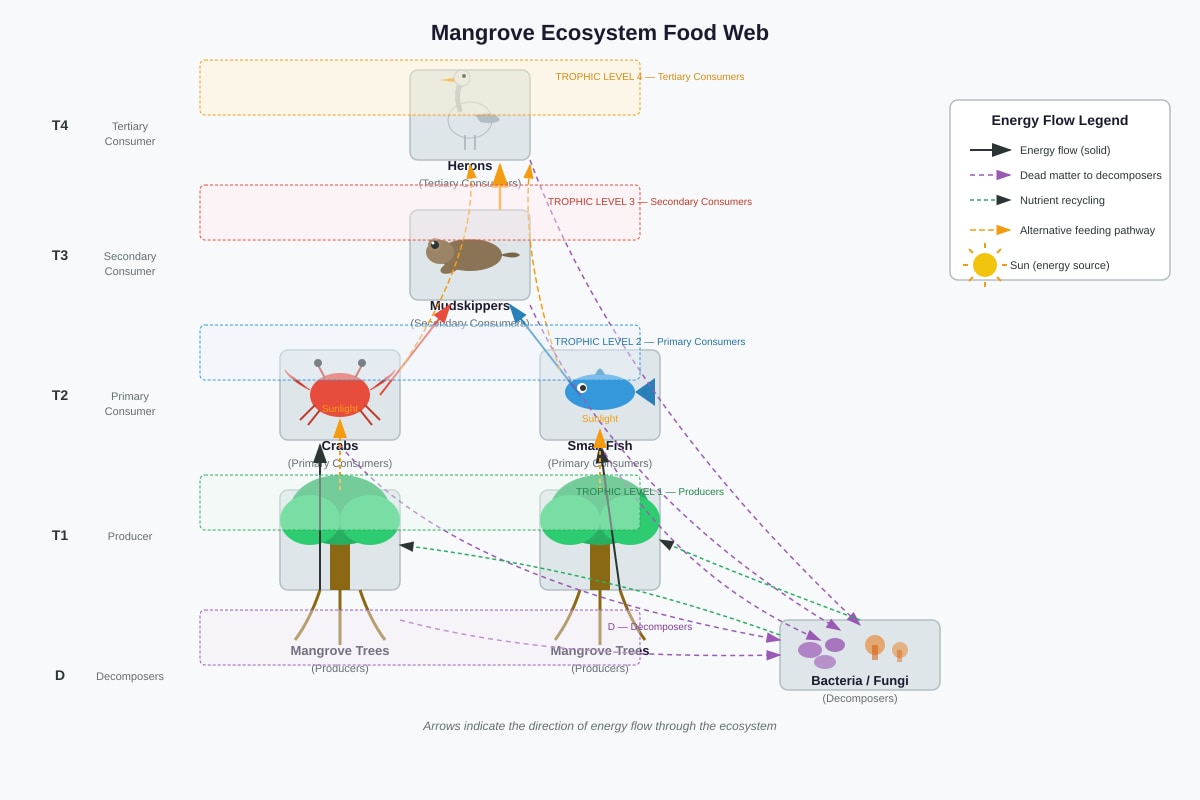
Generated diagram for Q2.
Which organism occupies the trophic level labelled T2 (primary consumer)?
A. Mangrove trees
B. Crabs
C. Herons
D. Bacteria
Answer: _________________
3. In a population of beetles, the allele for black coloration is dominant (B) over red (b). If the frequency of the recessive allele is 0.4, what is the frequency of heterozygous individuals according to Hardy-Weinberg equilibrium?
A. 0.16
B. 0.24
C. 0.48
D. 0.60
Answer: _________________
4. Which statement correctly describes the role of decomposers in nutrient cycling?
A. They convert atmospheric nitrogen into nitrates
B. They release carbon dioxide through photosynthesis
C. They break down dead organic matter and release mineral ions
D. They fix atmospheric carbon into organic compounds
Answer: _________________
5. The graph below shows the growth of a bacterial population in a closed culture.
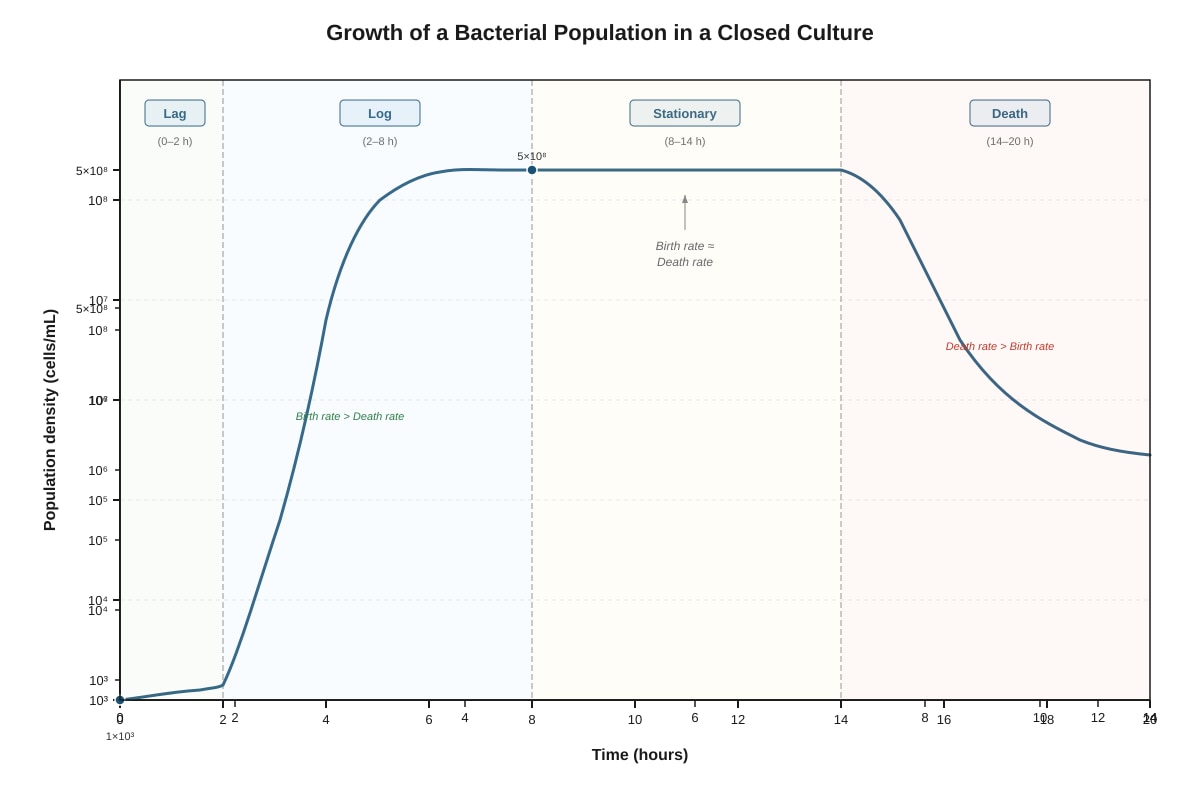
Generated graph for Q5.
During which phase is the birth rate approximately equal to the death rate?
A. Lag phase
B. Log (exponential) phase
C. Stationary phase
D. Death phase
Answer: _________________
Section B: Short Answer Questions (Questions 6–12)
Answer in the spaces provided. Marks are shown in brackets.
6. Define the term ecosystem. State two components that must be present for an ecosystem to function. [3]
7. Explain why energy transfer between trophic levels is typically only about 10% efficient. [3]
8. The table below shows estimated population data for a species of fish in a lake over five years.
| Year | Population Size | Births | Deaths |
|---|---|---|---|
| 2019 | 2,000 | 400 | 350 |
| 2020 | 2,050 | 420 | 380 |
| 2021 | 2,090 | 450 | 410 |
| 2022 | 2,130 | 480 | 440 |
| 2023 | 2,170 | 520 | 530 |
(a) Calculate the net population change for 2023. Show your working. [2]
(b) Predict, with a reason, whether the population in 2024 is likely to increase, decrease, or remain stable. [2]
9. Distinguish between habitat and niche. [2]
10. The diagram shows part of the nitrogen cycle.
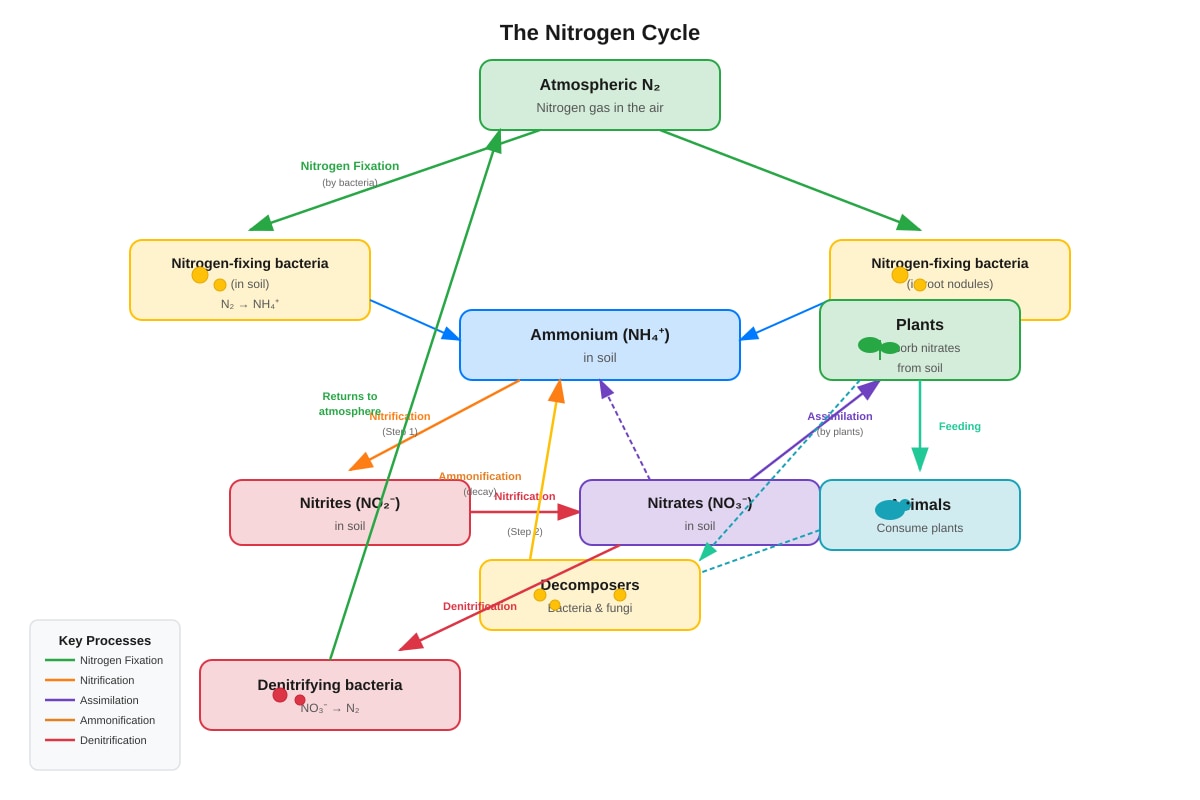
Generated diagram for Q10.
(a) Name the process that converts atmospheric nitrogen into ammonium compounds. [1]
(b) Explain why nitrogen fixation is essential for plant growth. [2]
11. In a study of a grassland ecosystem, researchers measured the biomass at different trophic levels. The results are shown below.
| Trophic Level | Biomass (kg/m²) |
|---|---|
| Producers (grasses) | 2,500 |
| Primary consumers (herbivores) | 250 |
| Secondary consumers (carnivores) | 25 |
| Tertiary consumers (top carnivores) | 2.5 |
(a) Calculate the percentage of energy transferred from producers to primary consumers. Show your working. [2]
(b) Suggest two reasons why so little energy is transferred between these trophic levels. [2]
12. Explain how parasitism differs from mutualism, using a named example of each type of relationship. [4]
Section C: Structured Response (Questions 13–17)
Answer in the spaces provided. Marks are shown in brackets.
13. The graph below shows how the population size of a predator and its prey changed over a ten-year period.
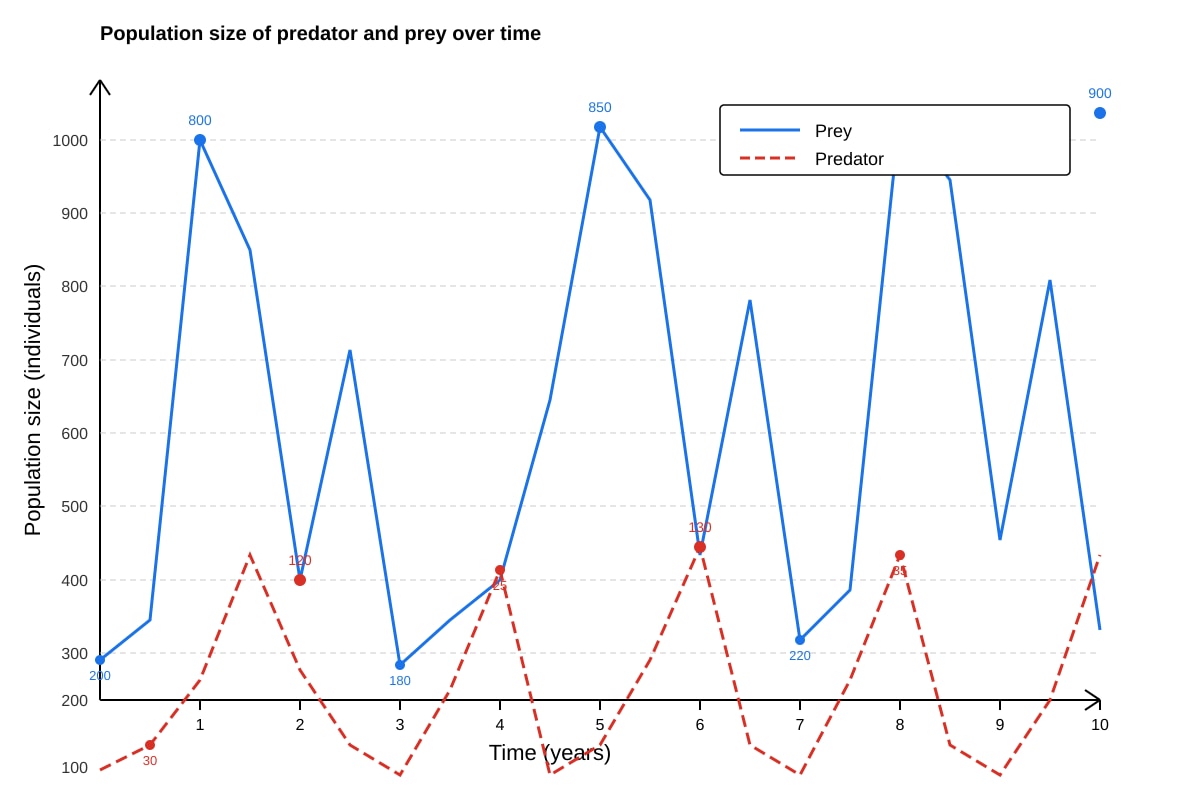
Generated graph for Q13.
(a) Describe the pattern shown by the prey population between year 0 and year 4. [2]
(b) Explain why the predator population peak occurs approximately one year after the prey population peak. [3]
(c) Predict what would happen to both populations if a disease killed 80% of the predators in year 5. Explain your answer. [3]
14. Global warming is causing significant changes to many ecosystems. Describe and explain two ways in which rising sea temperatures can affect marine ecosystems. [4]
15. In an investigation into the distribution of two plant species (Species X and Species Y) along a transect from the edge of a pond to dry land, a student recorded the following data.
| Quadrat Number | Distance from Water (m) | Species X (present/absent) | Species Y (present/absent) |
|---|---|---|---|
| 1 | 0 | Present | Absent |
| 2 | 2 | Present | Absent |
| 3 | 4 | Present | Present |
| 4 | 6 | Absent | Present |
| 5 | 8 | Absent | Present |
| 6 | 10 | Absent | Present |
(a) Describe the distribution of Species X and Species Y in relation to distance from water. [2]
(b) Suggest one abiotic factor, other than distance from water, that could explain why Species X is not found in quadrats 4–6. [1]
(c) Explain why quadrat sampling is more reliable than simply observing plants by eye when estimating distribution. [2]
16. The table shows the concentration of dissolved oxygen and the number of mayfly nymphs (a species indicator of clean water) at different points along a river.
| Distance Downstream (km) | Dissolved Oxygen (mg/L) | Mayfly Nymphs (per m²) |
|---|---|---|
| 0 (source) | 9.5 | 45 |
| 5 | 8.2 | 38 |
| 10 | 4.1 | 12 |
| 15 | 2.5 | 2 |
| 20 | 6.8 | 8 |
| 25 | 8.5 | 30 |
(a) Describe the relationship between dissolved oxygen concentration and mayfly nymph population. [2]
(b) At 10 km downstream, a sewage outflow pipe discharges waste into the river. Explain how this discharge could cause the low dissolved oxygen observed at 15 km. [3]
(c) Explain why the dissolved oxygen concentration increases again at 20 km and 25 km. [2]
17. Deforestation in tropical regions has significant ecological consequences. Explain how deforestation can lead to:
(a) reduced biodiversity; [2]
(b) increased atmospheric carbon dioxide levels; [2]
(c) soil erosion and reduced soil fertility. [3]
Section D: Extended Response (Questions 18–20)
Answer in the spaces provided. Marks are shown in brackets.
18. A student investigated the effect of light intensity on the rate of photosynthesis in an aquatic plant. The student placed the plant at different distances from a light source and counted the number of oxygen bubbles produced per minute.
| Distance from Light Source (cm) | Light Intensity (arbitrary units) | Bubbles per Minute |
|---|---|---|
| 5 | 100 | 45 |
| 10 | 50 | 28 |
| 20 | 25 | 15 |
| 40 | 12.5 | 7 |
| 80 | 6.25 | 3 |
(a) Explain why the number of bubbles produced indicates the rate of photosynthesis. [2]
(b) Describe and explain the trend shown in the data. [3]
(c) The student repeated the experiment with the lamp at 5 cm but placed a beaker of ice-cold water around the test tube containing the plant. The bubbles per minute decreased to 12. Explain this result. [3]
19. Invasive species can cause significant disruption to ecosystems. The cane toad (Rhinella marina) was introduced to Australia in 1935 to control agricultural pests. Since introduction, cane toad populations have expanded rapidly, and native predator populations have declined.
(a) Explain why the cane toad population expanded rapidly after its introduction. [3]
(b) Native predators that attempt to eat cane toads often die. Suggest two characteristics of cane toads that could explain this. [2]
(c) Describe two long-term evolutionary responses that could occur in native predator populations exposed to cane toads. [3]
20. Sustainable development aims to meet current human needs without compromising the ability of future generations to meet their own needs. With reference to specific examples, discuss how the following strategies can contribute to sustainable use of ecosystems:
- conservation of endangered species;
- sustainable harvesting of fish stocks;
- reforestation projects. [6]
END OF QUIZ
Answers
Secondary 3 Biology Quiz - Ecology: Answer Key
Total Marks: 50
Section A: Multiple Choice (Questions 1–5)
1. C — Predation pressure [2 marks]
Explanation: Biotic factors are living or once-living components of an ecosystem. Predation pressure involves interactions between organisms (a predator and its prey). Light intensity (A), soil pH (B), and temperature (D) are all abiotic (non-living) factors. Understanding the distinction between biotic and abiotic factors is fundamental to analyzing ecosystems—biotic factors involve organisms and their interactions, while abiotic factors are the physical and chemical conditions of the environment.
2. B — Crabs [2 marks]
Explanation: In the mangrove food web shown, T2 represents the primary consumer trophic level. Primary consumers are herbivores that feed directly on producers (plants). Mangrove trees (A) are producers (T1). Herons (C) are likely tertiary or quaternary consumers feeding on fish. Bacteria and fungi (D) are decomposers, not part of the main trophic level numbering. Crabs in mangrove ecosystems typically feed on decaying leaf matter and are important primary consumers or detritivores occupying the second trophic level.
3. C — 0.48 [2 marks]
Explanation: Using the Hardy-Weinberg equilibrium equations:
Step 1: State the Hardy-Weinberg equations:
- p+q=1 (allele frequencies)
- p2+2pq+q2=1 (genotype frequencies)
Where p = frequency of dominant allele (B), q = frequency of recessive allele (b)
Step 2: Given information:
- q=0.4 (frequency of recessive allele b)
Step 3: Calculate p:
- p=1−q=1−0.4=0.6
Step 4: Calculate heterozygote frequency (2pq):
- 2pq=2×0.6×0.4=0.48
Marking note: Common error: Students may calculate q2=0.16 (homozygous recessive frequency) or p2=0.36 (homozygous dominant frequency) and select these instead. The heterozygote frequency is always 2pq, not pq.
4. C — They break down dead organic matter and release mineral ions [2 marks]
Explanation: Decomposers (bacteria and fungi) secrete extracellular enzymes that digest complex organic compounds in dead organisms and waste products into simpler, inorganic mineral ions. These mineral ions are then released into the soil or water, making them available for uptake by plants. This process is essential for nutrient cycling.
Nitrogen fixation (A) is performed by nitrogen-fixing bacteria, not all decomposers. Photosynthesis (B) produces oxygen and organic compounds, not release of CO₂. Carbon fixation (D) describes what producers do during photosynthesis.
5. C — Stationary phase [2 marks]
Explanation: During the stationary phase, population growth ceases because the birth rate equals the death rate. Environmental resistance factors—such as nutrient depletion, waste accumulation, and limited space—become significant enough to balance the population's reproductive rate.
- Lag phase: No reproduction occurring, individuals adapting to new conditions
- Log phase: Birth rate exceeds death rate significantly (exponential growth)
- Death phase: Death rate exceeds birth rate, population declines
The graph shows the characteristic sigmoid (S-shaped) curve of population growth in a closed system with limited resources.
Section B: Short Answer Questions (Questions 6–12)
6. [3 marks]
Definition: An ecosystem is a biological community of interacting organisms (biotic components) together with their physical environment (abiotic components), functioning as a system. [1 mark]
Two essential components:
- Producers/autotrophs — organisms that can synthesize organic compounds from inorganic substances (e.g., plants through photosynthesis), forming the base of energy input [1 mark]
- Decomposers — organisms that break down dead organic matter and recycle nutrients back into the ecosystem, ensuring nutrient cycling continues [1 mark]
Alternative acceptable components: Consumers (for energy transfer through trophic levels); abiotic factors such as light, water, minerals (for enabling biological processes)
7. [3 marks]
Key reasons for ~10% energy transfer efficiency:
(1) Energy lost as heat during respiration — Organisms use much of the energy they obtain for metabolic processes (cellular respiration), and this energy is ultimately lost as heat to the environment, following the second law of thermodynamics. [1 mark]
(2) Energy not assimilated/ingested — Not all biomass of the prey is consumed (some parts are inedible, such as bones, fur, or roots), and not all consumed material is digested and absorbed; some passes out as feces. [1 mark]
(3) Energy used for life processes and not stored — Energy is expended on movement, growth, reproduction, maintaining body temperature (in endotherms), and other biological activities before any remains to be incorporated into new biomass. [1 mark]
8. [4 marks total]
(a) Net population change for 2023 [2 marks]
Working:
- Net change = Births − Deaths
- Net change = 520 − 530 = −10 individuals
Or expressed as: population decreased by 10 [1 mark for correct method, 1 mark for correct answer with sign/direction]
(b) Prediction for 2024 [2 marks]
Prediction: The population is likely to decrease in 2024. [1 mark]
Reason: In 2023, the number of deaths (530) exceeded the number of births (520), resulting in a negative net change. If this trend continues—or if the population has reached or exceeded the carrying capacity of the lake—the population will decline. Alternatively, students may note that deaths are increasing faster than births over the 2019–2023 period. [1 mark]
Acceptable alternative: Remain stable if student argues the small negative change is within normal fluctuation and carrying capacity has been reached, with appropriate justification.
9. [2 marks]
| Habitat | Niche |
|---|---|
| The place or physical environment where an organism lives [0.5 mark] | The role or functional position of an organism in its ecosystem [0.5 mark] |
| Describes the address of an organism | Describes the profession/way of life of an organism |
| Example: A woodland floor under oak trees | Example: An earthworm that aerates soil, decomposes leaf litter, and is prey for birds [1 mark for any accurate distinguishing feature or example] |
Key distinction: Two species can share the same habitat but have different niches (resource partitioning); no two species can occupy exactly the same niche indefinitely (competitive exclusion principle).
10. [3 marks total]
(a) Nitrogen fixation [1 mark]
(b) Nitrogen fixation is essential because: [2 marks]
- Atmospheric nitrogen (N2) is very inert and cannot be used directly by most plants [1 mark]
- Nitrogen-fixing bacteria convert inert atmospheric nitrogen into ammonium ions (NH4+), which can then be converted to nitrates (NO3−) usable by plants for synthesizing proteins and nucleic acids [1 mark]
Note: Plants require nitrogen for amino acids, proteins, chlorophyll, and nucleic acids (DNA/RNA). Without nitrogen fixation, this essential nutrient would remain unavailable in forms plants can absorb.
11. [4 marks total]
(a) Percentage energy transfer [2 marks]
Working:
- Energy transfer percentage = Biomass at previous levelBiomass at next level×100
- =2500250×100
- =101×100=10% [1 mark for method, 1 mark for correct answer]
Acceptable alternative: 10% stated directly with clear indication of which trophic levels are being compared.
(b) Two reasons for low energy transfer: [2 marks]
Any two of:
- Respiration losses — herbivores use energy for metabolic processes, releasing heat [1 mark]
- Inedible parts — not all producer biomass is consumed (roots, woody stems) [1 mark]
- Egestion/undigested material — some consumed material passes through as feces without being assimilated [1 mark]
- Movement and other life processes — energy expended on locomotion, thermoregulation, growth, reproduction rather than biomass production [1 mark]
12. [4 marks]
| Aspect | Parasitism | Mutualism |
|---|---|---|
| Definition/relationship | One organism (parasite) benefits at the expense of another (host), which is harmed [1 mark] | Both organisms benefit from the interaction [1 mark] |
| Named example | Any accurate example: | Any accurate example: |
| — Tapeworm in human intestine | — Mycorrhizal fungi and plant roots | |
| — Aphids on rose plants | — Lichen (algae + fungus) | |
| — Mistletoe on oak tree | — Nitrogen-fixing bacteria in legume root nodules | |
| — Plasmodium causing malaria in humans | — Oxpecker birds and rhinoceros | |
| [1 mark for correct named example with both organisms identified] | [1 mark for correct named example with both organisms identified] |
Note: Examples must include both species and clearly show harm vs. benefit or mutual benefit.
Section C: Structured Response (Questions 13–17)
13. [8 marks total]
(a) Pattern of prey population (year 0–4) [2 marks]
The prey population shows oscillating/periodic fluctuations [1 mark]: starting low at year 0 (~200), increasing to a peak at year 2 (~800), then decreasing to a low again at year 4 (~180) [1 mark for describing the trend with approximate values].
(b) Why predator peak follows prey peak by ~1 year [3 marks]
- When prey population increases, there is more food available for predators [1 mark]
- This improved food supply supports higher predator survival and reproduction, or attracts more predators to the area [1 mark]
- There is a time lag because predators need time to respond numerically: increased prey leads to better predator condition and birth rates, but gestation/predator generation time means the population response is delayed [1 mark]
Alternative explanation: Predator populations are regulated by prey availability (bottom-up control); the ~1 year delay reflects the predator's intrinsic rate of increase being slower than the prey's.
(c) Prediction after 80% predator mortality in year 5 [3 marks]
Prediction: Prey population would increase initially, possibly to a higher peak; predator population would decline initially then gradually recover [1 mark for both elements]
Explanation:
- With drastically reduced predation pressure, prey deaths from predation decrease, allowing prey population to rise rapidly due to high birth rates [1 mark]
- However, without sufficient predators, prey may overgraze resources, eventually causing their own population crash; surviving predators would face temporary food shortage but could eventually recover as a new cycle establishes, or alternatively, predator recovery would be slow from small remaining population [1 mark]
14. [4 marks]
| Effect | Explanation |
|---|---|
| Ocean acidification [1 mark] | Increased CO₂ dissolves in seawater forming carbonic acid (H2CO3), lowering pH. This reduces carbonate ion availability, making it harder for calcifying organisms (corals, molluscs, some plankton) to build calcium carbonate skeletons and shells, disrupting entire reef ecosystems [1 mark] |
| Altered species distributions and phenology [1 mark] | Many marine species have narrow temperature tolerances. Warming forces migration toward poles or deeper waters, disrupting established food webs and predator-prey relationships. Coral bleaching occurs when symbiotic zooxanthellae are expelled from heat-stressed corals, destroying reef habitat for ~25% of marine species [1 mark] |
| Alternative: Reduced dissolved oxygen | Warmer water holds less dissolved oxygen, causing hypoxic "dead zones" where aerobic organisms cannot survive |
Any two valid effects with appropriate explanations accepted.
15. [5 marks total]
(a) Distribution patterns [2 marks]
- Species X: Present only in quadrats 1–3 (0–4 m from water), absent from drier areas (6–10 m); prefers/limited to wetter conditions near water's edge [1 mark]
- Species Y: Absent in quadrats 1–2 (0–2 m), present in quadrats 3–6 (4–10 m); tolerates or prefers drier conditions away from water [1 mark]
Credit for noting zone of overlap at 4 m (quadrat 3) where both coexist.
(b) Abiotic factor [1 mark]
Any valid factor:
- Soil moisture/water content — too dry for Species X further from pond
- Soil salinity — if this is a saltwater/brackish pond, salinity gradients may vary
- Soil type/texture — clay near water vs. sand further away
- Light intensity — shading by other vegetation may differ
- Soil oxygen — waterlogged soils near pond have low oxygen, which Species X may tolerate/need
(c) Why quadrat sampling is more reliable [2 marks]
- Quadrat sampling provides quantitative, objective data on presence/absence or abundance, reducing observer bias [1 mark]
- It allows systematic coverage of the study area with defined sample units, making results replicable and comparable across locations or times; random or systematic placement ensures the sample is representative of the whole area [1 mark]
16. [7 marks total]
(a) Relationship between dissolved oxygen and mayfly nymphs [2 marks]
- Mayfly nymph population decreases as dissolved oxygen decreases from source to 15 km [1 mark for negative correlation]
- Both show partial recovery after 15 km, with mayfly nymphs increasing again as oxygen rises [1 mark], or strong positive correlation between the two variables
(b) Sewage discharge and low oxygen at 15 km [3 marks]
- Sewage contains high levels of organic matter [1 mark]
- Decomposers/bacteria oxidize this organic matter, using aerobic respiration and consuming dissolved oxygen in the process (biochemical oxygen demand — BOD) [1 mark]
- This oxygen depletion (eutrophication effect) continues downstream as decomposition proceeds, reaching maximum impact some distance from the outfall; very low oxygen at 15 km represents the zone of maximum decomposition activity [1 mark]
(c) Oxygen increase at 20–25 km [2 marks]
- By 20–25 km, the organic pollutants have been largely decomposed [1 mark]
- Re-aeration from atmospheric diffusion and possibly photosynthesis by aquatic plants/algae (if light penetration improves) replenishes dissolved oxygen; additionally, fewer decomposers are now active, reducing oxygen demand [1 mark]
17. [7 marks total]
(a) Reduced biodiversity [2 marks]
- Habitat destruction removes the physical structures and microhabitats that support diverse species; tropical forests contain >50% of terrestrial species, so deforestation causes direct loss of species with narrow niches [1 mark]
- Population fragmentation isolates remaining populations, reducing gene flow and making species more vulnerable to local extinction; edge effects expose interior species to altered conditions [1 mark]
(b) Increased atmospheric CO₂ [2 marks]
- Reduced photosynthesis: Fewer trees means less CO₂ is removed from the atmosphere through carbon fixation [1 mark]
- Carbon release: Burning or decomposition of felled trees releases stored carbon; deforestation accounts for ~10–15% of global anthropogenic CO₂ emissions [1 mark]
(c) Soil erosion and reduced fertility [3 marks]
- Reduced root binding: Tree roots stabilize soil; without them, rain and wind erode topsoil, removing the most fertile layer [1 mark]
- Reduced leaf litter input: Fewer leaves fall to form humus, reducing organic matter and nutrient cycling [1 mark]
- Nutrient leaching: Without tree canopy interception, heavy rainfall hits soil directly, washing away soluble mineral ions (especially nitrates and potassium) before plants can absorb them; reduced shade also increases soil temperature and decomposition rates, further accelerating nutrient loss [1 mark]
Section D: Extended Response (Questions 18–20)
18. [8 marks total]
(a) Why bubbles indicate photosynthesis rate [2 marks]
- The aquatic plant produces oxygen gas as a by-product of photosynthesis during the light-dependent reactions (photolysis of water) [1 mark]
- Counting bubbles provides a measurable, indirect indication of photosynthetic rate assuming other factors are constant; more bubbles = more O₂ produced = faster photosynthesis [1 mark]
Note: This method assumes bubble size is relatively constant; in practice, bubble size variation introduces error.
(b) Trend description and explanation [3 marks]
Description: As light intensity decreases (with increasing distance), the rate of photosynthesis decreases [1 mark]; the relationship is not linear — the rate drops most sharply between 5–20 cm, then continues to decline more gradually [0.5 mark for noting non-linearity].
Explanation:
- Light provides the energy input for photosynthesis; at higher light intensities, more photons excite chlorophyll molecules, increasing the rate of the light-dependent reactions [1 mark]
- However, at very high intensities (below 5 cm), other factors (CO₂ concentration, temperature, enzyme capacity) may become limiting, which is why the highest rate doesn't increase without bound; the decline with distance follows the inverse square law of light intensity [0.5 mark]
(c) Effect of cold water [3 marks]
- The low temperature reduces enzyme activity involved in photosynthesis (e.g., Rubisco in the Calvin cycle, ATP synthase) [1 mark]
- Kinetic energy of molecules decreases, so collisions between enzymes and substrates are less frequent and less successful, slowing both light-dependent and light-independent reactions [1 mark]
- Even though light intensity is optimal at 5 cm, temperature becomes the limiting factor, reducing the overall rate of photosynthesis and hence oxygen bubble production; note that very low temperatures can also damage cellular structures [1 mark]
19. [8 marks total]
(a) Rapid expansion of cane toad population [3 marks]
- Lack of natural predators/parasites in Australia that have co-evolved with cane toads; native predators are naive and susceptible, so toads experience little mortality from predation [1 mark]
- High reproductive output — female cane toads produce thousands of eggs, and suitable aquatic breeding sites are abundant in tropical northern Australia [1 mark]
- Generalist feeding habits — cane toads consume a wide variety of invertebrates, allowing them to exploit diverse habitats; favorable climate with adequate moisture supports year-round activity and breeding in northern regions [1 mark]
(b) Characteristics causing native predator death [2 marks]
Any two of:
- Bufotoxin secretion — parotoid glands behind eyes and on back secrete potent cardiotoxic and neurotoxic bufotoxins when threatened, causing cardiac arrest in predators [1 mark]
- Aposematic (warning) coloration — conspicuous coloration advertises toxicity, but native predators have not evolved recognition of these warning signals [1 mark]
- Large body size relative to prey — heavy toxin load makes even small toads lethal to medium-sized predators; tadpoles and metamorphs are also toxic [1 mark]
(c) Long-term evolutionary responses in native predators [3 marks]
Any three of:
- Behavioral adaptation: Learned or innate avoidance behavior — predators that survive initial encounters may learn to avoid toads; this can spread culturally or genetically [1 mark]
- Physiological resistance: Evolution of toxin tolerance through natural selection favoring individuals with genetic variants that reduce toxin sensitivity (e.g., modified sodium channels in heart cells that are less affected by bufotoxin) [1 mark]
- Morphological adaptation: Reduced gape size or changed prey preferences through natural selection, making toads too large to ingest or energetically unprofitable; some snake species have shown rapid evolution of smaller heads in toad-exposed populations [1 mark]
- Population genetic change: Shift in allele frequencies over generations as susceptible genotypes are removed from the population, leading to directional selection for toad resistance [1 mark]
20. [6 marks]
Mark allocation: 2 marks per strategy, requiring specific examples and clear links to sustainability.
| Strategy | Discussion with Example |
|---|---|
| Conservation of endangered species [2 marks] | Establishing protected areas/national parks (e.g., Tabin Wildlife Reserve in Sabah for orangutans) prevents habitat destruction and hunting, preserving genetic diversity; captive breeding programs (e.g., Singapore Zoo's breeding of Sumatran tigers) can maintain populations and support reintroduction; legislation (e.g., CITES trade restrictions) reduces direct exploitation. These maintain ecosystem integrity and option values for future generations. [1 mark for specific example, 1 mark for explanation of sustainability contribution] |
| Sustainable harvesting of fish stocks [2 marks] | Implementation of quotas and fishing seasons based on maximum sustainable yield (MSY) calculations prevents stock collapse; mesh size regulations protect juvenile fish, allowing breeding before capture; marine protected areas (e.g., Kimbe Bay, PNG) allow stock recovery and spillover to adjacent fishing grounds; aquaculture reduces pressure on wild stocks. These ensure fish populations replenish for continuous harvest rather than boom-and-bust depletion. [1 mark for specific example, 1 mark for sustainability explanation] |
| Reforestation projects [2 marks] | Planting native species (e.g., Singapore's reforestation of Bukit Timah Nature Reserve buffer zones) restores ecosystem services: carbon sequestration mitigates climate change, watershed protection reduces flooding and maintains water quality, habitat connectivity allows wildlife movement; agroforestry integrates trees with crops for sustainable livelihoods. Community-based projects (e.g., Kenya's Green Belt Movement) ensure local ownership and long-term maintenance, addressing both ecological and human needs. [1 mark for specific example, 1 mark for sustainability explanation] |
Marking descriptors for 6-mark essay:
- 6 marks: All three strategies discussed with specific, accurate examples; clear explanation of how each contributes to sustainability (meeting current needs without compromising future capacity); coherent structure; use of appropriate ecological terminology
- 4–5 marks: Two strategies well-developed with examples, or all three with less specific detail; some explanation of sustainability
- 2–3 marks: One or two strategies mentioned with limited examples; weak link to sustainability
- 0–1 mark: Vague or incorrect content, no specific examples
END OF ANSWER KEY
Free quiz and exam paper access
Enter your details to view this paper
Your access is remembered on this device.