AI Generated Quiz
Secondary 3 Biology Ecology Quiz
Free Sec 3 Biology Ecology quiz, HY3 AI version, with questions, answers, and O Level-style practice for Singapore students.
These static practice materials are generated from the site's syllabus and paper-generation workflow, with source and model context shown so students and parents can evaluate the material before use.
Questions
Free quiz and exam paper access
Enter your details to view this paper
Your access is remembered on this device.
Answers
Secondary 3 Biology Quiz - Ecology: Answer Key
Total Marks: 40
Note: This is syllabus-first practice content from LLM-inferred templates, not past-year exam derived.
1. B [1]
Teaching note: An ecosystem includes all living organisms (biotic) and non-living components (abiotic) in a habitat interacting as a system. A is a population; C is only abiotic; D is a simplified food chain.
2. C [1]
Teaching note: The canopy is the top layer of trees receiving direct sunlight. Forest floor gets least light; understory is below canopy; roots are underground.
3. B [1]
Teaching note: Abiotic = non-living (temperature, water, light, soil). Earthworm, fungus, grass are biotic (living).
4. B [1]
Teaching note: Population = same species in a given area. Community = multiple species; ecosystem = living + non-living.
5. B [1]
Teaching note: Producer makes own food by photosynthesis (grass). Mushroom/fungus = decomposer; hawk = consumer; earthworm = decomposer.
6. [2]
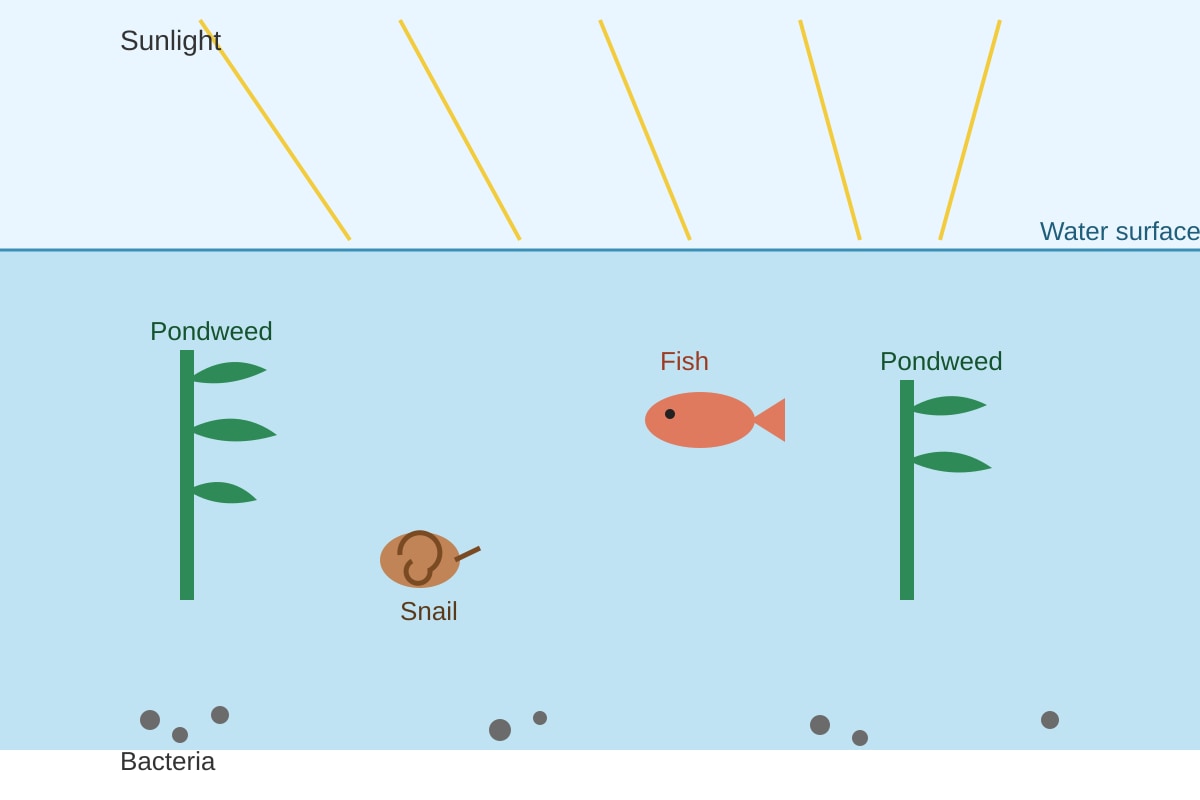
Abiotic (any two): temperature, light, pH, dissolved oxygen, water flow.
Biotic (any two): fish, algae, bacteria, snails.
(1 mark for two correct abiotic, 1 mark for two correct biotic)
7. [2]
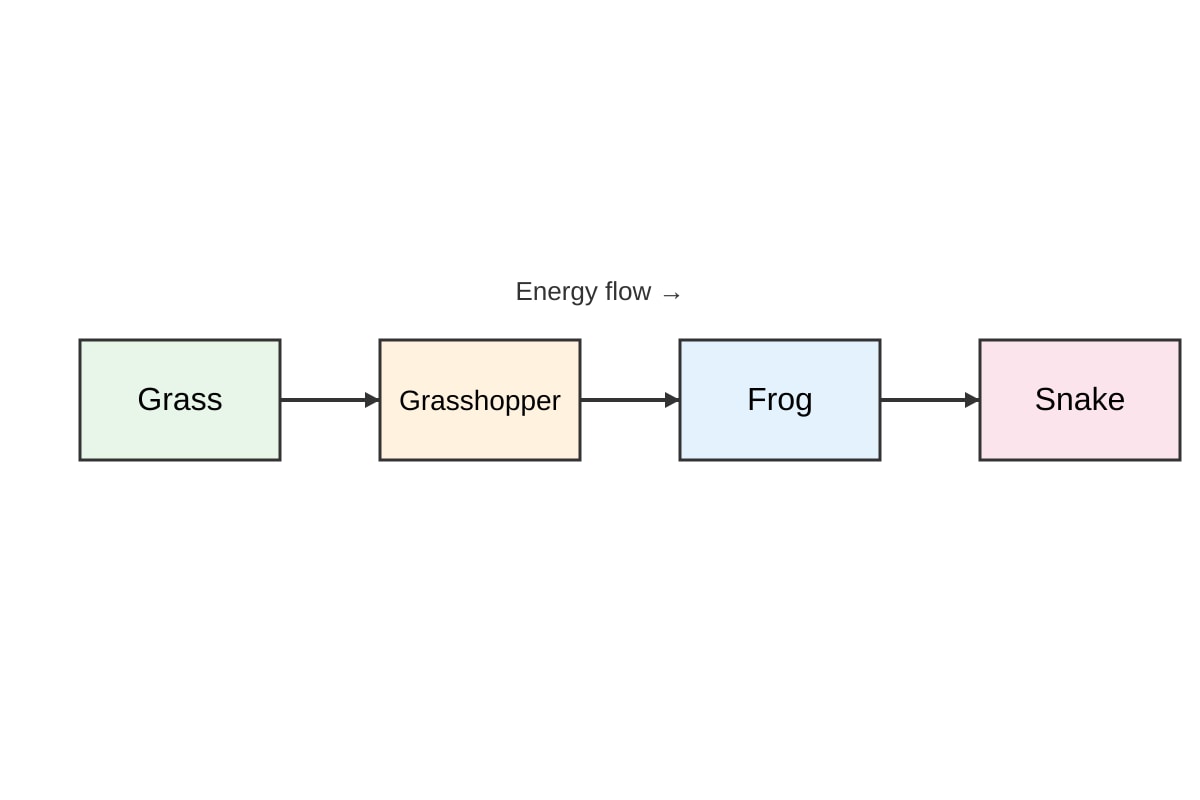
Food chain: single linear sequence of feeding relationships (e.g., grass → grasshopper → frog).
Food web: network of many interconnected food chains showing complex feeding relationships.
(1 mark each)
8. [2]
Deforestation reduces trees that absorb CO₂ during photosynthesis, so atmospheric CO₂ rises / less carbon stored in biomass.
(2 marks for clear explanation; 1 mark for stating fewer trees)
9. [2]
Examples: use public transport, reduce meat consumption, recycle, use less plastic, plant trees.
(1 mark each, any two)
10. [3]
Meaning: variety of living organisms (species, genetic, ecosystem diversity). [1]
Importance: stable ecosystems, resilience to change, provides resources/food, medicines. [2]
Marking: 1 for meaning, 2 for valid importance points.
11. [2]
Producer: Grass [1]
Tertiary consumer: Snake [1]
From image: grass is first (producer), snake is fourth (tertiary consumer).
12. [2]
Frog eats grasshopper, so fewer grasshoppers means less food for frogs → frog population decreases. [2]
(1 for link, 1 for outcome)
13. [2]
Snail numbers are highest at 6 am (40) and 6 pm (35), lowest at 12 pm (10). Pattern: more active in cool/low-light periods, fewer at midday. [2]
14. [2]
Snails avoid heat/light at midday to prevent drying out (desiccation) / predators more active. [2]
(any valid reason)
15. [2]
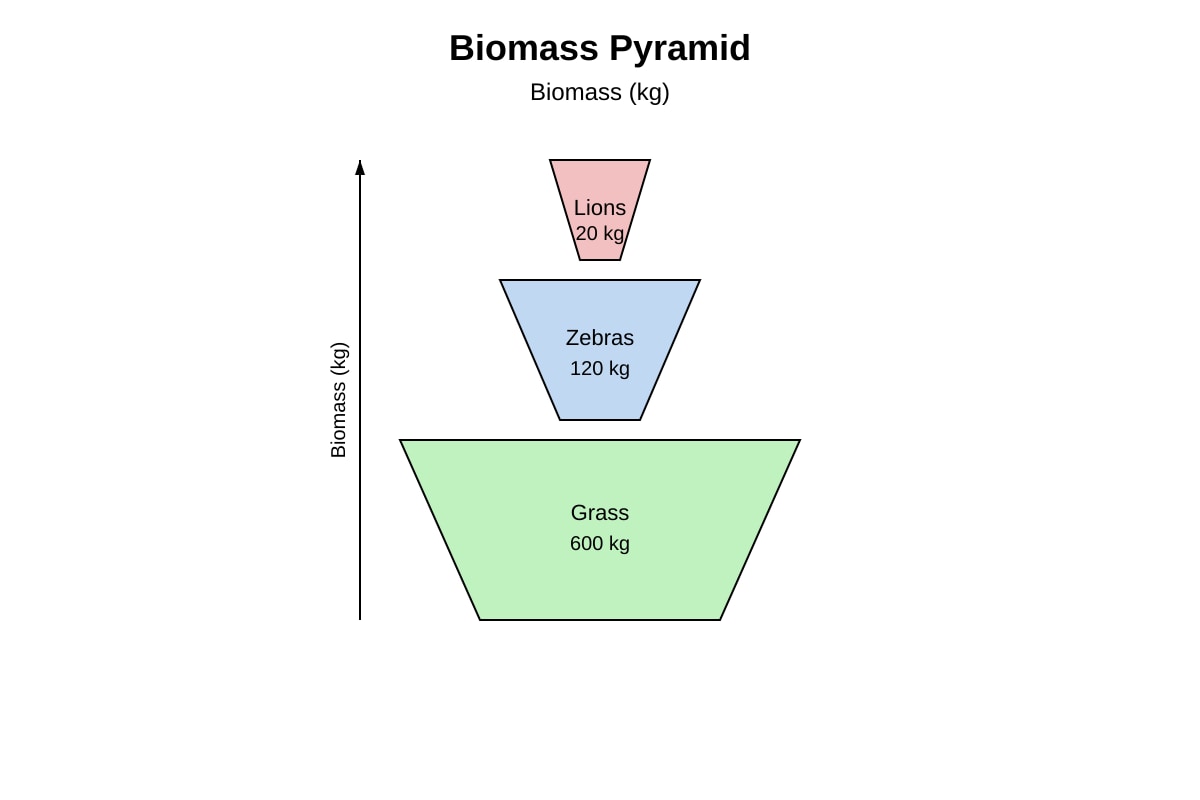
Working: (120 / 600) × 100 = 20% [1]
Answer: 20% [1]
Teaching: biomass transfer % = (biomass at level 2 ÷ level 1) × 100.
16. [3]
- Not all ingested food is digested/absorbed (some lost as faeces). [1]
- Energy lost as heat in respiration. [1]
- Some parts not consumed (e.g., bones, roots). [1]
17. [2]
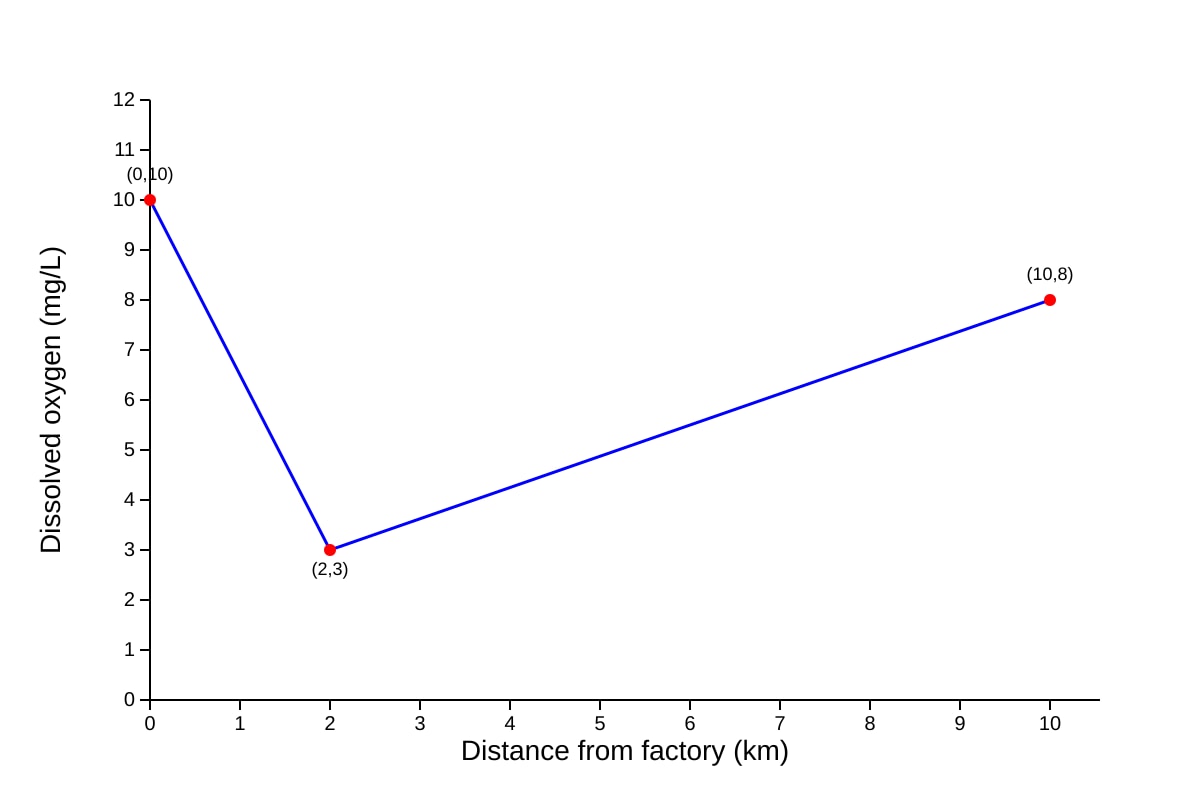
Oxygen drops sharply near factory (10 → 3 mg/L at 2 km), then partially recovers downstream to 8 mg/L. [2]
(1 for drop, 1 for recovery)
18. [1]
Any: untreated sewage, organic waste, hot water (thermal), chemicals. [1]
19. [2]
Decomposer: Bacteria [1]
Role: break down dead organisms/waste, recycle nutrients to pondweed. [1]
20. [3]
- Species may shift to cooler areas / higher altitude / poles. [1]
- If unable to migrate, population declines or goes extinct. [1]
- Changes breeding/feeding timing mismatched with food. [1]
(3 marks for three distinct effects)