AI Generated Exam Paper
Secondary 3 Biology Practice Paper 3
Free Sec 3 Biology Practice Paper 3, Kimi2.6 AI version, with questions, answers, and O Level-style practice for Singapore students.
These static practice materials are generated from the site's syllabus and paper-generation workflow, with source and model context shown so students and parents can evaluate the material before use.
Questions
TuitionGoWhere Practice Paper - Biology Secondary 3
TuitionGoWhere Practice Paper (AI)
Subject: Biology
Level: Secondary 3 (G3/Express)
Paper: Practice Paper
Version: 3 of 5
Duration: 1 hour 15 minutes
Total Marks: 60
Name: _________________________ Class: _________ Date: _________
Instructions to Candidates
- Write your name, class, and date in the spaces provided.
- This paper consists of THREE sections: A, B, and C.
- Answer ALL questions.
- Write your answers in the spaces provided. Additional paper may be used if necessary.
- Section A: Multiple Choice Questions (10 marks)
- Section B: Structured Questions (30 marks)
- Section C: Data Response and Extended Writing (20 marks)
- The use of calculators is not permitted.
- Cell phones and smart devices must be turned off and placed away from your desk.
SECTION A: Multiple Choice Questions [10 marks]
Answer ALL questions. Each question carries 1 mark.
1. Which of the following structures is found in plant cells but NOT in animal cells?
A) Mitochondria
B) Golgi body
C) Cell wall
D) Ribosomes
2. A cell is supplied with radioactive amino acids. Which organelle would first show an increase in radioactivity?
A) Golgi body
B) Rough endoplasmic reticulum
C) Smooth endoplasmic reticulum
D) Mitochondria
3. Which biomolecule is correctly matched with its monomer?
| Biomolecule | Monomer | |
|---|---|---|
| A | Starch | Fatty acid |
| B | Protein | Amino acid |
| C | Lipid | Monosaccharide |
| D | Glycogen | Nucleotide |
4. The enzyme amylase is most active at pH 7. What would happen to amylase activity at pH 2?
A) Activity increases due to increased hydrogen ion concentration
B) Activity decreases because the enzyme denatures
C) Activity remains unchanged as pH does not affect enzymes
D) Activity increases as starch hydrolysis is faster in acidic conditions
5. Which statement about the fluid mosaic model of membrane structure is correct?
A) Proteins are fixed in position and cannot move
B) Phospholipids have hydrophilic tails and hydrophobic heads
C) Cholesterol increases membrane fluidity at low temperatures
D) The membrane is composed entirely of proteins
6. During diffusion, molecules move:
A) Against their concentration gradient, requiring ATP
B) Down their concentration gradient, requiring ATP
C) Down their concentration gradient, without ATP
D) Against their concentration gradient, without ATP
7. Which organelle is responsible for packaging and modifying proteins for secretion?
A) Ribosome
B) Lysosome
C) Golgi body
D) Nucleolus
8. A solution has a water potential of -500 kPa. Pure water has a water potential of 0 kPa. What will happen to a plant cell placed in this solution?
A) The cell will become turgid
B) Water will enter the cell by osmosis
C) The cell will lose water and become flaccid
D) There will be no net movement of water
9. Which test would give a positive result for a reducing sugar?
A) Biuret test — purple coloration
B) Benedict's test — brick-red precipitate
C) Iodine test — blue-black coloration
D) Ethanol emulsion test — white emulsion
10. The following diagram shows an enzyme-catalyzed reaction.
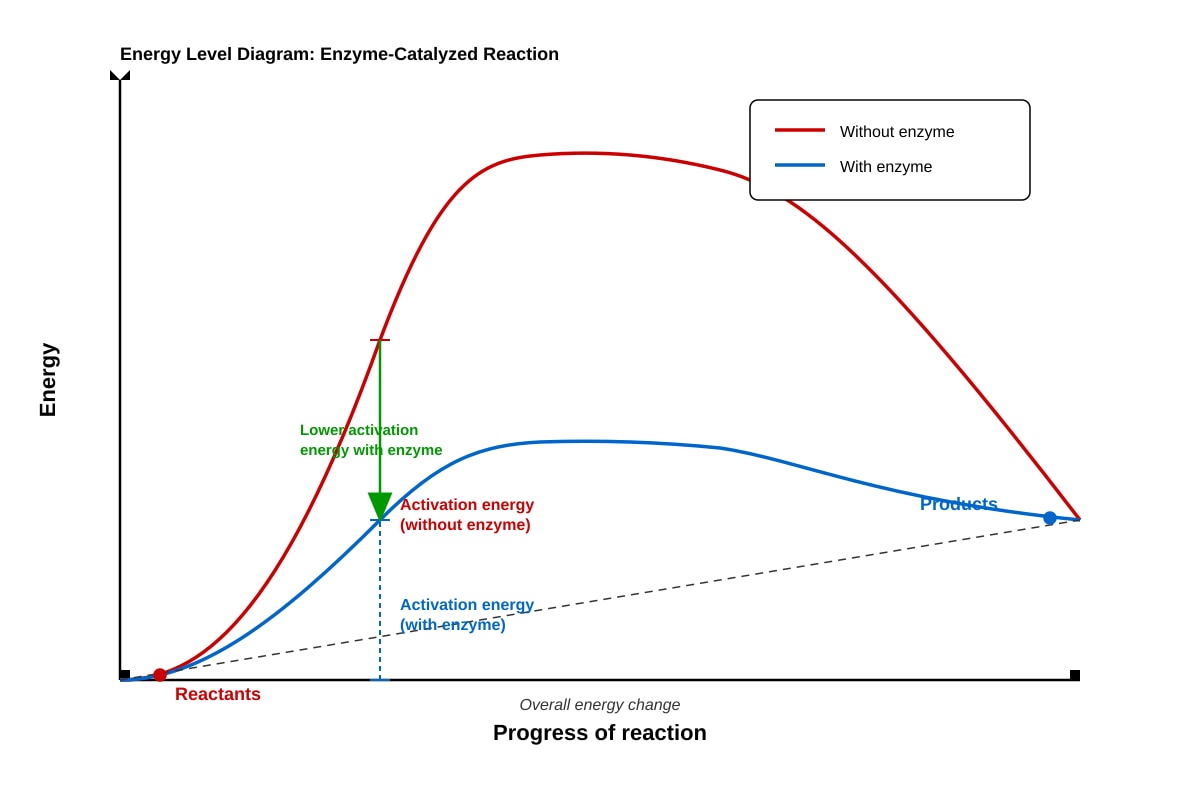
Generated diagram for Q10.
What does this diagram demonstrate about enzymes?
A) Enzymes increase the overall energy change of the reaction
B) Enzymes provide energy to start the reaction
C) Enzymes lower the activation energy required
D) Enzymes change the products formed in the reaction
SECTION B: Structured Questions [30 marks]
Answer ALL questions.
11. The diagram below shows an animal cell as seen under an electron microscope.
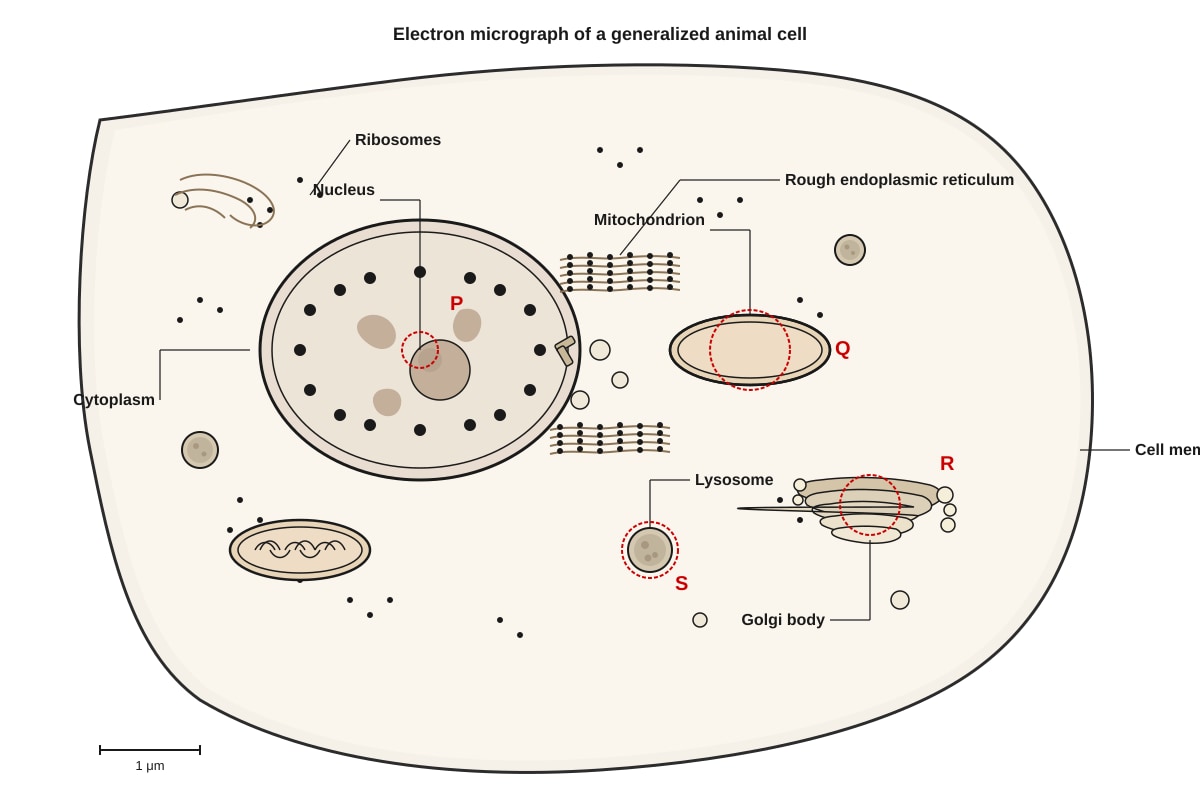
Generated diagram for Q11.
(a) Identify structures P, Q, R, and S using the labels provided in the diagram. [2 marks]
P: _________________________
Q: _________________________
R: _________________________
S: _________________________
(b) Explain how the structure of the rough endoplasmic reticulum is related to its function in protein synthesis. [3 marks]
(c) Mitochondria are often described as the "powerhouses" of the cell. Explain this description with reference to their structure and function. [3 marks]
[Total: 8 marks]
12. An investigation was carried out to study the effect of temperature on the activity of the enzyme catalase. Potato extract was used as a source of catalase. Hydrogen peroxide solution was the substrate. The volume of oxygen gas produced in 2 minutes was measured at different temperatures.
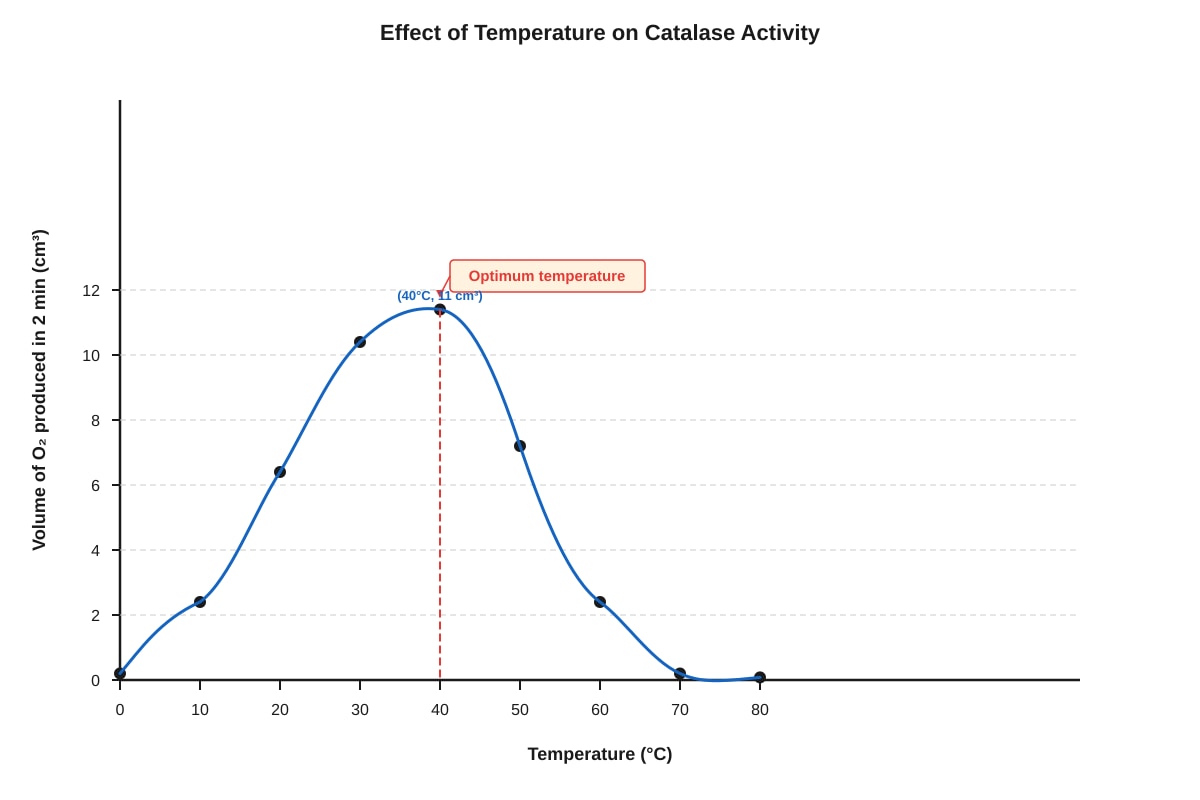
Generated graph for Q12.
(a) State the optimum temperature for catalase activity in this investigation. [1 mark]
(b) Describe the trend shown between 0°C and 40°C. Explain your answer in terms of kinetic energy and enzyme-substrate collisions. [3 marks]
(c) Explain why the volume of oxygen produced decreases above 40°C. [3 marks]
(d) Suggest two variables that must be kept constant in this investigation to ensure valid results. [2 marks]
[Total: 9 marks]
13. The diagram below shows the fluid mosaic model of the cell membrane.
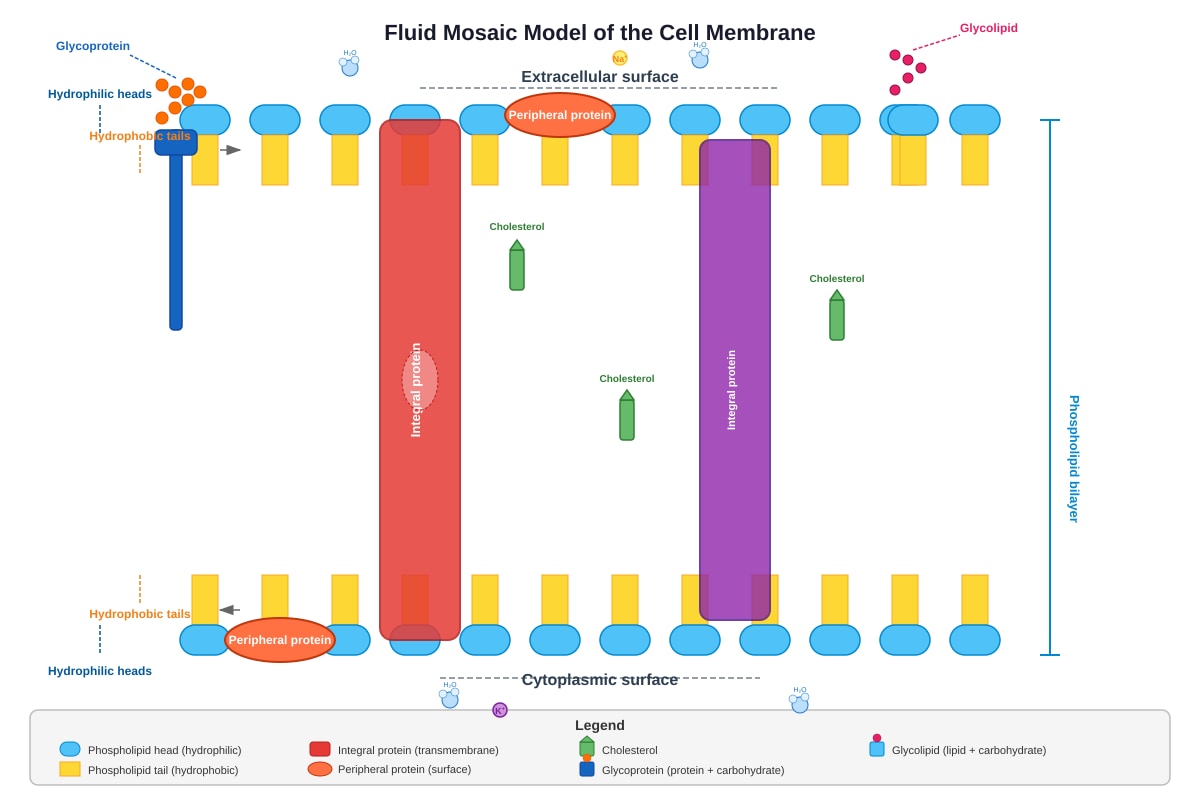
Generated diagram for Q13.
(a) Describe the arrangement of phospholipid molecules in the membrane and explain how this arrangement is related to their properties. [3 marks]
(b) Glycoproteins and glycolipids on the cell surface membrane have important functions. State two functions of glycoproteins. [2 marks]
(c) Explain why the cell membrane is described as "fluid" and "mosaic." [4 marks]
[Total: 9 marks]
14. The table below shows the results of biochemical tests carried out on two food samples, X and Y.
| Biochemical test | Sample X | Sample Y |
|---|---|---|
| Benedict's test (heated) | Brick-red precipitate | Remains blue |
| Iodine test | Brown/orange | Blue-black |
| Biuret test | Purple | Purple |
| Ethanol emulsion test | Clear solution | White emulsion |
(a) Identify the types of biomolecules present in sample X. Justify your answer using the test results. [3 marks]
(b) Identify the types of biomolecules present in sample Y. Justify your answer using the test results. [3 marks]
[Total: 6 marks]
SECTION C: Data Response and Extended Writing [20 marks]
Answer ALL questions.
15. In an experiment, red blood cells were placed in different solutions and observed under a microscope. The results are shown in the table below.
| Solution | Concentration of solute (%) | Observation after 30 minutes |
|---|---|---|
| A | 0.0 (distilled water) | Cells swelled and burst |
| B | 0.9 | Cells remained normal in appearance |
| C | 5.0 | Cells shrank and appeared crenated |
(a) Explain the observation for cells placed in solution A in terms of water potential and osmosis. [4 marks]
(b) Explain why solution B is described as "isotonic" to the red blood cells. [2 marks]
(c) A sports drink is designed to rehydrate athletes quickly. Explain whether a drink with solute concentration similar to solution C would be effective for this purpose. [2 marks]
[Total: 8 marks]
16. Enzymes are biological catalysts that play essential roles in living organisms. The lock and key hypothesis and the induced fit hypothesis are two models used to explain how enzymes work.
(a) Describe the lock and key hypothesis of enzyme action. [3 marks]
(b) The induced fit hypothesis provides an improved explanation of enzyme action. Describe how this hypothesis differs from the lock and key hypothesis and explain why it better explains certain experimental observations. [4 marks]
(c) The enzyme papain is used commercially to tenderize meat. Papain breaks down proteins into smaller peptides. A manufacturer wants to optimize the production of papain.
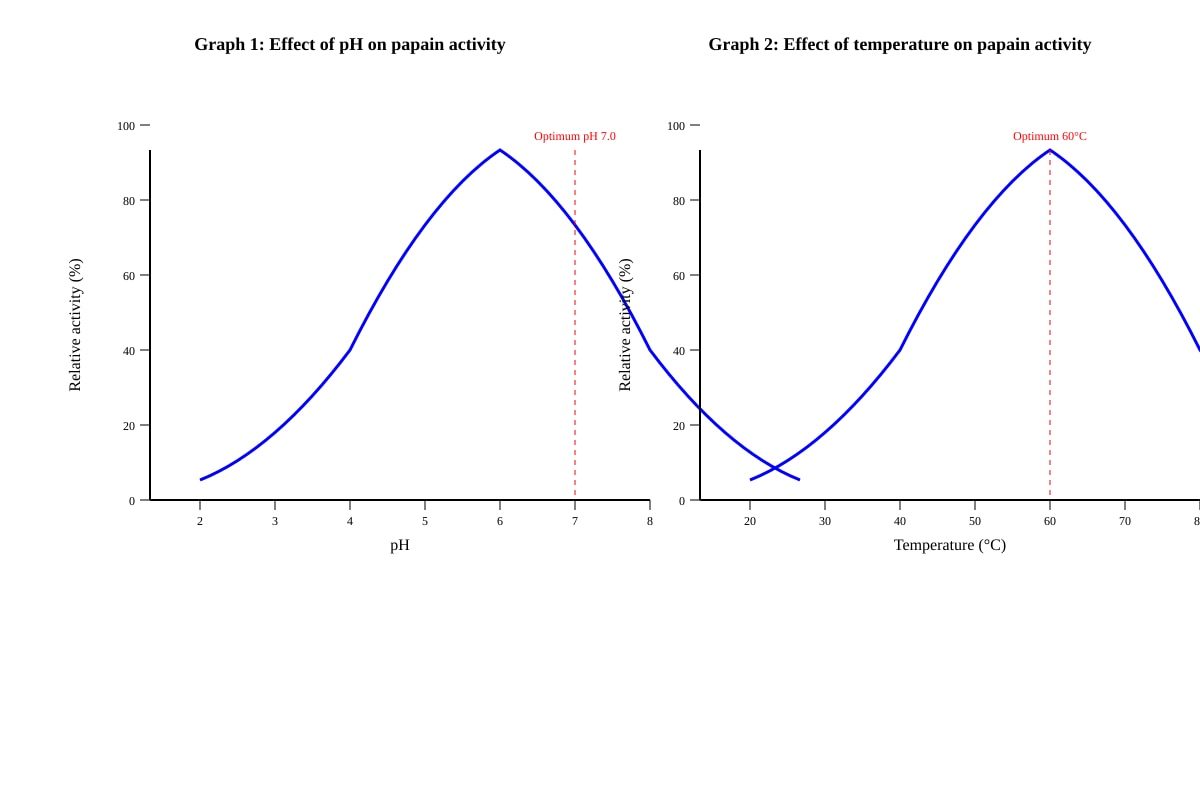
Generated graph for Q16c.
Using the information in the graphs, explain why papain is suitable for tenderizing meat during cooking, and explain what would happen if meat were marinated in papain solution at room temperature (25°C) compared to at 60°C. [5 marks]
[Total: 12 marks]
END OF PAPER
Answers
TuitionGoWhere Practice Paper - Biology Secondary 3
Answer Key and Marking Scheme
Version: 3 of 5
Total Marks: 60
SECTION A: Multiple Choice Questions [10 marks]
1. C — Cell wall [1 mark]
Teaching note: Plant cells have a cellulose cell wall outside the cell membrane, providing structural support. Animal cells lack this structure. Mitochondria, Golgi body, and ribosomes are found in both cell types.
2. B — Rough endoplasmic reticulum [1 mark]
Teaching note: Radioactive amino acids are used for protein synthesis. Ribosomes on the rough ER are the first organelles to incorporate these amino acids into polypeptide chains. The protein then moves to the Golgi body for modification. The RER is the entry point of the secretory pathway.
Common mistake: Students often select Golgi body because they associate "packaging" with being first, but synthesis precedes packaging.
3. B — Protein : Amino acid [1 mark]
Teaching note:
- Starch → glucose/maltose (monosaccharides)
- Protein → amino acids
- Lipids → glycerol and fatty acids
- Glycogen → glucose (monosaccharide)
4. B — Activity decreases because the enzyme denatures [1 mark]
Teaching note: Amylase has an optimum pH of approximately 7 (neutral). At pH 2 (strongly acidic), excess H⁺ ions disrupt the ionic bonds and hydrogen bonds that maintain the enzyme's specific 3D shape. The active site changes shape (denaturation), so substrate can no longer bind effectively.
5. C — Cholesterol increases membrane fluidity at low temperatures [1 mark]
Teaching note:
- A is incorrect: proteins can move laterally within the membrane
- B is incorrect: phospholipids have hydrophilic (polar) heads and hydrophobic (non-polar) tails
- C is correct: cholesterol acts as a buffer — at low temperatures it prevents phospholipids from packing too tightly (maintaining fluidity); at high temperatures it restricts movement
- D is incorrect: membranes contain lipids, proteins, and carbohydrates
6. C — Down their concentration gradient, without ATP [1 mark]
Teaching note: Diffusion is passive transport — no metabolic energy (ATP) is required. Molecules move from higher to lower concentration (down the gradient) until dynamic equilibrium is reached. This contrasts with active transport, which moves substances against their concentration gradient and requires ATP.
7. C — Golgi body [1 mark]
Teaching note: The Golgi body (or Golgi apparatus) receives proteins from the ER, modifies them (e.g., adding carbohydrate chains), packages them into vesicles, and directs them to their destination (cell membrane for secretion, lysosomes, or other organelles).
8. C — The cell will lose water and become flaccid [1 mark]
Teaching note: Water potential determines the direction of osmosis. Water moves from higher water potential to lower water potential. Pure water = 0 kPa (highest). The solution at -500 kPa has lower (more negative) water potential. Net water movement is out of the cell, causing the cytoplasm to shrink away from the cell wall (plasmolysis in plant cells) or cell becoming flaccid.
9. B — Benedict's test — brick-red precipitate [1 mark]
Teaching note:
- Benedict's test: reducing sugars → green/yellow/orange/brick-red precipitate (depending on concentration)
- Biuret test: proteins → purple
- Iodine test: starch → blue-black
- Ethanol emulsion test: lipids → white emulsion
10. C — Enzymes lower the activation energy required [1 mark]
Teaching note: The diagram shows two curves: one with higher activation energy peak (no enzyme) and one with lower peak (with enzyme). Both start at same reactant energy level and end at same product energy level. The overall energy change (ΔH) is unchanged. Enzymes provide an alternative reaction pathway with lower activation energy, increasing reaction rate without being consumed.
Expected visual features of Q10-fig1: Two curves on energy vs progress of reaction axes; uncatalyzed curve has higher peak; catalyzed curve has lower peak; horizontal arrow showing difference = activation energy reduction; both curves start and end at same energy levels showing unchanged overall energy change.
SECTION B: Structured Questions [30 marks]
11. (a) [2 marks]
P: Nucleus
Q: Mitochondrion
R: Rough endoplasmic reticulum
S: Golgi body
Marking: 0.5 mark each; accept reasonable proximity to labels if diagram positions vary
11. (b) [3 marks]
Marking breakdown:
- Mention of ribosomes attached to surface: [1 mark]
- Ribosomes synthesize proteins: [1 mark]
- RER provides pathway/transport for newly made proteins to Golgi body: [1 mark]
Model answer: The rough endoplasmic reticulum has ribosomes attached to its outer (cytoplasmic) surface [1]. These ribosomes are the sites of protein synthesis, where amino acids are assembled into polypeptide chains [1]. The membranes of the RER form flattened sacs (cisternae) that create channels for transporting newly synthesized proteins to the Golgi body for modification and packaging [1].
Teaching note: The "rough" appearance under EM is due to ribosomes. The membrane system provides compartmentalization and directed transport — proteins enter the lumen of the RER and travel within this membrane-bound space, keeping them separate from cytoplasmic processes.
11. (c) [3 marks]
Marking breakdown:
- Structure: double membrane with inner membrane folded into cristae: [1 mark]
- Function: site of aerobic respiration: [1 mark]
- Link: cristae increase surface area for electron transport chain and ATP synthase enzymes; matrix contains enzymes for Krebs cycle: [1 mark]
Model answer: Mitochondria are called "powerhouses" because they are the main sites of aerobic respiration, producing ATP (adenosine triphosphate), which is the usable form of energy for the cell [1]. Structurally, mitochondria have a double membrane, with the inner membrane folded into numerous cristae [1]. These cristae greatly increase the surface area available for the electron transport chain and ATP synthase enzymes, while the matrix contains enzymes for the Krebs cycle, enabling efficient ATP production [1].
Teaching note: Aerobic respiration equation: C6H12O6+6O2→6CO2+6H2O+ATP. The proton gradient across the inner mitochondrial membrane drives ATP synthesis (chemiosmosis). About 30-32 ATP per glucose are produced.
[Total for Q11: 8 marks]
12. (a) [1 mark]
40°C (accept range 35-45°C if justified from graph peak) [1 mark]
Expected visual feature: Peak of curve at 40°C on Q12-fig1.
12. (b) [3 marks]
Marking breakdown:
- Description: volume increases/steady rise: [1 mark]
- Kinetic energy increases with temperature: [1 mark]
- More frequent/energetic collisions between enzyme and substrate, more enzyme-substrate complexes form: [1 mark]
Model answer: Between 0°C and 40°C, the volume of oxygen produced increases steadily, rising from approximately 0.5 cm³ to 11 cm³ [1]. As temperature increases, the kinetic energy of both enzyme (catalase) and substrate (hydrogen peroxide) molecules increases [1]. This results in more frequent collisions and a greater proportion of collisions with sufficient energy to overcome the activation energy, forming more enzyme-substrate complexes and thus increasing the rate of reaction [1].
Teaching note: This follows the Q₁₀ effect — for every 10°C rise, rate roughly doubles (until optimum), due to increased molecular kinetic energy. The enzyme is not yet denatured in this range.
12. (c) [3 marks]
Marking breakdown:
- Decrease due to denaturation: [1 mark]
- Explanation of denaturation: bonds holding enzyme shape break, active site changes shape: [1 mark]
- Substrate can no longer fit/bind; fewer enzyme-substrate complexes form: [1 mark]
Model answer: Above 40°C, the volume of oxygen produced decreases because the enzyme catalase begins to denature [1]. The high thermal energy causes vibrations within the enzyme molecule that break the hydrogen bonds and ionic bonds maintaining its specific three-dimensional tertiary structure [1]. The active site changes shape and can no longer accommodate the hydrogen peroxide substrate molecules, so fewer enzyme-substrate complexes form and the reaction rate decreases dramatically [1].
Teaching note: Denaturation is typically irreversible. Hydrogen peroxide itself decomposes slowly without enzyme, but the uncatalyzed rate is negligible on this timescale.
12. (d) [2 marks]
Any two from: [1 mark each]
- Concentration/volume of hydrogen peroxide (substrate concentration)
- Volume/concentration of potato extract (enzyme concentration)
- pH of the solution
- Volume of reaction mixture
- Time period for measurement (2 minutes)
Teaching note: These are control variables. The independent variable is temperature; the dependent variable is volume of oxygen produced. All other factors must remain constant so that any change in oxygen volume is attributable only to temperature changes.
[Total for Q12: 9 marks]
13. (a) [3 marks]
Marking breakdown:
- Bilayer arrangement with hydrophilic heads outward and hydrophobic tails inward: [1 mark]
- Hydrophilic heads interact with aqueous environment (cytoplasm and extracellular fluid): [1 mark]
- Hydrophobic tails shielded from water, creating barrier to polar/charged substances: [1 mark]
Model answer: Phospholipids are arranged in a bilayer with their hydrophilic (water-loving) phosphate heads facing outward toward the aqueous environments on both sides, and their hydrophobic (water-fearing) fatty acid tails pointing inward, sandwiched between the two layers [1]. The hydrophilic heads interact with water molecules in the cytoplasm and extracellular fluid [1], while the hydrophobic tails are shielded from water, creating a hydrophobic core that acts as a barrier to water-soluble and charged substances, controlling what enters and leaves the cell [1].
Teaching note: Phospholipids are amphipathic — they have both hydrophilic and hydrophobic regions. This dual nature drives spontaneous bilayer formation in aqueous environments.
13. (b) [2 marks]
Any two from: [1 mark each]
- Cell recognition/identification (identifies cell as "self" or foreign)
- Cell signaling/receptors for hormones and neurotransmitters
- Cell adhesion (helping cells stick to each other or extracellular matrix)
- Immune response (antigen recognition)
Model note: Glycolipids are involved in cell-to-cell recognition and ABO blood grouping. Glycoproteins extend farther from membrane surface.
13. (c) [4 marks]
Marking breakdown:
- "Fluid": phospholipids and proteins can move laterally within membrane plane; phospholipids can rotate and undergo lateral diffusion; proteins can move unless anchored: [2 marks]
- "Mosaic": membrane contains mixture of different proteins embedded in/layered on phospholipid bilayer, creating patchwork pattern; proteins vary in size, shape, and distribution: [2 marks]
Model answer: The membrane is described as "fluid" because the phospholipid molecules are not fixed in position — they can move laterally within their own leaflet, rotate, and vibrate, while many membrane proteins can also move laterally within the phospholipid bilayer unless restrained by the cytoskeleton or cell wall [2]. It is described as "mosaic" because the membrane contains a mixture of different proteins — integral proteins spanning the membrane and peripheral proteins on the surface — embedded in or attached to the phospholipid bilayer. These proteins vary in size, shape, and distribution, creating a varied, patchwork-like appearance rather than a uniform structure [2].
Teaching note: Fluidity is affected by: temperature (higher = more fluid), fatty acid saturation (unsaturated = more fluid due to kinks), and cholesterol (buffering effect). The mosaic refers to Singer and Nicolson's 1972 model, which replaced the earlier static "sandwich" models.
[Total for Q13: 9 marks]
14. (a) [3 marks]
Marking breakdown:
- Reducing sugar present (from Benedict's test positive): [1 mark]
- Protein present (from Biuret test positive): [1 mark]
- Justification with test result details: [1 mark]
Model answer: Sample X contains reducing sugars and proteins [2]. The Benedict's test produced a brick-red precipitate when heated, which indicates the presence of reducing sugars such as glucose or maltose [0.5]. The Biuret test gave a purple coloration, indicating the presence of peptide bonds and therefore proteins [0.5]. The negative iodine test (brown/orange = no starch) and negative emulsion test confirm that starch and lipids are absent or minimal [1 for complete justification].
14. (b) [3 marks]
Marking breakdown:
- Starch present (from iodine test positive): [1 mark]
- Protein present (from Biuret test positive): [1 mark]
- Lipid present (from ethanol emulsion test positive): [1 mark]
Model answer: Sample Y contains starch, proteins, and lipids [1 mark each if all identified, cap at 3]. The iodine test produced a blue-black coloration, characteristic of the starch-iodine complex [1]. The Biuret test was purple, indicating proteins [1]. The ethanol emulsion test produced a white emulsion when mixed with water, indicating lipids [1].
Teaching note: Sample Y is likely a food like crushed peanuts or a composite food. A negative Benedict's test suggests no reducing sugars or that sucrose (non-reducing) might be present but would not react without hydrolysis first.
[Total for Q14: 6 marks]
SECTION C: Data Response and Extended Writing [20 marks]
15. (a) [4 marks]
Marking breakdown:
- Water potential of distilled water is higher (less negative) than inside cell: [1 mark]
- Water enters cell by osmosis down water potential gradient: [1 mark]
- Cell gains water, swells: [1 mark]
- No cell wall in animal cells to prevent bursting (lysis/cytolysis): [1 mark]
Model answer: Distilled water (solution A) has a water potential of 0 kPa, which is higher (less negative) than the water potential inside red blood cells [1]. Therefore, water enters the red blood cells by osmosis, moving down the water potential gradient from the external solution into the cell where solute concentration is higher [1]. As water enters, the cells gain volume and swell [1]. Since red blood cells are animal cells without a cell wall to provide structural resistance against expansion, they continue to swell until they burst, releasing their contents — a process called lysis or cytolysis [1].
Teaching note: Ψ (water potential) = solute potential (Ψs) + pressure potential (Ψp). In distilled water, Ψ=0. In cells: Ψ is negative due to dissolved solutes. Pure water has highest possible water potential.
15. (b) [2 marks]
Marking breakdown:
- Equal solute concentration/water potential: [1 mark]
- No net water movement; cell maintains normal shape: [1 mark]
Model answer: Solution B is isotonic because it has the same solute concentration (0.9% NaCl, physiological saline) and therefore the same water potential as the red blood cell cytoplasm [1]. There is no net movement of water into or out of the cells, so they maintain their normal biconcave disc shape and volume [1].
Teaching note: This is why 0.9% saline is used in medical IV drips — it prevents hemolysis (in hypotonic) or crenation (in hypertonic). Isotonic = equal tension.
15. (c) [2 marks]
Marking breakdown:
- Would NOT be effective: [1 mark]
- Hypertonic to body cells; would cause water loss rather than rehydration: [1 mark]
Model answer: A drink with solute concentration similar to solution C (5.0%) would not be effective for rehydration [1]. This solution is hypertonic to body cells, meaning it has a lower water potential than the cells. If consumed, water would move by osmosis out of body cells into the intestine, worsening dehydration rather than rehydrating the athlete [1].
Teaching note: Effective sports drinks are typically isotonic or slightly hypotonic to promote rapid absorption. Hypertonic drinks are used for energy (carbohydrate) delivery, not rehydration.
[Total for Q15: 8 marks]
16. (a) [3 marks]
Marking breakdown:
- Enzyme has specific active site with particular shape: [1 mark]
- Substrate fits exactly into active site like key in lock: [1 mark]
- Temporary enzyme-substrate complex forms, reaction occurs, products released: [1 mark]
Model answer: The lock and key hypothesis proposes that the enzyme has a specific three-dimensional active site with a unique shape that is complementary to the shape of its substrate [1]. The substrate fits precisely into the active site in the same way that a key fits into a specific lock [1]. An enzyme-substrate complex forms temporarily, the reaction occurs at the active site converting substrate to product, and then the products are released, leaving the enzyme unchanged and free to bind another substrate [1].
16. (b) [4 marks]
Marking breakdown:
- Induced fit: enzyme is flexible, active site changes shape to accommodate substrate: [2 marks]
- Difference from lock and key (rigid, pre-formed): [1 mark]
- Better explains: enzyme can bind similar substrates, binding of substrate causes conformational change that strains bonds: [1 mark]
Model answer: The induced fit hypothesis differs from the lock and key hypothesis in proposing that the active site is not rigid but is flexible and can change shape [1]. When the substrate approaches, the active site molds around the substrate, inducing a conformational change that brings catalytic residues into correct alignment [1]. Unlike the lock and key model, which suggests a rigid, perfectly pre-formed fit, induced fit better explains why some enzymes can bind molecules that are slightly different from their optimal substrate, and how binding itself can promote catalysis [1]. It also explains experimental observations that the enzyme activity can be affected by allosteric regulators and that some substrates that do not appear to fit the "lock" can still be catalyzed [1].
Teaching note: Koshland (1958) proposed induced fit as modification to Fischer's (1894) lock and key. Modern understanding incorporates both elements — some complementarity exists, but flexibility is essential. Induced fit also explains competitive inhibition (inhibitor blocks active site) and non-competitive inhibition (inhibitor binds elsewhere, changes shape).
16. (c) [5 marks]
Marking breakdown:
- Optimum pH 7 is close to meat pH/neutral, suitable for use in various preparations: [1 mark]
- Optimum temperature 60°C is close to cooking temperatures, efficient during cooking: [1 mark]
- At 25°C (room temperature): still active but below optimum, slower tenderization: [1 mark]
- At 60°C: near maximum activity, most efficient tenderization: [1 mark]
- Above 60°C would denature enzyme: [1 mark]
Model answer: Papain is suitable for tenderizing meat during cooking because its optimum pH is approximately 7, which is close to the pH of fresh meat and most marinades, and its optimum temperature is 60°C [1], which is reached during cooking processes such as stewing or braising [1]. This means the enzyme works efficiently under actual cooking conditions.
If marinated at 25°C (room temperature), papain would still be active but would work much more slowly because this temperature is well below the optimum [1]. The kinetic energy of enzyme and substrate molecules would be lower, resulting in fewer successful collisions and less efficient tenderization over the same time period [0.5]. At 60°C, the enzyme would be operating near its optimum, with maximum activity and fastest tenderization [1]. However, if the temperature rose much above 60°C during cooking, the enzyme would begin to denature and lose effectiveness [1].
Expected visual features of Q16-fig1: Left graph shows bell curve peaking at pH 7.0 with relative activity ~100%; right graph shows bell curve peaking at 60°C with relative activity ~100%. Both curves decline on either side of optimum. The pH graph likely shows minimal activity at pH 2 and 10; temperature graph shows minimal activity at 20°C and 80°C.
[Total for Q16: 12 marks]
SUMMARY OF MARKS
| Section | Marks |
|---|---|
| Section A (MCQ) | 10 |
| Section B (Structured) | 30 |
| Q11 | 8 |
| Q12 | 9 |
| Q13 | 9 |
| Q14 | 6 |
| Section C (Data Response/Extended Writing) | 20 |
| Q15 | 8 |
| Q16 | 12 |
| TOTAL | 60 |
Note: This practice paper is AI-generated (Stage 5) using syllabus-aligned templates and inferred patterns from educational evidence. While designed to match the style and cognitive demand of Secondary 3 Biology assessments, it is not derived from official past-year examination papers. Use as supplementary practice for concept consolidation and exam technique development.
Free quiz and exam paper access
Enter your details to view this paper
Your access is remembered on this device.