AI Generated Exam Paper
Secondary 3 Biology Practice Paper 1
Free Sec 3 Biology Practice Paper 1, Kimi2.6 AI version, with questions, answers, and O Level-style practice for Singapore students.
These static practice materials are generated from the site's syllabus and paper-generation workflow, with source and model context shown so students and parents can evaluate the material before use.
Questions
TuitionGoWhere Practice Paper - Biology Secondary 3
TuitionGoWhere Practice Paper (AI)
Subject: Biology
Level: Secondary 3 (G3/Express)
Paper: Practice Paper — Cells and Biomolecules
Duration: 1 hour 30 minutes
Total Marks: 70
Version: 1 of 5
Name: _________________________________ Class: _________ Date: ___________
Instructions
- Answer ALL questions.
- Write your answers in the spaces provided.
- All necessary working and reasoning should be shown.
- The number of marks available is shown in brackets [ ] at the end of each question or part question.
- Non-programmable calculators may be used where appropriate.
Section A: Multiple Choice and Short Response [20 marks]
Answer all questions in this section.
Time estimate: 30 minutes
Question 1 [1]
Which of the following structures is found in plant cells but NOT in animal cells?
A) Nucleus
B) Mitochondrion
C) Cell wall
D) Cell membrane
Answer: _________________
Question 2 [2]
The diagram below shows a mitochondrion.
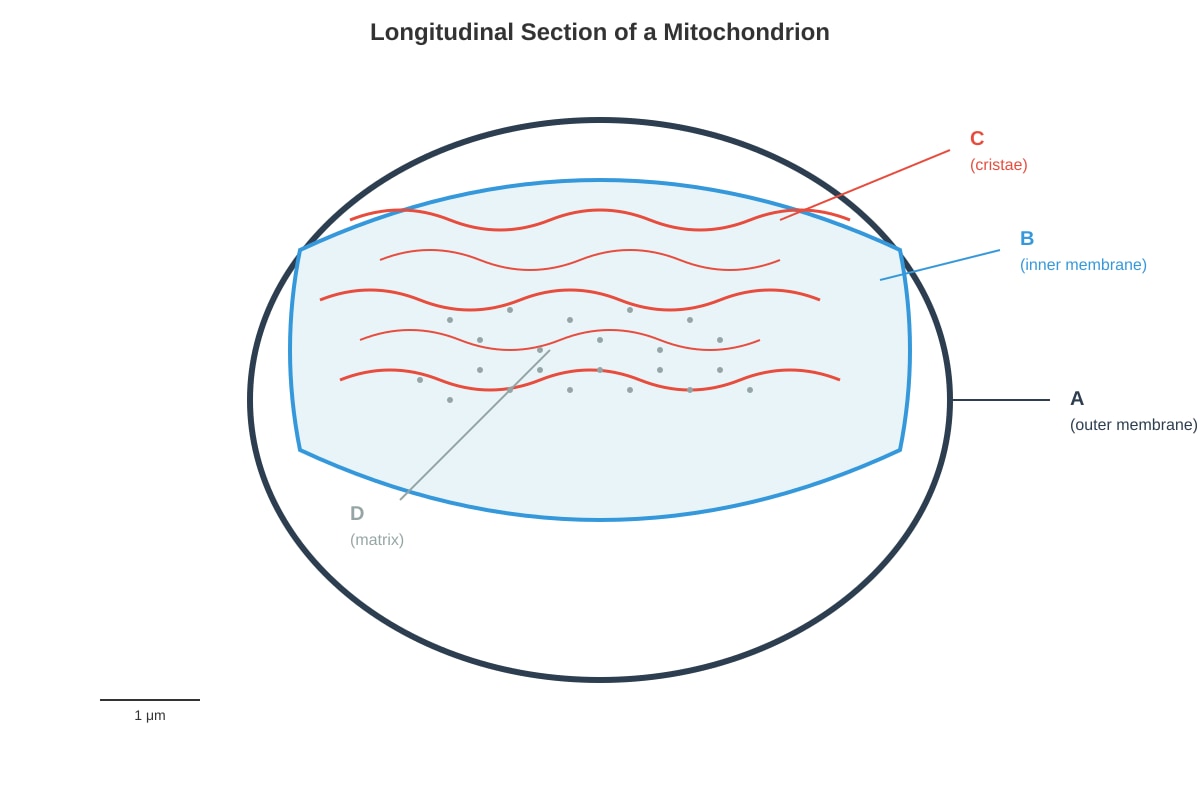
Generated diagram for Q2.
(a) State the function of structure C. _________________________________________________
(b) Explain why the structure shown in C increases the surface area available for reactions. _____________________________________________________________________
Question 3 [2]
A student observed cells under a microscope and recorded the following features:
- Cell wall present
- Large central vacuole
- No chloroplasts visible
From these observations, the student concluded the cells were from a fungus. Explain whether this conclusion is valid.
Question 4 [2]
The enzyme amylase catalyses the breakdown of starch to maltose.
(a) State the substrate in this reaction. _________________________________________________
(b) Explain why amylase cannot break down proteins. ___________________________________
Question 5 [3]
The table below shows some features of eukaryotic and prokaryotic cells.
| Feature | Eukaryotic cells | Prokaryotic cells |
|---|---|---|
| Cell size | 10–100 µm | 0.1–5.0 µm |
| DNA location | Inside nucleus | (i) _______________ |
| Ribosomes | 80S | (ii) ______________ |
| Membrane-bound organelles | Present | (iii) _____________ |
Complete the table by writing the correct features of prokaryotic cells in spaces (i), (ii), and (iii).
(i) _________________________ (ii) _________________________ (iii) _________________________
Question 6 [2]
A cell is supplied with radioactive amino acids for protein synthesis.
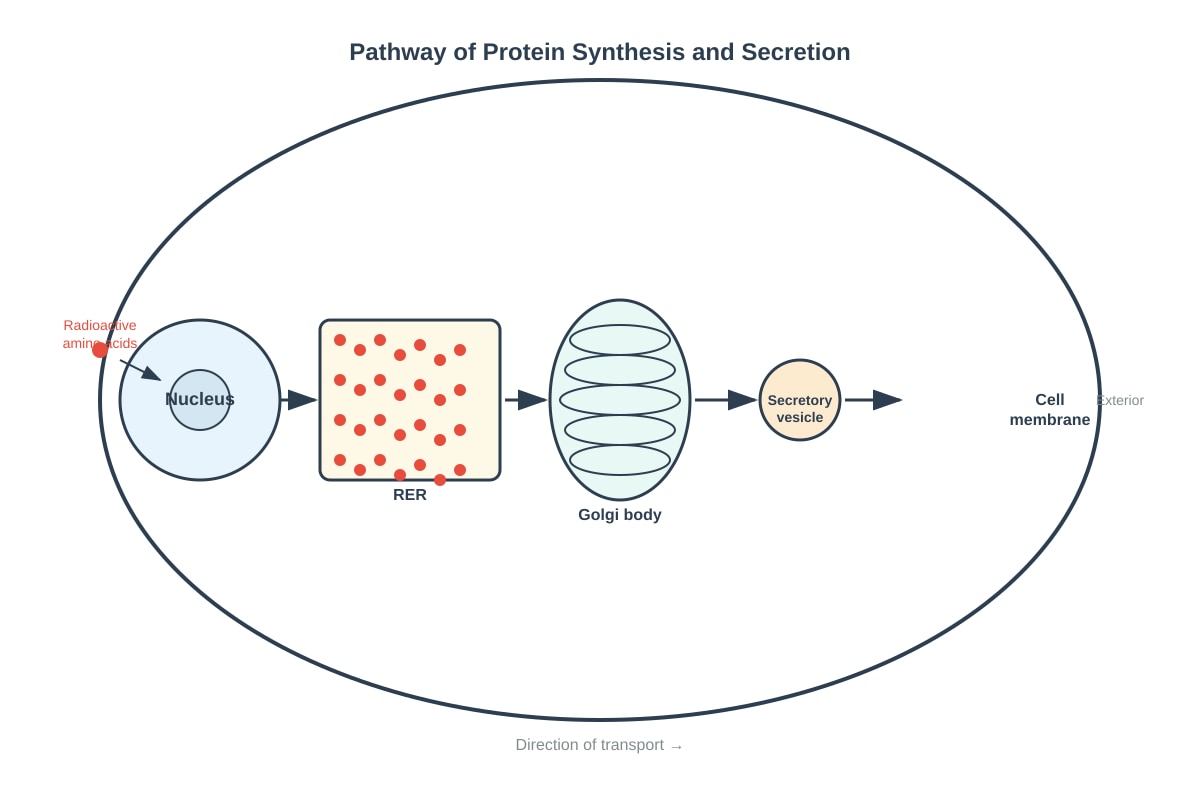
Generated diagram for Q6.
State the first organelle, after the nucleus, in which radioactivity would be detected. Explain your answer.
Question 7 [2]
(a) Define the term active transport. _______________________________________________
(b) Give one example of active transport in a plant cell. _________________________________
Question 8 [2]
Explain why phospholipids are arranged in a bilayer in the cell membrane.
Question 9 [2]
The graph below shows the effect of temperature on the rate of an enzyme-controlled reaction.
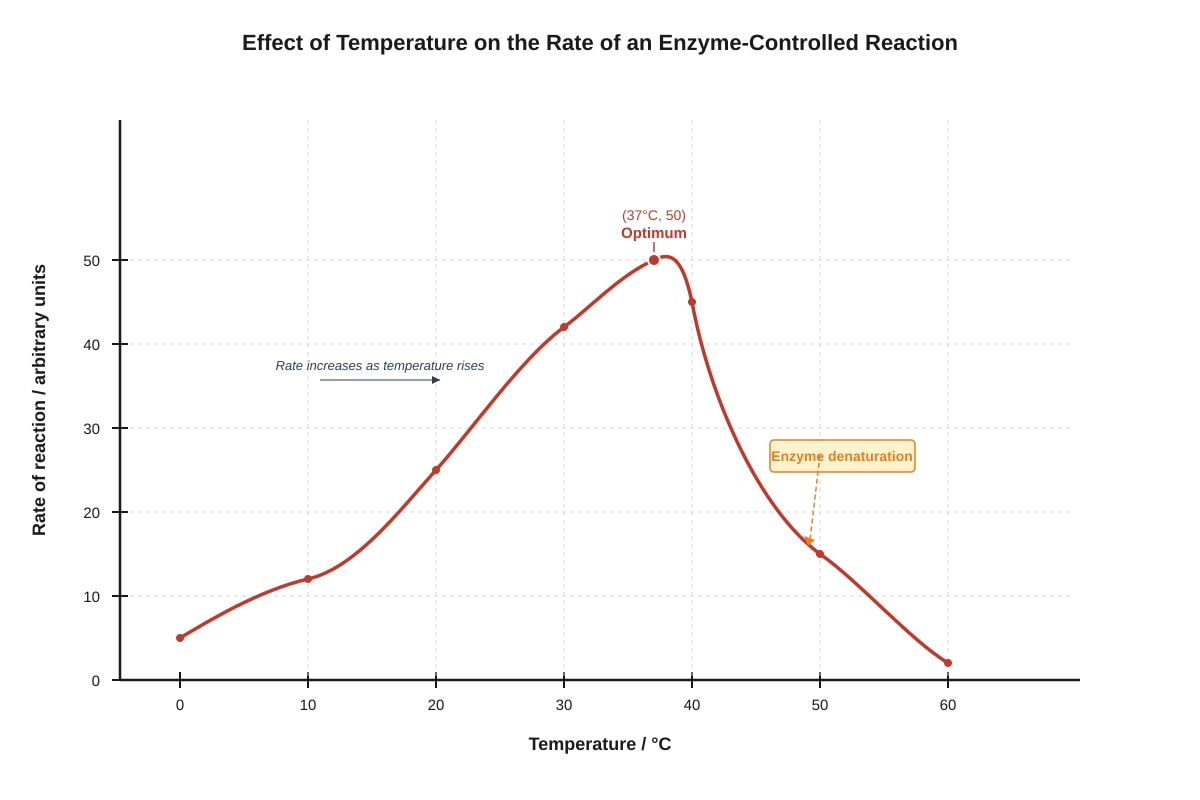
Generated graph for Q9.
Describe and explain the shape of the curve between 40°C and 60°C.
Question 10 [2]
State two ways in which the structure of a red blood cell is adapted for its function of transporting oxygen.
Section B: Structured Response [30 marks]
Answer all questions in this section.
Time estimate: 45 minutes
Question 11 [6]
The diagram below shows a plant cell as seen under an electron microscope.
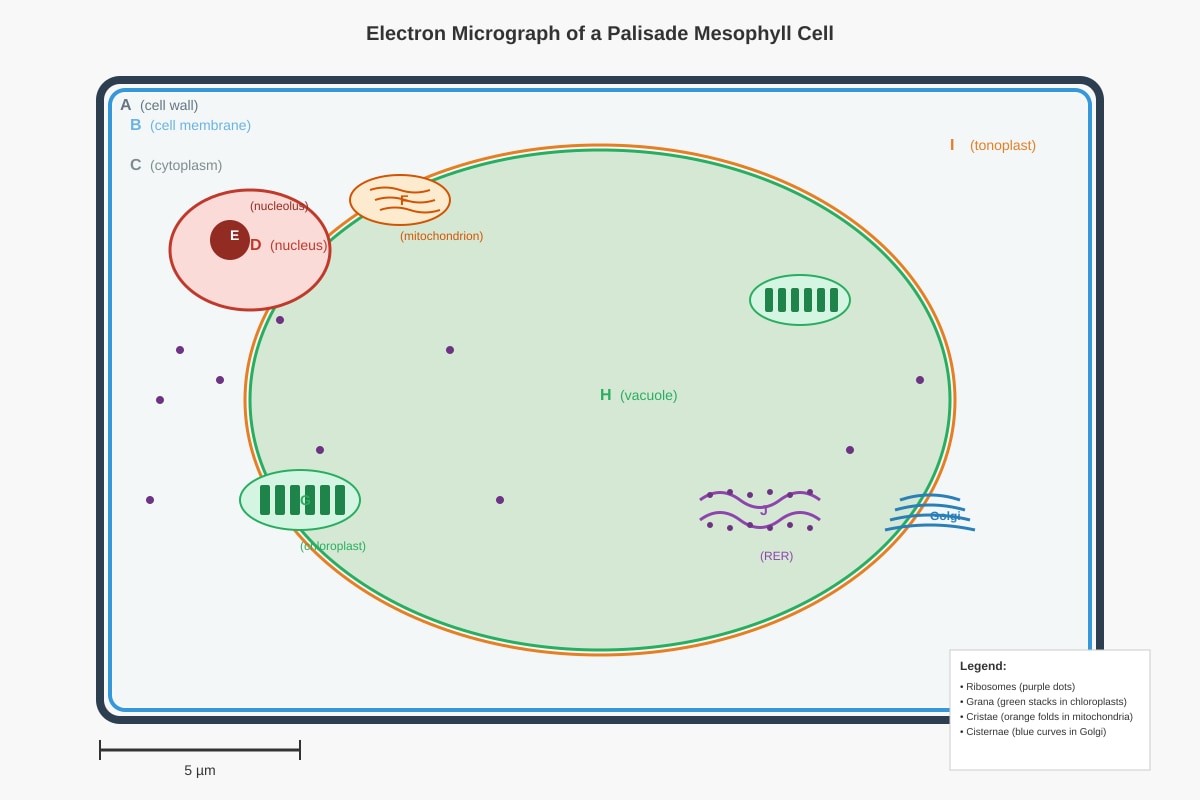
Generated diagram for Q11.
(a) State the function of: (i) Structure E; [1]
(ii) Structure F. [1]
(b) Structure G contains stacks of membrane-bound sacs. Explain how the internal structure of G is adapted for its function. [2]
(c) The cell shown is from a leaf. Explain how the large size of structure H is an adaptation for the function of this cell type. [2]
Question 12 [6]
An investigation was carried out to study the effect of substrate concentration on the rate of an enzyme-catalysed reaction. The enzyme used was catalase from potato tissue, and the substrate was hydrogen peroxide. The volume of oxygen produced was measured over time.
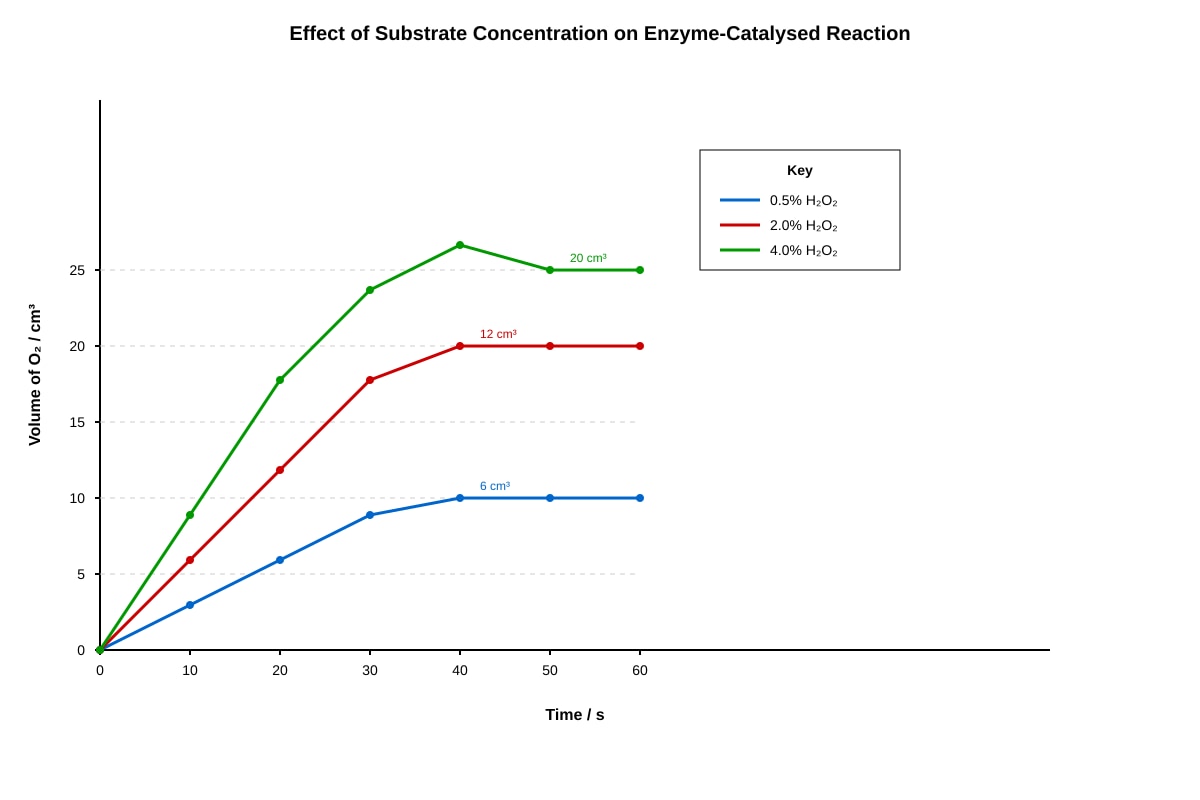
Generated graph for Q12.
(a) Define the term initial rate of reaction. [1]
(b) Using the data from the graph, calculate the initial rate of reaction for the 2.0% hydrogen peroxide concentration. Show your working. [2]
(c) Explain why all three reactions eventually stop producing oxygen. [2]
(d) Suggest why the initial rate increases with increasing substrate concentration. [1]
Question 13 [6]
The diagram below shows the fluid mosaic model of the cell membrane.
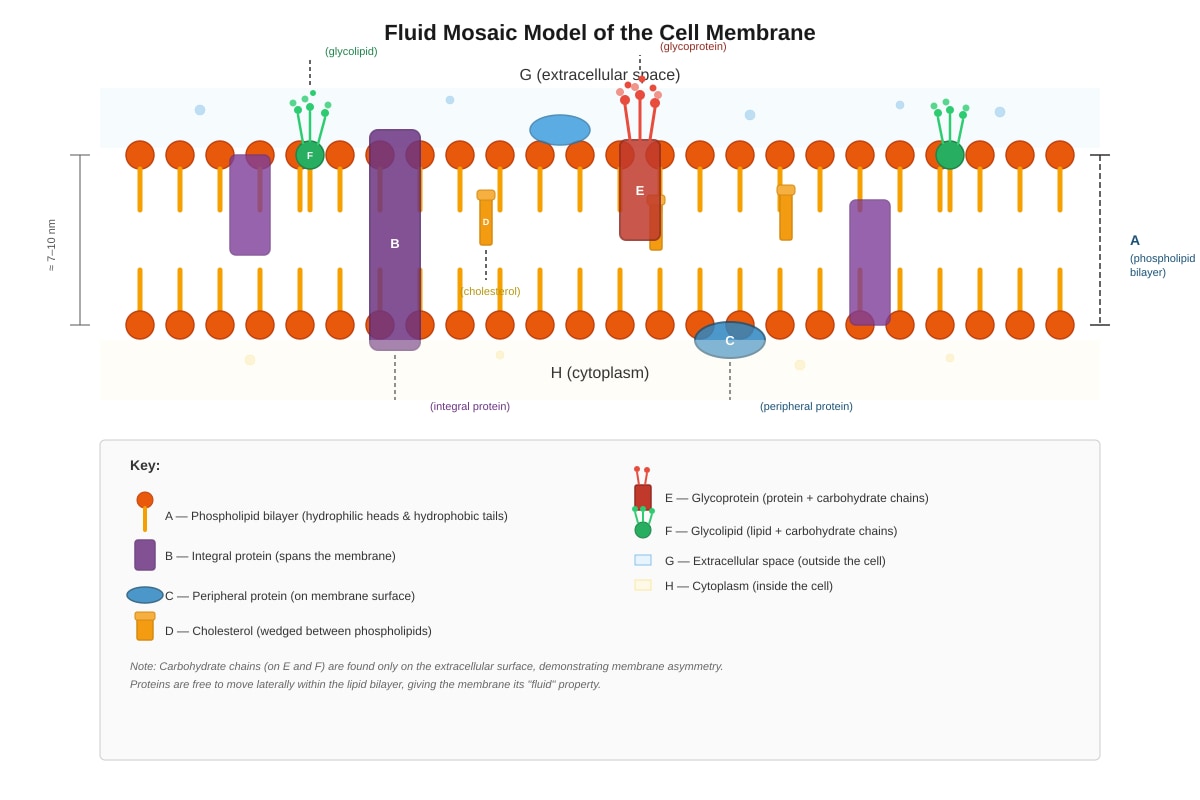
Generated diagram for Q13.
(a) Explain what is meant by the term fluid mosaic when describing the cell membrane. [2]
(b) Structure E is described as a cell surface marker. Explain the importance of cell surface markers in: (i) recognition of self and non-self cells; [2]
(ii) tissue rejection after organ transplantation. [2]
Question 14 [6]
Adipose (fat-storing) cells are highly specialised for their function. The diagram below shows a typical adipose cell.
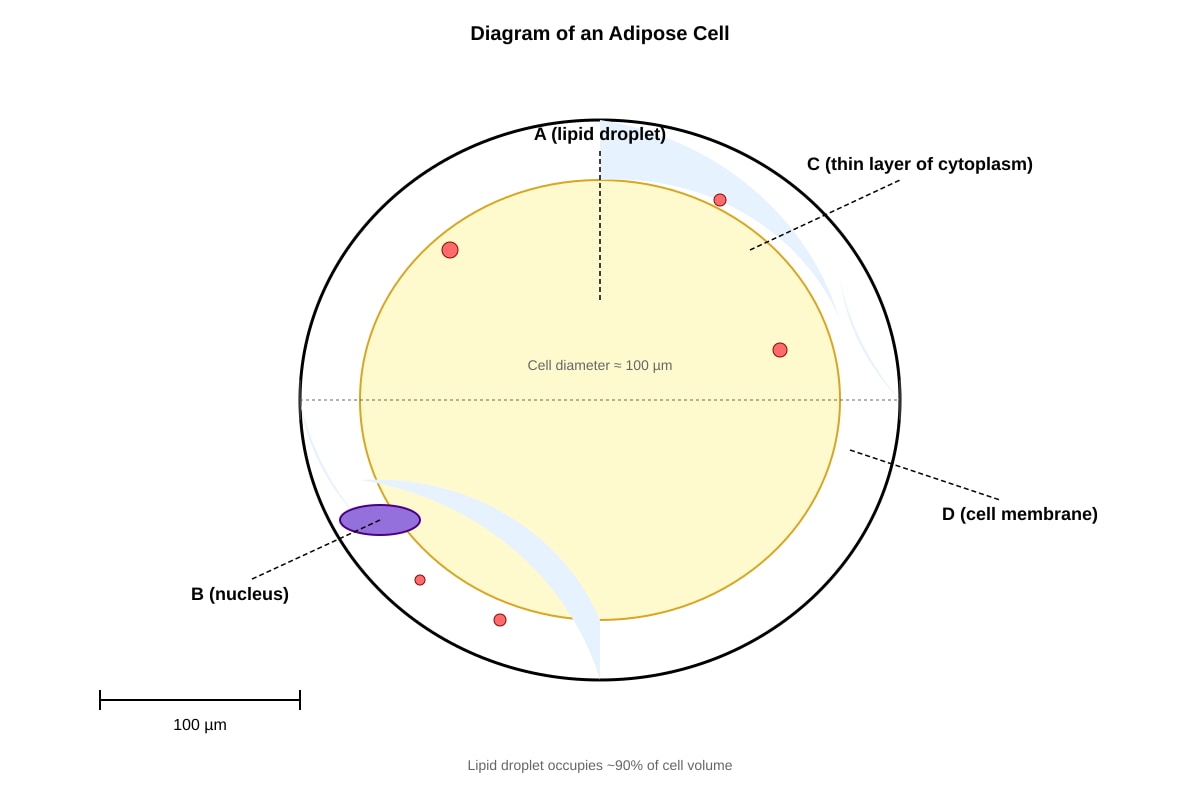
Generated diagram for Q14.
(a) Describe two structural adaptations of adipose cells that suit them for fat storage. [2]
(b) Explain why a high-fat diet leads to an increase in the size of adipose cells rather than an increase in their number. [2]
(c) During starvation, fats in adipose cells are broken down and transported to the liver. The fats are converted to a soluble form of carbohydrate. Suggest why this conversion is necessary. [2]
Question 15 [6]
The transport of substances across cell membranes is essential for cellular processes. The table below summarises three transport mechanisms.
| Feature | Diffusion | Osmosis | Active transport |
|---|---|---|---|
| Energy required | No | (a)(i) _______ | Yes |
| Movement down concentration gradient | Yes | Yes | (a)(ii) _______ |
| Requires carrier proteins | No | No | (a)(iii) _______ |
(a) Complete the table by writing Yes or No in spaces (i), (ii), and (iii). [3]
(i) ____________ (ii) ____________ (iii) ____________
(b) Explain how the structure of the cell membrane allows small, non-polar molecules to cross by diffusion while preventing the free diffusion of ions. [2]
(c) Root hair cells in plants absorb mineral ions from soil where the ion concentration is lower than inside the cell. Explain how this is achieved. [1]
Section C: Data Analysis and Extended Response [20 marks]
Answer both questions in this section.
Time estimate: 15 minutes
Question 16 [10]
An experiment was conducted to investigate the effect of pH on the activity of the enzyme pepsin. Pepsin digests protein in the stomach. Equal volumes of protein suspension were mixed with equal volumes of pepsin solution at different pH values. After 10 minutes, the remaining protein concentration was measured.
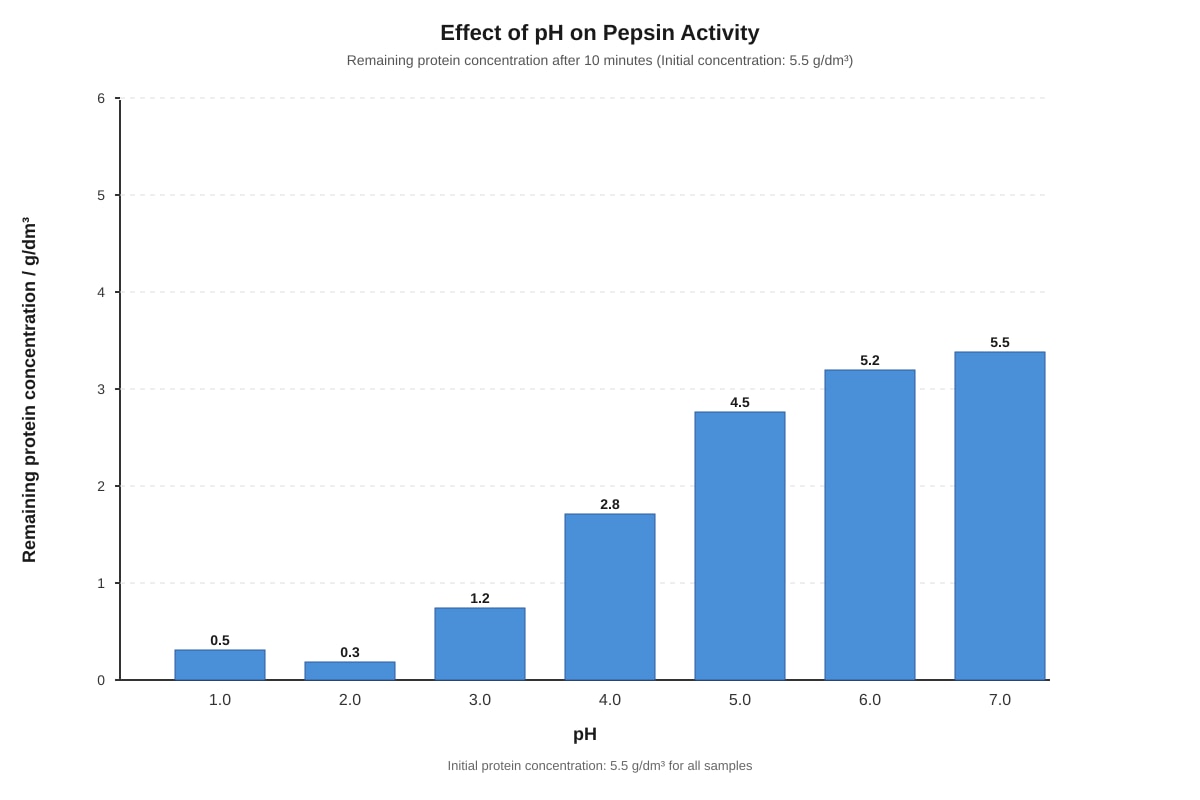
Generated graph for Q16.
(a) State the pH at which pepsin shows maximum activity. Explain how you determined this from the data. [2]
(b) Calculate the percentage of protein digested at pH 2.0. Show your working. [2]
(c) Explain why the remaining protein concentration increases as pH increases from 2.0 to 7.0. [3]
(d) Suggest two variables that should be controlled in this experiment, and explain how each would affect the results if not controlled. [3]
Question 17 [10]
The discovery of the structure of DNA was a major breakthrough in understanding how genetic information is stored and transmitted. However, before the molecular basis of inheritance was understood, scientists had already observed that chromosomes play a crucial role in cell division and inheritance.
(a) Describe the structure of chromosomes as seen during metaphase of mitosis. [3]
(b) Explain why DNA replication must occur before mitosis begins. [2]
(c) The process of mitosis produces two genetically identical daughter cells. Describe how the behaviour of chromosomes during metaphase and anaphase ensures that daughter cells receive identical genetic information. [3]
(d) Some cells in the human body, such as neurons, lose the ability to divide by mitosis after they have differentiated. Suggest one advantage and one disadvantage of this for the organism. [2]
END OF PAPER
Total marks for Section A: 20
Total marks for Section B: 30
Total marks for Section C: 20
TOTAL: 70 MARKS
Answers
TuitionGoWhere Practice Paper - Biology Secondary 3
Answer Key and Marking Scheme
Version: 1 of 5
Total Marks: 70
Section A: Multiple Choice and Short Response [20 marks]
Question 1 [1]
Answer: C) Cell wall
Explanation: The cell wall is a rigid structure made of cellulose that surrounds plant cells, providing support and protection. Animal cells lack cell walls, having only a flexible cell membrane. While both plant and animal cells contain a nucleus (A), mitochondria (B), and cell membrane (D), the cell wall is unique to plant cells (and also found in fungi and bacteria, but not animals).
Question 2 [2]
(a) Structure C (cristae) is the site of aerobic respiration / the electron transport chain / ATP production. [1]
(b) The cristae are inward folds of the inner mitochondrial membrane. [1] These folds greatly increase the surface area of the inner membrane, providing more space for the protein complexes and enzymes involved in the electron transport chain and ATP synthesis, thereby increasing the rate of ATP production. [1]
Question 3 [2]
Valid explanation: The conclusion is NOT valid. [1] While the features listed (cell wall, large vacuole, no chloroplasts) are consistent with fungal cells, they are also found in other plant cells that do not photosynthesise, such as root hair cells or cells from non-photosynthetic tissues. Fungal cell walls contain chitin, not cellulose, which would require chemical testing to confirm. [1] A proper identification would require additional evidence, such as observation of hyphal structure or biochemical testing for chitin.
Question 4 [2]
(a) Starch [1]
(b) Amylase is a specific enzyme with a particular tertiary structure forming an active site. [1] The active site has a complementary shape to starch molecules (polysaccharides with α-1,4 glycosidic bonds) but not to proteins (polypeptides with peptide bonds). The lock-and-key mechanism means only the substrate with the correct shape can fit and bind to the active site for catalysis. [1]
Question 5 [3]
(i) In cytoplasm / nucleoid region (not membrane-bound) [1]
(ii) 70S [1]
(iii) Absent / None [1]
Question 6 [2]
Answer: Rough endoplasmic reticulum (RER) [1]
Explanation: After synthesis in the nucleus, mRNA moves to ribosomes on the rough endoplasmic reticulum. Here, proteins are synthesised and enter the RER lumen for folding and modification. The radioactive amino acids would be incorporated into newly made proteins at the RER, making it the first organelle after the nucleus to show radioactivity. [1]
Question 7 [2]
(a) Active transport is the movement of molecules or ions across a cell membrane from a region of lower concentration to a region of higher concentration, using energy (ATP) and requiring carrier proteins. [1]
(b) Example: Uptake of mineral ions by root hair cells from soil; or uptake of glucose by epithelial cells of the small intestine against a concentration gradient. [1]
Question 8 [2]
Explanation: Phospholipid molecules have a hydrophilic (water-loving) phosphate head and two hydrophobic (water-repelling) fatty acid tails. [1] When placed in an aqueous environment, the phospholipids automatically arrange themselves into a bilayer with the hydrophilic heads facing outwards towards the water on both sides, and the hydrophobic tails pointing inwards, shielded from water. [1] This arrangement is thermodynamically stable and forms the basic structure of all cell membranes.
Question 9 [2]
Description: Between 40°C and 60°C, the rate of reaction decreases sharply / falls to near zero. [1]
Explanation: Above the optimum temperature (37°C), the enzyme begins to denature. The increasing thermal energy causes vibrations that break the hydrogen bonds and ionic bonds maintaining the enzyme's specific tertiary structure. [1] This alters the shape of the active site, so substrate molecules can no longer fit and bind effectively. Eventually, the enzyme is completely denatured and loses all catalytic activity.
Question 10 [2]
Any two from:
- Biconcave disc shape provides a large surface area, increasing the rate of oxygen diffusion into and out of the cell [1]
- No nucleus, allowing more space for haemoglobin (the oxygen-carrying pigment) [1]
- Thin membrane reduces diffusion distance for oxygen [1]
- Flexible shape allows passage through narrow capillaries [1]
Maximum 2 marks
Section B: Structured Response [30 marks]
Question 11 [6]
(a)(i) Structure E (nucleolus) is the site of ribosomal RNA (rRNA) synthesis / ribosome assembly. [1]
(a)(ii) Structure F (mitochondrion) is the site of aerobic respiration / ATP production / the Krebs cycle and electron transport chain. [1]
(b) Structure G is the chloroplast. The stacks of membrane-bound sacs are called thylakoids / grana. [1] The thylakoid membranes contain chlorophyll and other photosynthetic pigments arranged in photosystems. The stacked arrangement creates a large surface area for light absorption and houses the protein complexes needed for the light-dependent reactions of photosynthesis, including electron transport and ATP synthesis. [1]
(c) The cell shown is a palisade mesophyll cell, specialised for photosynthesis. The large central vacuole (H) pushes the cytoplasm and chloroplasts to the periphery of the cell, just beneath the cell wall. [1] This positioning maximises light capture by placing chloroplasts closest to the light source. The vacuole also maintains turgor pressure, keeping the cell rigid and positioning the leaf surface optimally for light absorption. [1]
Question 12 [6]
(a) The initial rate of reaction is the rate at the start of the reaction / the gradient of the curve at time zero / the maximum rate before substrate concentration or product inhibition becomes limiting. [1]
(b) From the graph, at 2.0% H₂O₂, the volume reaches approximately 12 cm³ at 40 seconds (plateau). [1]
Initial rate = 12 cm³ ÷ 40 s = 0.30 cm³/s [1]
(Accept range 0.25–0.35 cm³/s depending on reading from graph; working must be shown)
(c) All reactions stop because the substrate (hydrogen peroxide) is completely used up / depleted. [1] Enzyme-catalysed reactions continue until one reactant is exhausted. In this experiment, hydrogen peroxide is the limiting factor. [1] Once all H₂O₂ molecules have been broken down into water and oxygen, no more oxygen can be produced regardless of enzyme remaining.
(d) At higher substrate concentrations, there are more substrate molecules available to collide with enzyme active sites. [1] This increases the frequency of enzyme-substrate complex formation, leading to more reactions per unit time, hence a higher initial rate. At lower concentrations, enzyme active sites are often unoccupied.
Question 13 [6]
(a) Fluid refers to the ability of phospholipids and proteins to move laterally within the membrane — they are not fixed in position. [1] Mosaic refers to the pattern of protein molecules embedded within the phospholipid bilayer, like tiles in a mosaic, with different proteins scattered throughout rather than forming a continuous layer. [1]
(b)(i) Cell surface markers (glycoproteins / glycolipids) have carbohydrate chains with specific sequences that act as identification tags. [1] The immune system recognises "self" cells by their specific surface markers and attacks cells with foreign markers (non-self), enabling defence against pathogens without attacking the body's own cells. [1]
(b)(ii) In organ transplantation, the donor organ has different cell surface markers (different glycoprotein patterns) from the recipient. [1] The recipient's immune system recognises these as foreign and mounts an immune response, producing antibodies and activating T-cells to attack the transplanted tissue, leading to tissue rejection. [1] Immunosuppressant drugs are needed to prevent this response.
Question 14 [6]
(a) Any two from:
- Large central lipid droplet stores fat in a compact form / occupies most of cell volume [1]
- Thin rim of cytoplasm and peripherally flattened nucleus maximise space for lipid storage [1]
- Sparse organelles reduce metabolic activity, allowing the cell to focus on storage [1]
(b) Adipose cells have differentiated to their maximum size for fat storage. Once specialised, most animal cells lose the ability to divide (exit the cell cycle). [1] Therefore, excess fat cannot be stored by producing new adipose cells; instead, existing cells must expand by accumulating more lipid in their central droplet. In extreme obesity, new adipocytes may form from pre-adipocyte precursors, but primarily cells enlarge first. [1]
(c) Fats (triglycerides) are insoluble in water / hydrophobic. [1] The blood plasma is an aqueous medium, so fats cannot be transported directly in the bloodstream. They are converted to soluble carbohydrates (such as glucose via gluconeogenesis) or transported as smaller soluble molecules (fatty acids bound to albumin, or as ketone bodies) that can dissolve in blood and be carried to cells for respiration. [1]
Question 15 [6]
(a)
| Feature | Diffusion | Osmosis | Active transport |
|---|---|---|---|
| (i) Energy required | No | No | Yes |
| (ii) Movement down concentration gradient | Yes | Yes | No |
| (iii) Requires carrier proteins | No | No | Yes |
[1 mark per correct answer; 3 marks total]
(b) The phospholipid bilayer has a hydrophobic interior (fatty acid tails). [1] Small, non-polar molecules (like oxygen, carbon dioxide, lipids) can dissolve in and pass through this hydrophobic core. Ions are charged and hydrophilic, so they cannot pass through the hydrophobic interior without assistance from channel proteins or carrier proteins. [1]
(c) Root hair cells use active transport. [1] Energy from respiration (ATP) is used to pump mineral ions into the cell against their concentration gradient, via protein pumps in the cell membrane.
Section C: Data Analysis and Extended Response [20 marks]
Question 16 [10]
(a) pH 2.0 [1]
Explanation: At this pH, the remaining protein concentration is lowest (0.3 g/dm³), meaning most protein has been digested. [1] Since the initial protein concentration was 5.5 g/dm³, the amount digested = 5.5 − 0.3 = 5.2 g/dm³, which is the maximum digestion achieved in this experiment.
(b) Protein digested at pH 2.0 = 5.5 − 0.3 = 5.2 g/dm³ [1]
Percentage digested = (5.2 ÷ 5.5) × 100 = 94.5% (accept 94–95%) [1]
(c) As pH increases from 2.0, the H⁺ concentration decreases, moving away from pepsin's optimum pH. [1] Pepsin functions optimally in the strongly acidic conditions of the stomach (pH 1.5–2.5). At higher pH values, the enzyme's tertiary structure is altered as ionic bonds and hydrogen bonds involving acidic and basic amino acid side chains are disrupted. [1] The active site changes shape, reducing its ability to bind to the protein substrate (reduced enzyme-substrate complex formation). [1] By pH 7.0, the enzyme is completely denatured and inactive, so no protein is digested.
(d) Any two valid controlled variables with explanations:
| Variable | Why it must be controlled | Effect if not controlled |
|---|---|---|
| Temperature | Affects enzyme activity and rate independently of pH | Higher temperature would increase rate, making results incompatible; could cause denaturation |
| Enzyme concentration | Determines maximum possible rate available | Different enzyme concentration would change Vmax and make comparisons invalid |
| Volume/substrate concentration | Must be same at all pH values tested | Different substrate amounts would mean different total product possible, confounding results |
| Time of reaction | Must be constant for fair comparison | Longer time would allow more digestion, not due to pH effect |
[1 mark for each variable, 1 mark for each explanation; maximum 3 marks]
Question 17 [10]
(a) During metaphase, chromosomes consist of two identical sister chromatids joined at the centromere. [1] Each chromosome is highly condensed / coiled, making them visible under a light microscope. [1] They are arranged at the cell equator (metaphase plate), attached to spindle fibres from opposite poles by their centromeres. [1]
(b) DNA replication ensures that each chromosome contains two identical copies (sister chromatids). [1] During mitosis, these separate so that each daughter cell receives a complete, identical set of genetic information. Without replication, chromosome number would halve with each division.
(c) During metaphase, chromosomes line up at the equator with sister chromatids facing opposite poles. Spindle fibres from opposite poles attach to each chromatid at the centromere. [1] During anaphase, the centromeres divide and sister chromatids separate. [1] The spindle fibres contract, pulling sister chromatids to opposite poles. This ensures each daughter cell receives one copy of each chromosome, maintaining genetic identity. [1]
(d)
- Advantage: Neurons can develop complex, specialised structures (dendrites, axons) for signal transmission without the disruption of cell division / permanent structural investment is preserved. [1]
- Disadvantage: Damaged neurons cannot be replaced by mitosis, leading to permanent loss of function / brain injuries or neurodegenerative diseases cause irreversible damage. [1]
END OF ANSWER KEY
Free quiz and exam paper access
Enter your details to view this paper
Your access is remembered on this device.