From Real Exams Exam Paper
Secondary 3 Biology Semestral Assessment 2 (End of Year) Paper 5
Free Sec 3 Biology SA2 Paper 5, Kimi2.6 Exam version, with questions, answers, and O Level-style practice for Singapore students.
These static practice materials are generated from the site's syllabus and paper-generation workflow, with source and model context shown so students and parents can evaluate the material before use.
Questions
TuitionGoWhere Exam Practice (AI) – Biology Secondary 3
Subject: Biology
Level: Secondary 3 (G3/Express)
Paper: SA2 Practice Paper
Duration: 1 hour 15 minutes
Total Marks: 60
Version: 5 of 5
Name: _________________________
Class: __________ Date: __________
Instructions to Candidates
- Write your name, class, and date in the spaces provided above.
- This paper consists of THREE sections: A, B, and C.
- Answer ALL questions.
- Write your answers in the spaces provided. Additional paper is available if required.
- For questions requiring calculations, show all working clearly.
- The use of an approved calculator is allowed where appropriate.
- The intended marks for each question or part question are given in brackets [ ].
- The total number of marks for this paper is 60.
SECTION A: Multiple Choice [10 marks]
Answer ALL questions. Each question carries 1 mark.
For each question, choose the best answer and write the letter (A, B, C, or D) in the box provided.
| 1 | 2 | 3 | 4 | 5 | 6 | 7 | 8 | 9 | 10 |
|---|---|---|---|---|---|---|---|---|---|
1. The diagram below shows a plant cell as seen under an electron microscope.
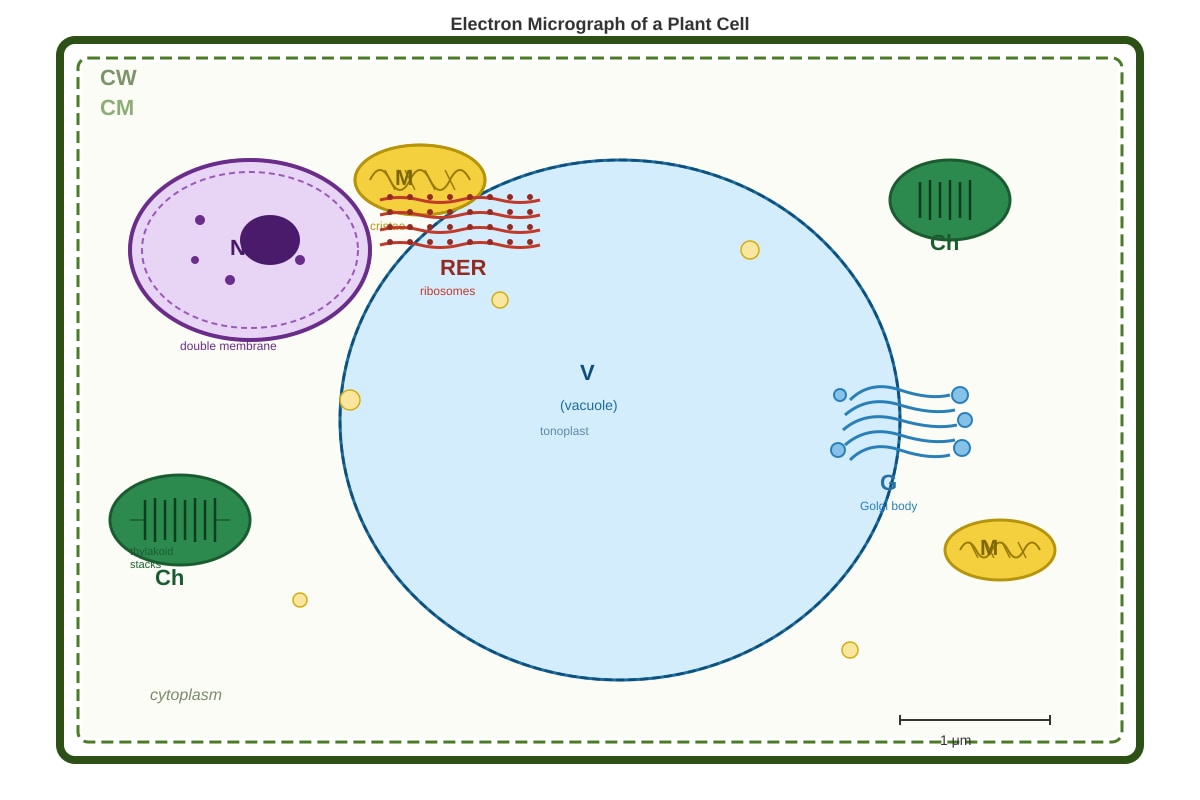
Generated diagram for Q1.
Which structure is responsible for synthesising proteins that will be secreted from the cell?
A. Chloroplast
B. Golgi body
C. Rough endoplasmic reticulum
D. Mitochondrion
Answer: [1]
2. Which of the following correctly matches a biomolecule with its monomer and a major function in cells?
| Biomolecule | Monomer | Major Function | |
|---|---|---|---|
| A | Glycogen | Glucose | Energy storage in plants |
| B | Protein | Amino acid | Catalysis |
| C | Starch | Fructose | Energy storage in animals |
| D | DNA | Ribose nucleotide | Protein synthesis |
Answer: [1]
3. A scientist supplies radioactive amino acids to actively growing pancreatic cells that secrete digestive enzymes. Which sequence correctly shows the pathway of radioactivity through organelles?
A. Ribosomes → Golgi body → rough ER → secretory vesicles
B. Rough ER → Golgi body → secretory vesicles → cell membrane
C. Nucleus → rough ER → Golgi body → mitochondria
D. Cytoplasm → smooth ER → Golgi body → lysosomes
Answer: [1]
4. The enzyme amylase catalyses the hydrolysis of starch. Which statement about this reaction is correct?
A. Amylase is completely used up during the reaction
B. The enzyme raises the activation energy of the reaction
C. The products maltose and glucose have the same molecular formula as starch
D. The enzyme-substrate complex forms at the active site of amylase
Answer: [1]
5. The graph below shows the effect of temperature on the rate of an enzyme-catalysed reaction.
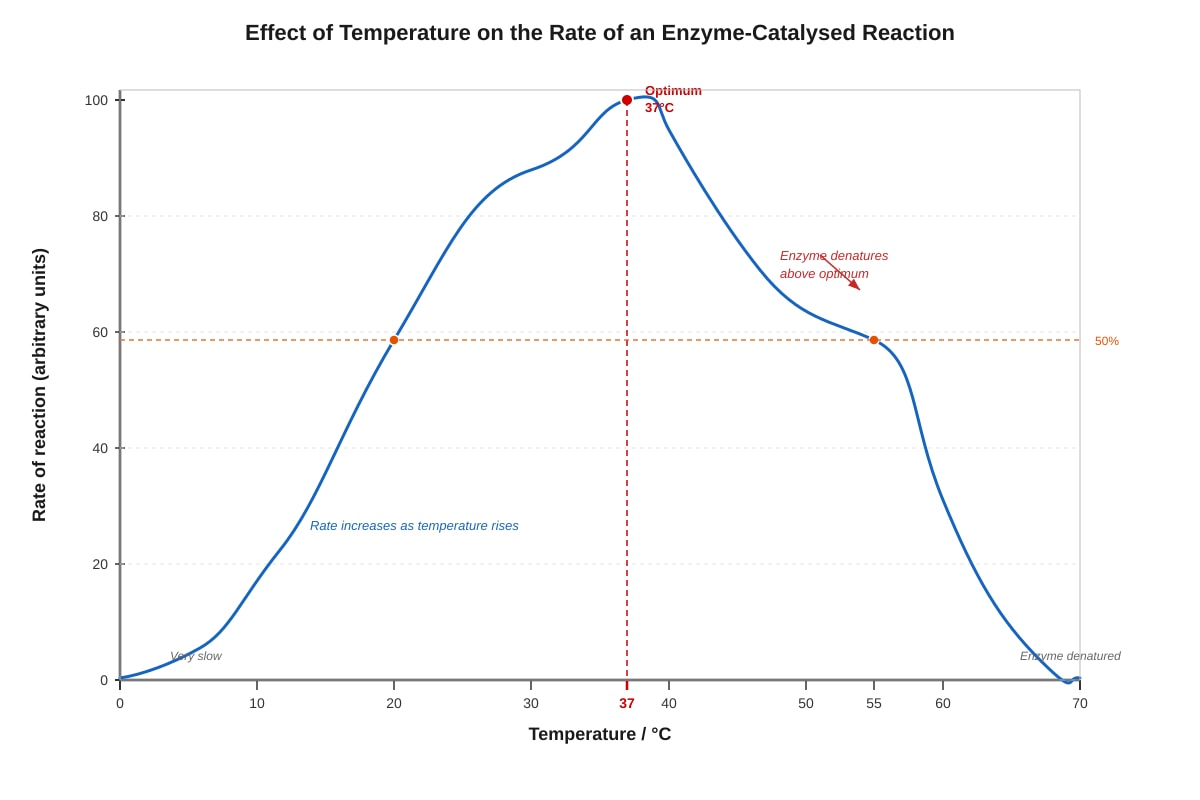
Generated graph for Q5.
At 50°C, the rate of reaction is lower than at 37°C. Which explanation is correct?
A. The substrate molecules have less kinetic energy at 50°C
B. The enzyme has been denatured and its active site has changed shape
C. There are fewer collisions between enzyme and substrate at 50°C
D. The concentration of substrate has decreased at 50°C
Answer: [1]
6. Which observation from Benedict's test would indicate the presence of a reducing sugar in a solution?
A. Solution remains blue
B. Solution turns from blue to brick red precipitate when heated
C. Solution turns purple
D. A white precipitate forms
Answer: [1]
7. The diagram shows part of a cell membrane.
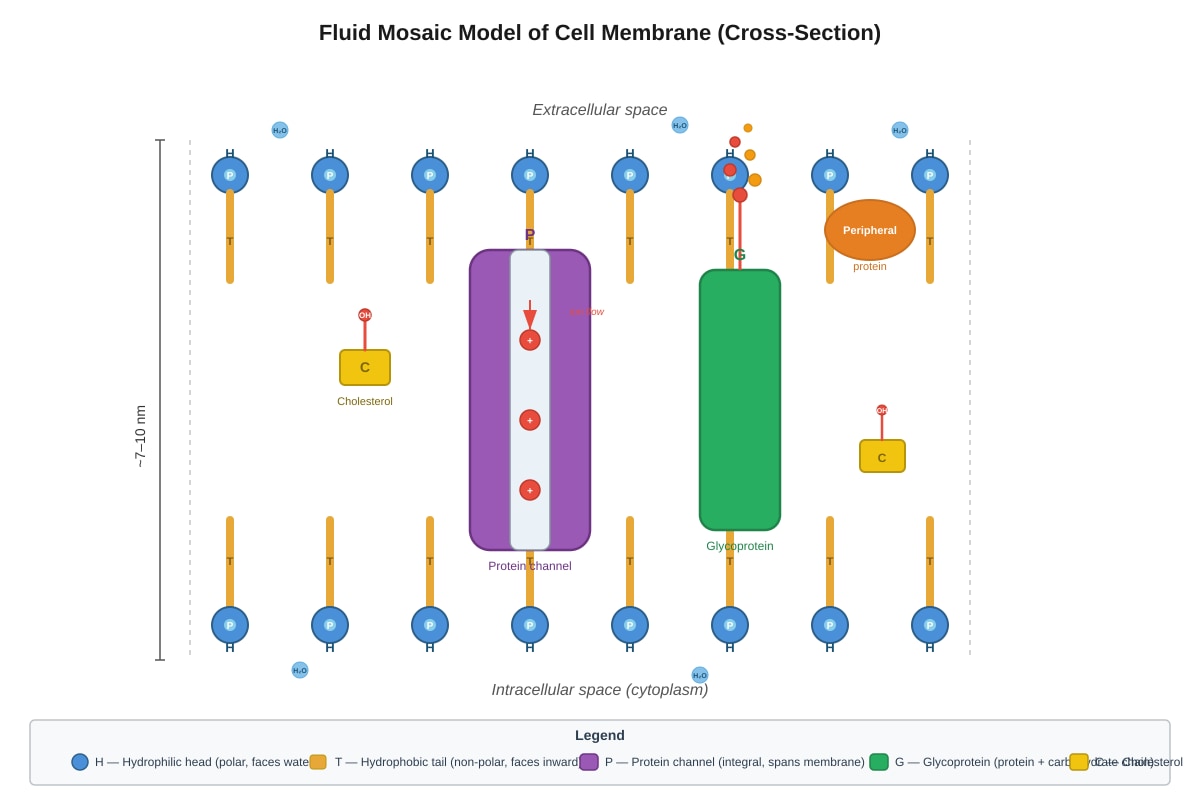
Generated diagram for Q7.
Which structure allows the passage of specific ions across the membrane?
A. Glycoprotein
B. Protein channel
C. Cholesterol
D. Phospholipid tail
Answer: [1]
8. A student measures the activity of catalase in potato tissue at different pH values. The results are shown below.
| pH | Relative rate of oxygen production |
|---|---|
| 4 | 12 |
| 6 | 45 |
| 7 | 62 |
| 8 | 58 |
| 10 | 8 |
What is the optimum pH range for potato catalase?
A. pH 4–6
B. pH 6–7
C. pH 7–8
D. pH 8–10
Answer: [1]
9. Which organelle contains DNA and ribosomes, enabling it to synthesise some of its own proteins?
A. Golgi body
B. Lysosome
C. Mitochondrion
D. Peroxisome
Answer: [1]
10. A molecule of glucose has the formula C₆H₁₂O₆. During aerobic respiration, one glucose molecule is completely oxidised. How many carbon dioxide molecules are produced per glucose molecule?
A. 2
B. 3
C. 6
D. 12
Answer: [1]
Section A Total: ______ / 10
SECTION B: Structured Response [30 marks]
Answer ALL questions.
11. The diagram below shows an animal cell and a bacterial cell drawn to the same magnification.
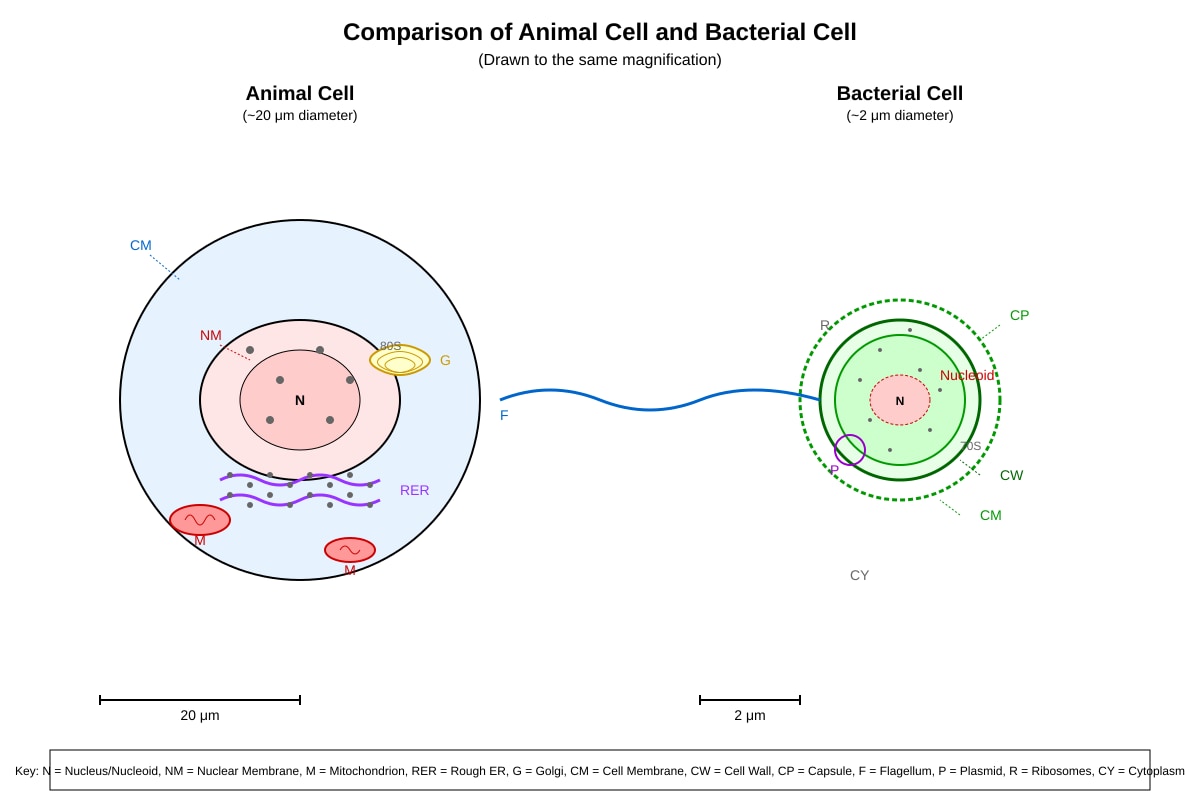
Generated diagram for Q11.
(a) State two structural features present in the bacterial cell but absent from the animal cell. [2]
(b) The bacterial cell is much smaller than the animal cell. Explain one advantage of the small size of bacterial cells for obtaining nutrients. [2]
(c) Name the type of ribosomes found in the bacterial cell and explain why these ribosomes are a target for certain antibiotics. [2]
12. The table below shows the results of tests carried out on three unknown food samples: X, Y, and Z.
| Test | Sample X | Sample Y | Sample Z |
|---|---|---|---|
| Benedict's test (heated) | Brick red precipitate | Remains blue | Brick red precipitate |
| Biuret test | Purple | Blue | Purple |
| Iodine test | Brown-yellow | Blue-black | Blue-black |
| Emulsion test (ethanol + water) | Clear, no emulsion | Clear, no emulsion | White emulsion layer |
(a) Based on the results, identify which sample(s) contain reducing sugar(s). Explain your reasoning. [2]
(b) Which sample contains starch? Explain how the iodine test result indicates this. [2]
(c) Complete the table below to show the nutrient composition of each sample. Use ✓ to indicate presence and ✗ to indicate absence. [3]
| Sample | Reducing Sugar | Starch | Protein | Lipid |
|---|---|---|---|---|
| X | ||||
| Y | ||||
| Z |
(d) Sample Z was tested with acid and boiled before performing Benedict's test. The result was a brick red precipitate. Explain why this result differs from the original Benedict's test for Sample Z. [2]
13. An investigation was carried out to study the effect of substrate concentration on the rate of an enzyme-catalysed reaction. The enzyme used was sucrase, which catalyses the hydrolysis of sucrose into glucose and fructose. The results are shown in the graph below.
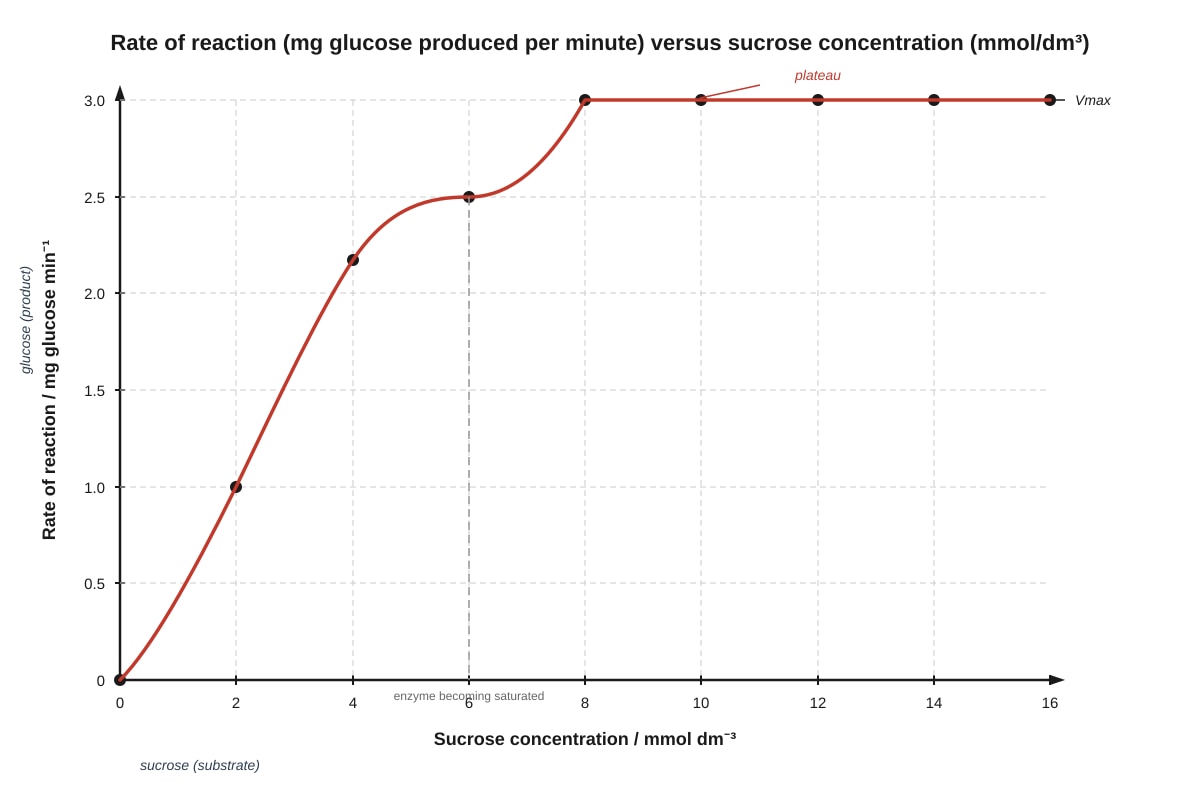
Generated graph for Q13.
(a) Describe the relationship between sucrose concentration and the rate of reaction when the sucrose concentration is between 0 and 6 mmol dm⁻³. [2]
(b) Explain why the rate of reaction plateaus at sucrose concentrations above 8 mmol dm⁻³. [3]
(c) Suggest two ways the investigator could increase the maximum rate of reaction (the rate at the plateau). [2]
14. The diagram shows the stages of protein synthesis and secretion in a eukaryotic cell.
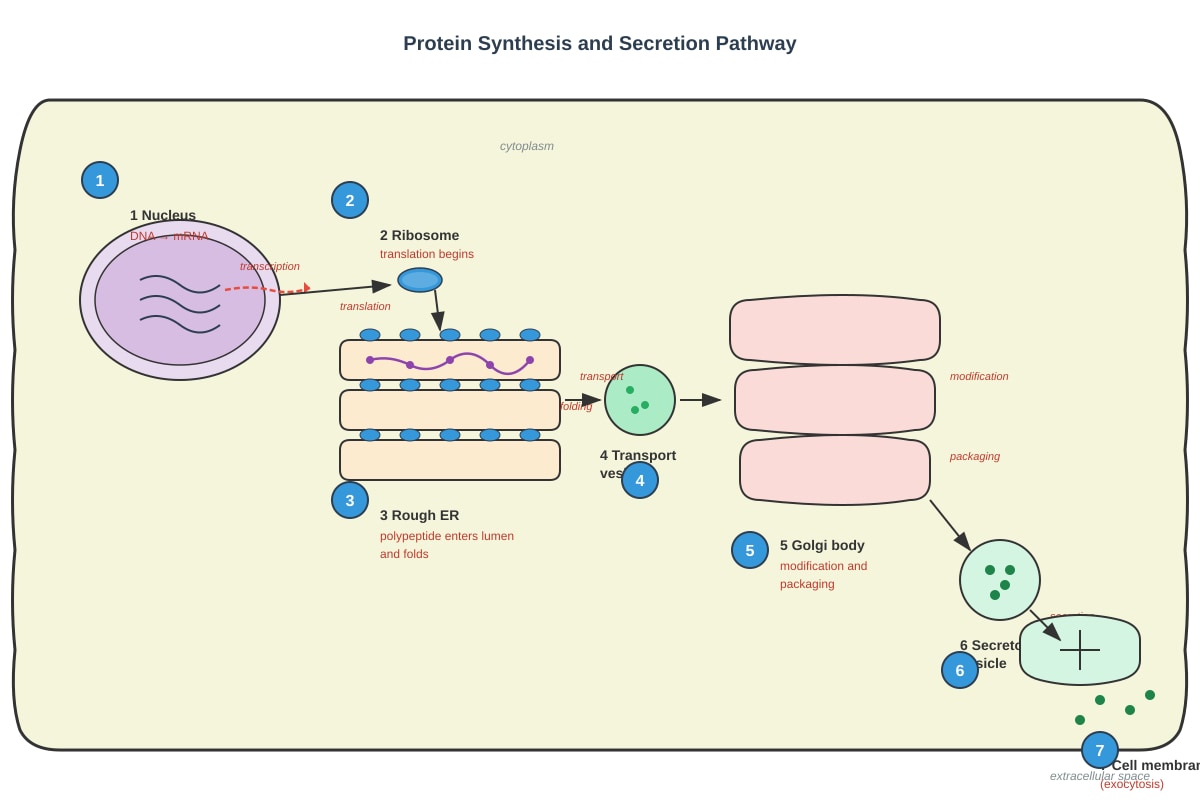
Generated diagram for Q14.
(a) State the process occurring at Stage 1 and name the enzyme involved. [2]
(b) Explain why the polypeptide must enter the rough ER lumen at Stage 3 rather than remaining in the cytoplasm to fold completely. [3]
(c) Describe what happens to the protein at Stage 5 that ensures it is sent to the correct destination in or outside the cell. [2]
15. Mitochondria are often described as the "powerhouses" of the cell.
(a) Explain why mitochondria contain both an outer membrane and a highly folded inner membrane. [3]
(b) Muscle cells contain many mitochondria. Explain how this adaptation relates to the function of muscle cells. [2]
(c) Some antibiotics target bacterial 70S ribosomes but do not affect eukaryotic 80S ribosomes. However, certain antibiotics can also damage human mitochondria. Suggest an explanation for this observation. [2]
Section B Total: ______ / 30
SECTION C: Data Analysis and Extended Response [20 marks]
Answer ALL questions.
16. The electron micrograph below shows a mitochondrion in longitudinal section.
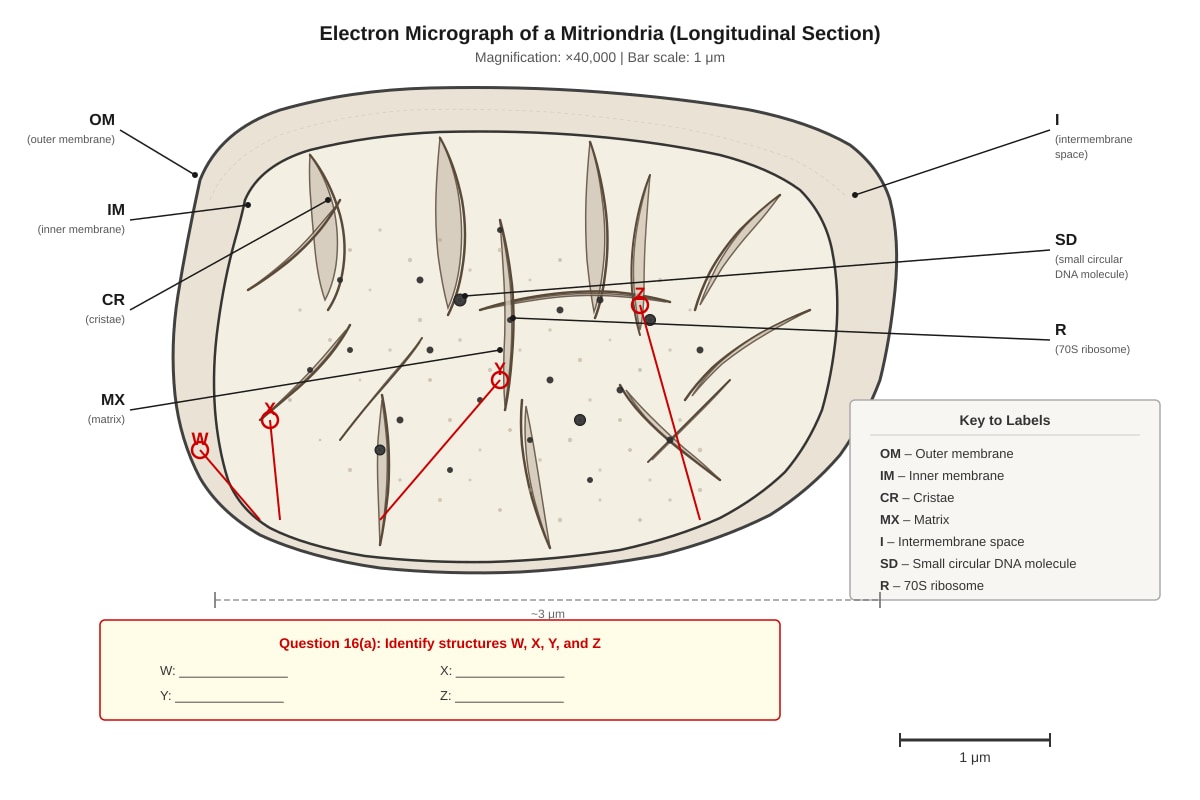
Generated diagram for Q16.
(a) Identify structures W, X, Y, and Z using the labels provided:
W: _______________
X: _______________
Y: _______________
Z: _______________ [4]
(b) The inner membrane contains many protein complexes involved in oxidative phosphorylation. Calculate the surface area advantage gained by having cristae. A mitochondrion with a smooth inner membrane would have an inner surface area of approximately 2 μm². With cristae, the inner surface area increases to approximately 30 μm². Show your working. [2]
(c) Explain how the structure of the cristae relates to the function of the mitochondrion in producing ATP. [3]
17. An experiment was conducted to investigate the effect of pH on the activity of the enzyme pepsin, which digests proteins in the stomach. The results are shown below.
| pH | Initial rate of protein digestion / mg protein hydrolysed min⁻¹ |
|---|---|
| 1.0 | 18 |
| 1.5 | 28 |
| 2.0 | 35 |
| 2.5 | 30 |
| 3.0 | 15 |
| 4.0 | 3 |
| 5.0 | 0 |
| 6.0 | 0 |
(a) Plot a graph of these data on the grid provided. [3]
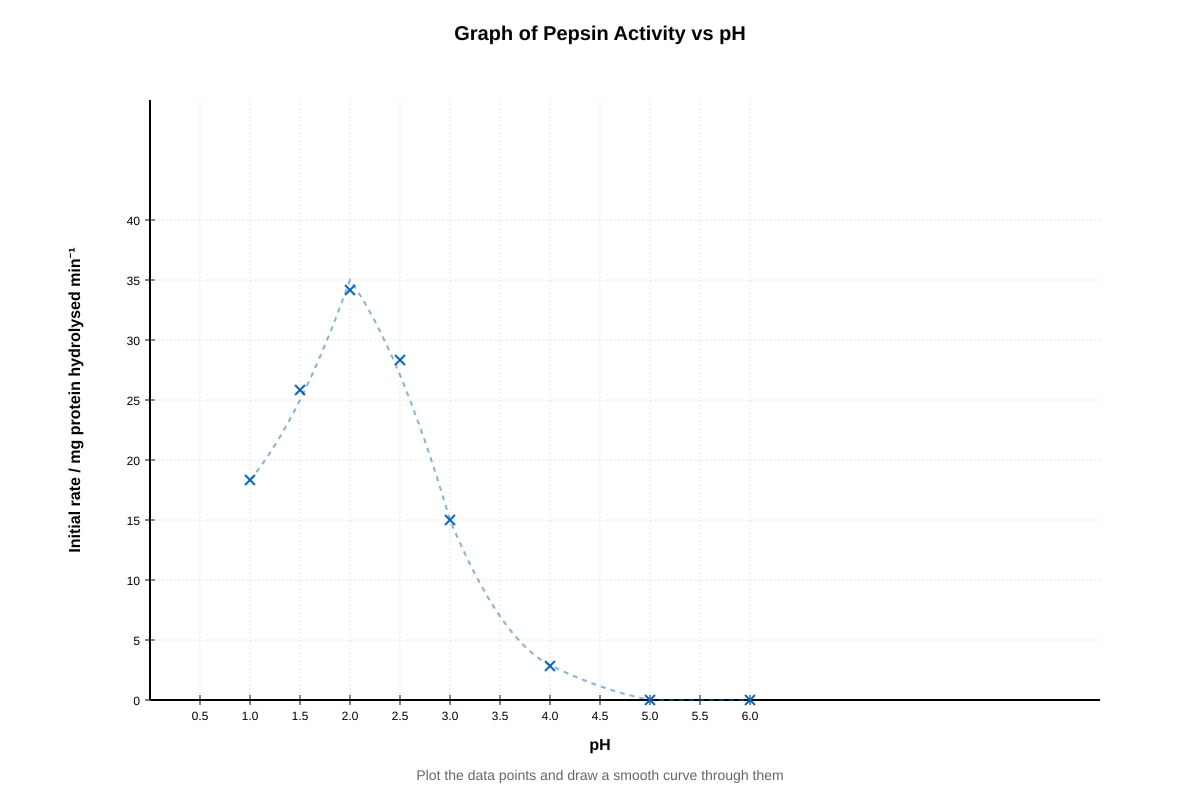
Generated graph for Q17.
(b) Using your graph, estimate the optimum pH for pepsin activity. [1]
(c) Explain why the rate of reaction is zero at pH 6.0. Refer to the structure of the enzyme in your answer. [3]
(d) The enzyme trypsin, found in the small intestine, has an optimum pH of approximately 8.0. Explain why the human digestive system uses enzymes with very different optimum pH values in different regions. [3]
18. Cyanide is a poison that binds to cytochrome c oxidase, a protein complex in the inner mitochondrial membrane. This prevents the transfer of electrons to oxygen, the final electron acceptor in the electron transport chain.
(a) Explain why blocking the electron transport chain causes ATP production to cease. [3]
(b) Predict the effect of cyanide poisoning on the concentration of NAD⁺ in the mitochondrial matrix. Explain your reasoning. [3]
(c) A patient with cyanide poisoning is given oxygen therapy. Explain why this treatment alone may not restore ATP production unless the cyanide is also removed. [2]
Section C Total: ______ / 20
END OF PAPER
GRAND TOTAL: ______ / 60
Answers
TuitionGoWhere Exam Practice (AI) – Biology Secondary 3 (SA2 Version 5) – ANSWER KEY
Subject: Biology
Level: Secondary 3 (G3/Express)
Paper: SA2 Practice Paper
Total Marks: 60
Version: 5 of 5
SECTION A: Multiple Choice – Answers and Explanations [10 marks]
| Question | Answer | Explanation |
|---|---|---|
| 1 | C | The rough endoplasmic reticulum (RER) has ribosomes attached to its surface and is the site of synthesis of proteins destined for secretion. These proteins enter the RER lumen for folding and modification before transport to the Golgi. The Golgi body (B) modifies and packages proteins but does not synthesise them. Chloroplasts (A) carry out photosynthesis. Mitochondria (D) produce ATP. |
| 2 | B | Proteins are polymers of amino acids. Many proteins function as enzymes that catalyse reactions. Common mistake: Glycogen (A) is animal energy storage, not plant. Starch (C) uses glucose, not fructose, as its monomer. DNA (D) uses deoxyribose nucleotides, not ribose nucleotides. |
| 3 | B | Secretory proteins follow the pathway: ribosomes on rough ER → ER lumen → transport vesicles → Golgi body → secretory vesicles → cell membrane (exocytosis). This is the correct sequence for proteins like digestive enzymes. |
| 4 | D | Enzymes are biological catalysts that work at active sites. They are not used up (A is wrong), they lower activation energy (B is wrong), and products have different molecular formulas than substrates (C is wrong—starch is (C₆H₁₀O₅)ₙ, while maltose is C₁₂H₂₂O₁₁). |
| 5 | B | At temperatures above the optimum (37°C for many human enzymes), enzymes denature. The active site changes shape, so substrates no longer fit. Common mistake: At 50°C, kinetic energy is actually higher than at 37°C, so A and C are incorrect explanations. |
| 6 | B | Benedict's test detects reducing sugars. When heated, the blue copper(II) sulfate solution is reduced to copper(I) oxide, forming a brick red precipitate. No colour change (A) means no reducing sugar. Purple (C) is the Biuret test for protein. |
| 7 | B | Protein channels (and carriers) are specific for particular ions or molecules. Glycoproteins (A) function in cell recognition. Cholesterol (C) maintains membrane fluidity. Phospholipid tails (D) form the hydrophobic barrier. |
| 8 | C | The highest rates are at pH 7 (62) and pH 8 (58), with the peak between them. The optimum pH range is therefore pH 7–8. |
| 9 | C | Mitochondria contain their own circular DNA and 70S ribosomes, relics of their endosymbiotic origin. This allows them to synthesise some of their own proteins. Golgi bodies (A), lysosomes (B), and peroxisomes (D) lack DNA. |
| 10 | C | Aerobic respiration: C₆H₁₂O₆ + 6O₂ → 6CO₂ + 6H₂O. Six CO₂ molecules are produced per glucose molecule. Working: Balance the equation: 6 carbons in glucose → 6 carbons in CO₂. |
Section A Total: 10 marks
SECTION B: Structured Response – Answers and Marking Scheme [30 marks]
Question 11 [6 marks]
(a) Two structural features in bacterial cell but absent from animal cell [2 marks]
| Feature | Explanation |
|---|---|
| Cell wall (peptidoglycan) | Provides structural support and protection; animal cells lack this |
| Capsule | Protective layer outside cell wall; not present in animal cells |
| Flagellum | For locomotion; animal cells may have cilia/flagella but structure differs |
| Plasmid | Small circular DNA; animal cell DNA is chromosomal in nucleus |
| Nucleoid region (no membrane-bound nucleus) | DNA not enclosed by nuclear membrane |
Any two features with brief identification: 1 mark each [2]
Common mistake: "Cell wall" alone is acceptable; do not accept "cell membrane" as this is present in both.
(b) Advantage of small size for obtaining nutrients [2 marks]
- Surface area to volume ratio is high [1]
- Explanation: With a large surface area relative to volume, nutrients can diffuse across the membrane quickly enough to meet metabolic needs of the entire cell; diffusion distance to all parts of cell is short [1]
Alternative acceptable answer: Small size enables rapid reproduction/division due to less DNA and cytoplasm to replicate.
(c) Type of ribosomes and antibiotic target [2 marks]
- 70S ribosomes (smaller than 80S eukaryotic ribosomes) [1]
- Explanation: Antibiotics like tetracycline or streptomycin bind specifically to the 30S or 50S subunits of 70S ribosomes, inhibiting protein synthesis in bacteria without affecting the larger 80S ribosomes in eukaryotic cells [1]
Question 12 [9 marks]
(a) Reducing sugar identification [2 marks]
- Samples X and Z both give brick red precipitate with Benedict's test when heated [1]
- Reasoning: Benedict's test detects reducing sugars (e.g., glucose, fructose, maltose). Brick red precipitate = positive result = reducing sugar present. Sample Y remains blue, so no reducing sugar [1]
(b) Starch identification [2 marks]
- Sample Y [1]
- Explanation: Iodine turns blue-black in presence of starch (amylose forms helical complex with iodine). Brown-yellow = negative result = no starch; blue-black = positive result [1]
(c) Completed nutrient table [3 marks]
| Sample | Reducing Sugar | Starch | Protein | Lipid |
|---|---|---|---|---|
| X | ✓ | ✗ | ✓ | ✗ |
| Y | ✗ | ✓ | ✗ | ✗ |
| Z | ✓ | ✓ | ✓ | ✓ |
- X: ✓✗✓✗ [1]
- Y: ✗✓✗✗ [1]
- Z: ✓✓✓✓ [1]
Working for Z: Benedict's positive = reducing sugar; Biuret purple = protein; Iodine blue-black = starch; emulsion test positive = lipid. Note: Z originally had reducing sugar; after acid hydrolysis of starch, more reducing sugars released, still positive.
(d) Explanation of acid hydrolysis result [2 marks]
- Acid hydrolysis breaks down starch (non-reducing polysaccharide) into maltose/glucose (reducing sugars) [1]
- Therefore more reducing sugars are present after hydrolysis, giving stronger/more definite positive Benedict's test [1]
Common mistake: Original Z already had reducing sugar; the test after hydrolysis confirms starch was also present (now converted to reducing sugars).
Question 13 [7 marks]
(a) Relationship 0–6 mmol dm⁻³ [2 marks]
- As sucrose concentration increases, rate of reaction increases [1]
- The relationship approximately linear/proportional in this range [1]
- OR rate increases directly with substrate concentration
(b) Plateau explanation [3 marks]
- At high sucrose concentrations, all enzyme active sites are occupied [1]
- Enzyme is working at maximum capacity / Vₘₐₓ [1]
- Enzyme concentration is now the limiting factor, not substrate concentration [1]
- Therefore additional substrate cannot increase rate further
Key terms: saturated, limiting factor, maximum velocity/Vₘₐₓ, active sites fully occupied.
(c) Two ways to increase maximum rate [2 marks]
| Method | Explanation |
|---|---|
| Increase enzyme concentration | More active sites available to bind substrate |
| Increase temperature (to optimum) | More kinetic energy, more frequent successful collisions |
| Add cofactor/activator | Enhances enzyme activity |
Any two valid methods with brief explanation: 1 mark each [2]
Question 14 [7 marks]
(a) Stage 1 process and enzyme [2 marks]
- Transcription [1]
- RNA polymerase [1]
(b) Why polypeptide enters ER lumen [3 marks]
- Proteins destined for secretion or membrane insertion have signal sequences [1]
- The ER lumen provides oxidising environment with enzymes (protein disulfide isomerase) and chaperones for correct folding [1]
- Glycosylation (adding sugar groups) and disulfide bond formation occur in ER [1]
- Incorrect folding in cytoplasm could lead to non-functional protein or aggregation [1]
Any three valid points [3]
(c) Stage 5 function for correct destination [2 marks]
- Proteins are sorted and tagged with molecular markers/address labels [1]
- Vesicles bud off with specific cargo; destination determined by receptor proteins on target membrane [1]
- OR: Modified proteins packaged into transport vesicles with specific coat proteins (COPII, clathrin) that target correct location
Question 15 [7 marks]
(a) Outer and inner membrane functions [3 marks]
| Membrane | Function |
|---|---|
| Outer membrane | Smooth, permeable to small molecules (<10 kDa), contains porins for passage of metabolites; separates mitochondrion from cytoplasm [1] |
| Inner membrane | Highly folded into cristae; impermeable to most ions and small molecules; contains protein complexes for electron transport and ATP synthesis; creates proton gradient [2] |
Key point: The folding (cristae) greatly increases surface area for oxidative phosphorylation complexes.
(b) Mitochondria in muscle cells [2 marks]
- Muscle cells require large amounts of ATP for contraction [1]
- Many mitochondria provide sufficient ATP through aerobic respiration to meet high energy demand [1]
(c) Antibiotics affecting mitochondria [2 marks]
- Mitochondria evolved from free-living prokaryotes (endosymbiotic theory) [1]
- They retain 70S ribosomes similar to bacteria, so antibiotics targeting bacterial 70S ribosomes can also inhibit mitochondrial protein synthesis [1]
Section B Total: 30 marks
SECTION C: Data Analysis and Extended Response – Answers [20 marks]
Question 16 [9 marks]
(a) Identification of structures W, X, Y, Z [4 marks]
| Label | Structure | Mark |
|---|---|---|
| W (outer boundary) | Outer membrane | [1] |
| X (folded inner structure) | Crista / cristae | [1] |
| Y (fluid interior) | Matrix | [1] |
| Z (small circular DNA) | Mitochondrial DNA / mtDNA | [1] |
Accept: Intermembrane space for W if correctly identified between membranes.
(b) Surface area calculation [2 marks]
Working:
-
Surface area with cristae = 30 μm²
-
Surface area without cristae = 2 μm²
-
Fold increase = 30 ÷ 2 = 15 [1]
-
The cristae provide a 15-fold (or 15×) increase in inner membrane surface area [1]
Accept: "15 times greater" or "750% increase" (though fold increase preferred).
(c) Cristae structure and ATP production [3 marks]
- Cristae increase surface area of inner membrane [1]
- Inner membrane contains electron transport chain complexes and ATP synthase enzymes [1]
- Greater surface area allows more complexes to be embedded, increasing capacity for proton pumping and ATP synthesis through chemiosmosis [1]
Link: More cristae → more electron transport chains → greater proton gradient → more ATP produced per unit time.
Question 17 [10 marks]
(a) Graph plotting [3 marks]
Marking criteria:
| Criterion | Marks |
|---|---|
| Both axes correctly labelled with units and linear scale | [1] |
| All 8 points plotted accurately (±0.25 pH, ±1.5 mg/min) | [1] |
| Smooth curve drawn through points, showing rise to peak and fall to zero | [1] |
Expected shape: Bell-shaped curve peaking at pH 2.0 (35 mg/min), declining to zero at pH 5.0–6.0.
(b) Optimum pH estimation [1 mark]
- pH 2.0 [1] (accept 1.8–2.2 from graph reading)
(c) Zero rate at pH 6.0 explanation [3 marks]
- Extreme pH alters ionisation of amino acid residues [1]
- This changes the shape of the active site / denatures the enzyme [1]
- Substrate (protein) no longer fits active site / enzyme-substrate complex cannot form [1]
- Below pH 2, excess H⁺ protonates carboxyl groups; above pH 2, deprotonation affects active site residues; at pH 6.0, active site is completely disrupted [1]
Any 3 valid points [3]
(d) Different optimum pH values in digestive system [3 marks]
- Different regions have different pH environments [1]
- Stomach is highly acidic (pH 1.5–3) due to HCl secretion; pepsin adapted to function here [1]
- Small intestine is alkaline (pH 8) due to bicarbonate from pancreas; trypsin adapted to function here [1]
- This ensures sequential digestion: proteins begin in stomach, continue in intestine, without enzymes destroying each other [1]
Any 3 valid points including functional significance [3]
Question 18 [5 marks]
(a) Blocking ETP and ATP cessation [3 marks]
- Electron transport chain (ETC) establishes proton gradient by pumping H⁺ from matrix to intermembrane space [1]
- This electrochemical gradient drives protons back through ATP synthase, powering ATP synthesis (chemiosmosis) [1]
- Cyanide blocks final electron transfer to O₂, so electrons back up in chain, proton pumping stops, gradient collapses, ATP synthesis ceases [1]
(b) NAD⁺ concentration prediction [3 marks]
- NAD⁺ concentration will decrease / NADH will accumulate [1]
- NADH cannot be reoxidised to NAD⁺ because electrons cannot pass through blocked ETC [1]
- Therefore NAD⁺ is not regenerated; Krebs cycle and glycolysis slow/stop due to lack of NAD⁺ as electron acceptor [1]
Accept: "NADH builds up" as equivalent to "NAD⁺ decreases."
(c) Oxygen therapy insufficient [2 marks]
- Oxygen is the final electron acceptor, but cyanide blocks cytochrome c oxidase [1]
- Unless cyanide is removed, electrons still cannot reach oxygen, so the ETC remains blocked regardless of oxygen availability [1]
Treatment implication: Antidotes for cyanide poisoning (e.g., hydroxocobalamin, nitrites) bind or remove cyanide to restore enzyme function.
Section C Total: 20 marks
GRAND TOTAL: 60 MARKS
Mark Distribution Summary
| Section | Marks |
|---|---|
| A (MCQ) | 10 |
| B (Structured) | 30 |
| C (Extended) | 20 |
| Total | 60 |
Estimated timing: 75 minutes (allowing 5 minutes review)
- Section A: ~10 minutes
- Section B: ~30 minutes
- Section C: ~30 minutes
- Review: ~5 minutes
Common Errors and Teaching Notes
| Error Area | Guidance |
|---|---|
| Confusing 70S vs 80S ribosomes | 70S = prokaryotes, mitochondria, chloroplasts; 80S = eukaryotic cytoplasm |
| Enzyme denaturation vs inhibition | Denaturation = permanent shape change (extreme pH/temp); inhibition = reversible block |
| Surface area:volume ratio | Smaller cells have higher SA:V, favouring diffusion |
| Oxidative phosphorylation location | Occurs on inner mitochondrial membrane, not in matrix |
Free quiz and exam paper access
Enter your details to view this paper
Your access is remembered on this device.