AI Generated Quiz
Secondary 2 Science Scientific Inquiry Quiz
Free Sec 2 Science Scientific Inquiry quiz, Nemo3 AI version, with questions, answers, and syllabus-aligned practice for Singapore students.
These static practice materials are generated from the site's syllabus and paper-generation workflow, with source and model context shown so students and parents can evaluate the material before use.
Questions
Secondary 2 Science Quiz - Scientific Inquiry
Name: ___________________________
Class: ___________________________
Date: ___________________________
Score: _____ / 40
Duration: 45 minutes
Total Marks: 40
Instructions:
- Answer all questions in the spaces provided.
- Show all working for calculation questions.
- Use appropriate significant figures and units.
- Diagrams are not drawn to scale unless stated.
Section A: Multiple Choice Questions (10 × 1 mark = 10 marks)
1. Which of the following best describes the difference between accuracy and precision in measurements?
A. Accuracy is how close measurements are to each other; precision is how close they are to the true value.
B. Accuracy is how close measurements are to the true value; precision is how close they are to each other.
C. Accuracy and precision both refer to how close measurements are to the true value.
D. Accuracy and precision both refer to how close measurements are to each other.
Answer: _____
2. A student uses a ruler with a zero error of +0.2 cm to measure the length of a pencil. The reading on the ruler is 14.5 cm. What is the actual length of the pencil?
A. 14.3 cm
B. 14.5 cm
C. 14.7 cm
D. 14.9 cm
Answer: _____
3. In an experiment to investigate the effect of temperature on the rate of dissolving sugar, which variable is the independent variable?
A. Mass of sugar dissolved
B. Temperature of water
C. Volume of water used
D. Time taken for sugar to dissolve
Answer: _____
4. A student measures the time for a pendulum to complete 20 oscillations using a stopwatch. The reading is 38.4 s. What is the period of the pendulum, expressed to the correct number of significant figures?
A. 1.9 s
B. 1.92 s
C. 1.920 s
D. 2.0 s
Answer: _____
5. Which of the following is a systematic error?
A. Slight variations in reaction time when starting a stopwatch
B. A thermometer that consistently reads 2°C higher than the actual temperature
C. Random fluctuations in room temperature during an experiment
D. Parallax error when reading a measuring cylinder from different angles
Answer: _____
6. A student records the following measurements for the diameter of a wire using a micrometer screw gauge: 0.45 mm, 0.47 mm, 0.44 mm, 0.46 mm, 0.45 mm. What is the mean diameter, expressed to the correct number of significant figures?
A. 0.45 mm
B. 0.454 mm
C. 0.4540 mm
D. 0.5 mm
Answer: _____
7. In a fair test investigating the effect of light intensity on the rate of photosynthesis, which of the following must be kept constant?
A. Light intensity
B. Rate of photosynthesis
C. Temperature and carbon dioxide concentration
D. Number of bubbles produced per minute
Answer: _____
8. A student measures the volume of a liquid using a measuring cylinder. To avoid parallax error, the student should:
A. Read the top of the meniscus
B. Read the bottom of the meniscus at eye level
C. Read the measurement from above
D. Read the measurement from below
Answer: _____
9. Which of the following sets of measurements shows high precision but low accuracy?
A. 9.8, 9.9, 9.8, 9.9, 9.8 (true value = 10.0)
B. 10.1, 9.9, 10.0, 10.2, 9.8 (true value = 10.0)
C. 10.0, 10.0, 10.0, 10.0, 10.0 (true value = 10.0)
D. 8.5, 11.2, 9.8, 10.5, 9.0 (true value = 10.0)
Answer: _____
10. A student calculates the density of a metal block. The mass is measured as 240 g (to 2 significant figures) and the volume is measured as 30 cm³ (to 1 significant figure). The density should be expressed to how many significant figures?
A. 1
B. 2
C. 3
D. 4
Answer: _____
Section B: Structured Questions (6 × 3 marks = 18 marks)
11. A student uses a vernier caliper to measure the external diameter of a cylindrical metal rod. The vernier caliper has a zero error of −0.02 cm. The main scale reading is 1.2 cm and the vernier scale reading is 0.06 cm.
(a) State the actual diameter of the metal rod. [1]
(b) The student measures the diameter at three different positions along the rod and obtains the following actual diameters: 1.24 cm, 1.26 cm, 1.25 cm. Calculate the mean diameter. [1]
(c) Explain why measuring the diameter at multiple positions improves the reliability of the result. [1]
Answer:
(a) _______________________________________________________________________
(b) _______________________________________________________________________
(c) _______________________________________________________________________
12. In an experiment to investigate how the surface area of a solid affects the rate of reaction with acid, a student uses marble chips of different sizes but keeps the mass of marble chips constant.
(a) Identify the independent variable and the dependent variable in this experiment. [1]
(b) State two variables that must be controlled to ensure a fair test. [1]
(c) The student observes that the reaction is faster with smaller marble chips. Explain this observation in terms of particle collisions. [1]
Answer:
(a) _______________________________________________________________________
(b) _______________________________________________________________________
(c) _______________________________________________________________________
13. A student measures the time taken for a toy car to travel down a ramp of length 2.00 m. The student repeats the measurement five times and obtains the following times: 1.42 s, 1.38 s, 1.45 s, 1.40 s, 1.35 s.
(a) Calculate the mean time for the car to travel down the ramp. [1]
(b) Calculate the mean speed of the car. [1]
(c) The student's reaction time introduces a random error of approximately ±0.05 s in each measurement. Explain how repeating the measurement and calculating the mean reduces the effect of this random error. [1]
Answer:
(a) _______________________________________________________________________
(b) _______________________________________________________________________
(c) _______________________________________________________________________
14. A student is asked to determine the density of an irregularly shaped stone.
(a) Name the apparatus needed to measure the mass of the stone. [1]
(b) Describe how the student can measure the volume of the stone using a displacement method. [1]
(c) The mass of the stone is 45.0 g and the volume is 15.0 cm³. Calculate the density of the stone in kg/m³. [1]
Answer:
(a) _______________________________________________________________________
(b) _______________________________________________________________________
(c) _______________________________________________________________________
15. An experiment is conducted to investigate the relationship between the extension of a spring and the force applied to it. The student plots a graph of force (y-axis) against extension (x-axis).
(a) State the type of relationship shown if the graph is a straight line passing through the origin. [1]
(b) The gradient of the graph represents a physical quantity. Name this quantity. [1]
(c) If the student accidentally stretches the spring beyond its elastic limit, how would the graph change? [1]
Answer:
(a) _______________________________________________________________________
(b) _______________________________________________________________________
(c) _______________________________________________________________________
16. A student uses a digital thermometer to measure the temperature of water in a beaker. The thermometer has a resolution of 0.1°C.
(a) State the smallest division on the thermometer. [1]
(b) The student records a temperature of 35.6°C. State the absolute uncertainty in this reading. [1]
(c) The student repeats the measurement three times and obtains 35.6°C, 35.7°C, and 35.5°C. Calculate the random uncertainty in the mean value. [1]
Answer:
(a) _______________________________________________________________________
(b) _______________________________________________________________________
(c) _______________________________________________________________________
Section C: Data Analysis and Experimental Design (4 × 3 marks = 12 marks)
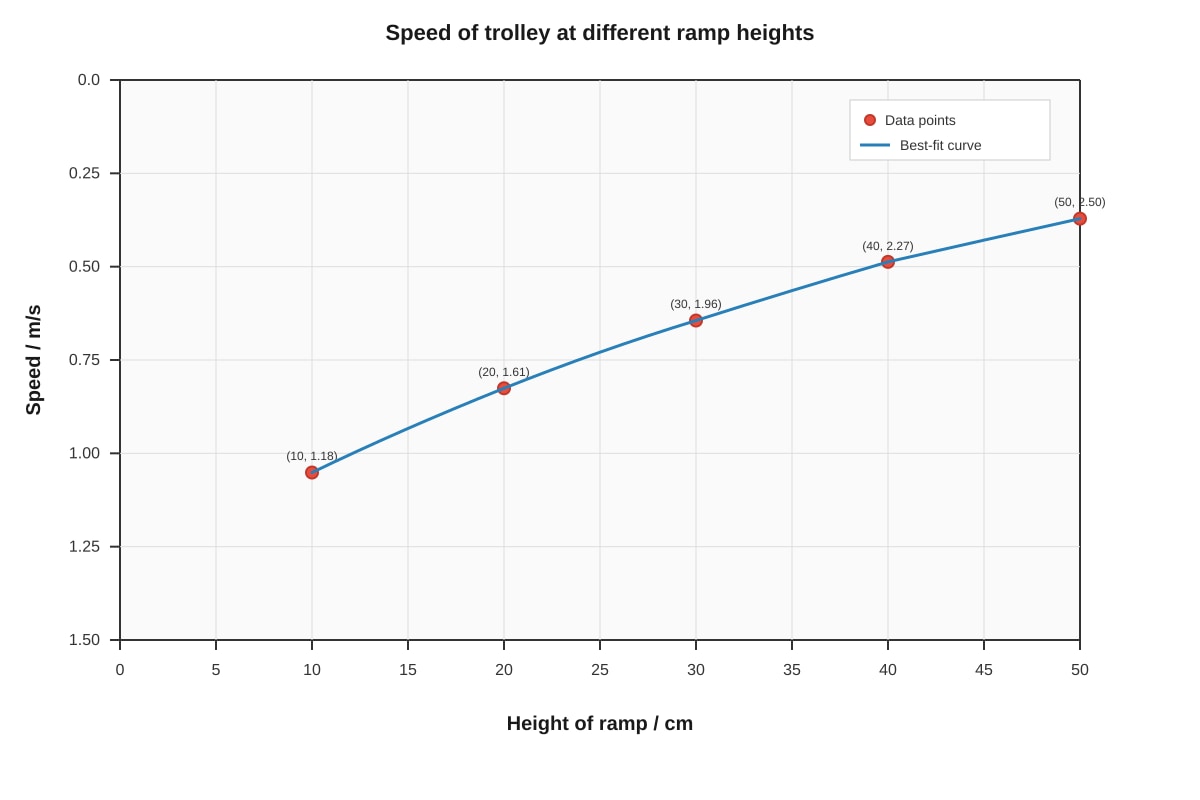
17. A student investigates how the height of a ramp affects the speed of a trolley at the bottom. The student varies the height and measures the time taken for the trolley to travel a fixed distance of 1.00 m along the horizontal floor after leaving the ramp. The results are shown below.
| Height of ramp / cm | Time for 1.00 m / s |
|---|---|
| 10 | 0.85 |
| 20 | 0.62 |
| 30 | 0.51 |
| 40 | 0.44 |
| 50 | 0.40 |
(a) Calculate the speed of the trolley for each height. [1]
(b) Plot a graph of speed (y-axis) against height (x-axis) on the grid provided. [1]
(c) Describe the relationship between the height of the ramp and the speed of the trolley. [1]
Answer:
(a) _______________________________________________________________________
(b)
Generated graph for Q17.
(c) _______________________________________________________________________
18. In an experiment to determine the specific heat capacity of a metal block, a student uses an electrical heater to supply energy to the block. The following data is recorded:
- Mass of metal block = 0.500 kg
- Power of heater = 50.0 W
- Time heater is switched on = 300 s
- Initial temperature of block = 20.0°C
- Final temperature of block = 45.0°C
(a) Calculate the energy supplied by the heater. [1]
(b) Calculate the temperature rise of the block. [1]
(c) Calculate the specific heat capacity of the metal block. [1]
Answer:
(a) _______________________________________________________________________
(b) _______________________________________________________________________
(c) _______________________________________________________________________
19. A student wants to investigate how the concentration of acid affects the rate of reaction with magnesium ribbon. The student plans to measure the volume of hydrogen gas produced every 30 seconds.
(a) Draw a labelled diagram of the apparatus the student should use to collect and measure the volume of hydrogen gas. [1]
(b) State two safety precautions the student should take when handling acid. [1]
(c) The student decides to use 50 cm³ of acid for each concentration. Explain why it is important to keep the volume of acid constant. [1]
Answer:
(a)
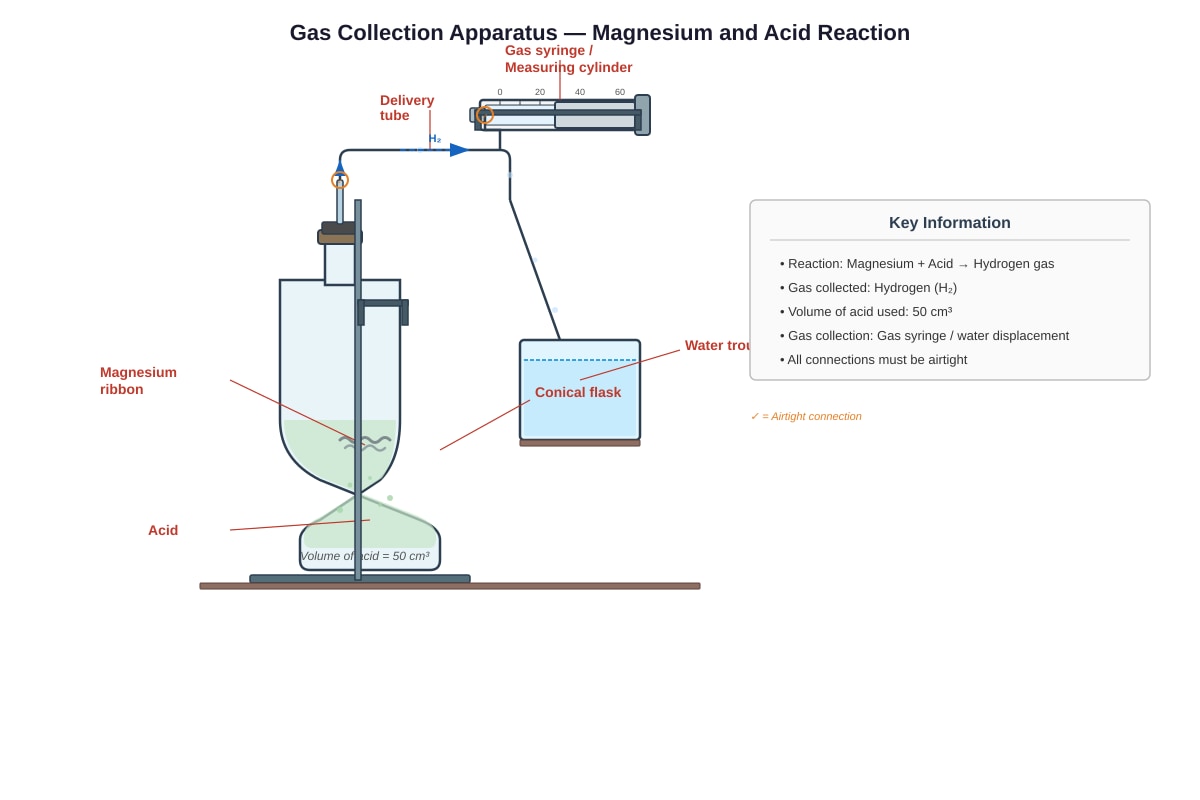
Generated experimental_setup for Q19.
(b) _______________________________________________________________________
(c) _______________________________________________________________________
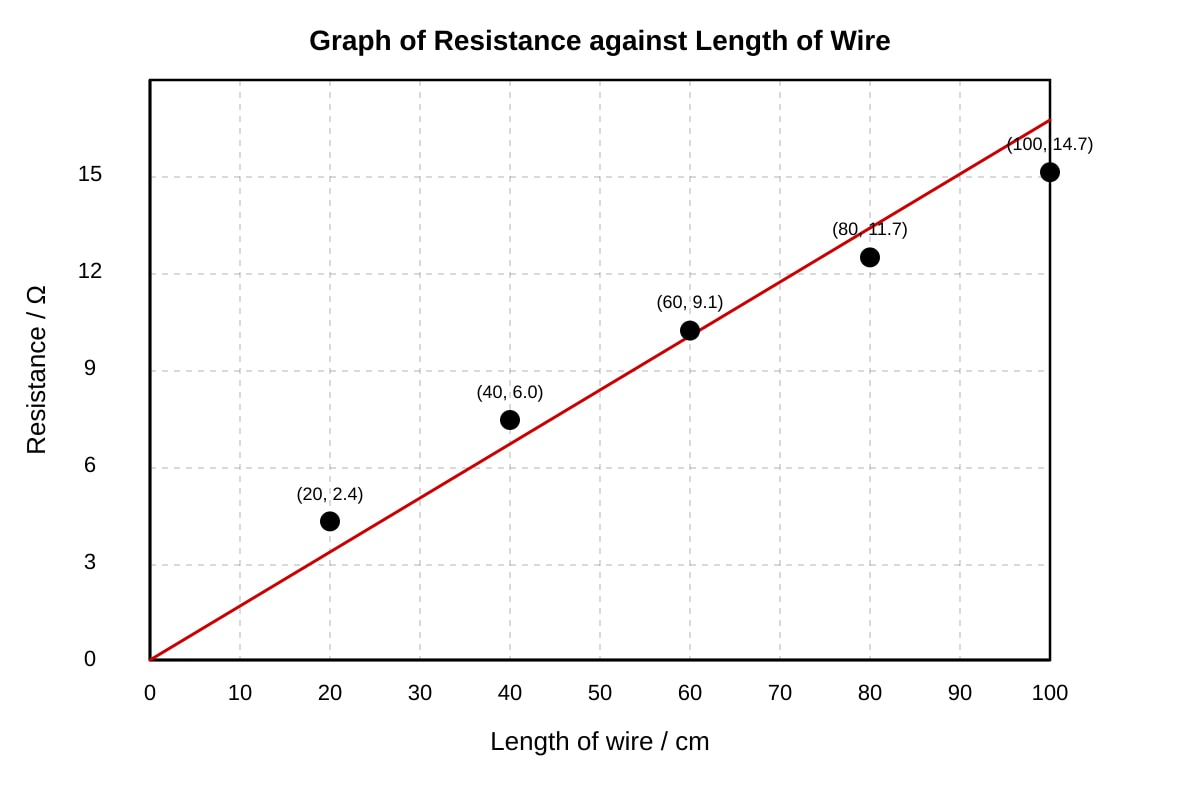
20. A student conducts an experiment to find the resistance of a wire at different lengths. The student uses a circuit with a power supply, ammeter, voltmeter, and the wire. The following results are obtained:
| Length of wire / cm | Current / A | Voltage / V |
|---|---|---|
| 20 | 0.50 | 1.2 |
| 40 | 0.30 | 1.8 |
| 60 | 0.22 | 2.0 |
| 80 | 0.18 | 2.1 |
| 100 | 0.15 | 2.2 |
(a) Calculate the resistance of the wire for each length. [1]
(b) Plot a graph of resistance (y-axis) against length (x-axis). [1]
(c) State the relationship between resistance and length of the wire, and explain why the graph may not pass through the origin. [1]
Answer:
(a) _______________________________________________________________________
(b)
Generated graph for Q20.
(c) _______________________________________________________________________
End of Quiz
Answers
Secondary 2 Science Quiz - Scientific Inquiry (Answer Key)
Total Marks: 40
Section A: Multiple Choice Questions (10 × 1 mark = 10 marks)
1. Answer: B
Explanation: Accuracy refers to how close a measured value is to the true/accepted value. Precision refers to how close repeated measurements are to each other (consistency). A common mnemonic: "Accuracy = correct; Precision = consistent."
2. Answer: A
Explanation: Zero error of +0.2 cm means the instrument reads 0.2 cm higher than the true value when the jaws are closed. Actual reading = Measured reading − Zero error = 14.5 cm − 0.2 cm = 14.3 cm.
3. Answer: B
Explanation: The independent variable is the one deliberately changed by the experimenter. Here, the student changes the temperature of water to see its effect on dissolving rate. The dependent variable is the rate of dissolving (or time taken). Volume of water and mass of sugar are controlled variables.
4. Answer: B
Explanation: Period = Total time / Number of oscillations = 38.4 s / 20 = 1.92 s. The time (38.4 s) has 3 significant figures; 20 is an exact count (infinite significant figures). The result should be given to 3 significant figures: 1.92 s.
5. Answer: B
Explanation: A systematic error is a consistent, repeatable error that shifts all measurements in the same direction. A thermometer consistently reading 2°C high is a systematic error. Options A, C, and D describe random errors (unpredictable variations).
6. Answer: A
Explanation: Mean = (0.45 + 0.47 + 0.44 + 0.46 + 0.45) / 5 = 2.27 / 5 = 0.454 mm. The individual measurements have 2 significant figures (0.45, 0.47, etc.). The mean should be expressed to 2 significant figures: 0.45 mm.
7. Answer: C
Explanation: In a fair test, only the independent variable (light intensity) is changed, and the dependent variable (rate of photosynthesis) is measured. All other variables that could affect the outcome (temperature, CO₂ concentration, type of plant, etc.) must be controlled.
8. Answer: B
Explanation: For aqueous solutions in a measuring cylinder, the meniscus is concave. The correct reading is at the bottom of the meniscus, taken at eye level to avoid parallax error. Reading from above or below introduces parallax error.
9. Answer: A
Explanation: High precision = values close to each other (small spread). Low accuracy = values far from true value. Set A: values are tightly clustered (9.8–9.9) but systematically below the true value of 10.0. Set B shows high accuracy and reasonable precision. Set C shows both high accuracy and high precision. Set D shows low precision (large spread) and low accuracy.
10. Answer: A
Explanation: In multiplication/division, the result should have the same number of significant figures as the measurement with the fewest significant figures. Volume has 1 significant figure (30 cm³), mass has 2 (240 g). Density = mass/volume → result limited to 1 significant figure.
Section B: Structured Questions (6 × 3 marks = 18 marks)
11.
(a) Answer: 1.28 cm [1]
Working: Actual reading = Main scale + Vernier scale − Zero error = 1.2 cm + 0.06 cm − (−0.02 cm) = 1.28 cm.
Note: Negative zero error means the zero is to the left of the main scale zero, so we add the correction.
(b) Answer: 1.25 cm [1]
Working: Mean = (1.24 + 1.26 + 1.25) / 3 = 3.75 / 3 = 1.25 cm.
(c) Answer: Measuring at multiple positions accounts for variations in diameter along the rod (the rod may not be perfectly uniform). Taking the mean reduces the effect of random errors and gives a more reliable estimate of the average diameter. [1]
Marking note: Accept "identifies non-uniformity" or "reduces random error" or "improves reliability/representativeness."
12.
(a) Answer: Independent variable: Surface area of marble chips (or size of marble chips). Dependent variable: Rate of reaction (or volume of gas produced per unit time / time taken for reaction to complete). [1]
Marking note: Both variables must be correctly identified for the mark.
(b) Answer: Any two of: Mass of marble chips, concentration of acid, volume of acid, temperature of acid, type of acid. [1]
Marking note: Must be variables that could affect the rate of reaction.
(c) Answer: Smaller marble chips have a larger total surface area for the same mass. This exposes more particles to the acid, increasing the frequency of effective collisions between acid particles and marble surface, thus increasing the rate of reaction. [1]
Marking note: Must mention surface area and collision frequency.
13.
(a) Answer: 1.40 s [1]
Working: Mean = (1.42 + 1.38 + 1.45 + 1.40 + 1.35) / 5 = 7.00 / 5 = 1.40 s (3 significant figures, consistent with data).
(b) Answer: 1.43 m/s [1]
Working: Speed = Distance / Time = 2.00 m / 1.40 s = 1.428... ≈ 1.43 m/s (3 significant figures).
(c) Answer: Random errors vary unpredictably in magnitude and direction. By repeating measurements and calculating the mean, positive and negative errors tend to cancel out, reducing the overall uncertainty in the mean value compared to a single measurement. [1]
Marking note: Key idea: random errors cancel out / mean is more reliable than single reading.
14.
(a) Answer: Electronic balance (or digital balance / top-pan balance). [1]
Marking note: "Weighing scale" is acceptable if qualified as electronic/digital. Spring balance measures weight, not mass directly.
(b) Answer: Fill a measuring cylinder with a known volume of water. Record the initial volume. Tie the stone to a string and lower it gently into the water until fully submerged. Record the new volume. The volume of the stone = final volume − initial volume. [1]
Marking note: Must mention initial and final volume readings, and subtraction. "Displacement can" method also acceptable.
(c) Answer: 3000 kg/m³ [1]
Working: Density = Mass / Volume = 45.0 g / 15.0 cm³ = 3.00 g/cm³. Convert to kg/m³: 3.00 g/cm³ × 1000 = 3000 kg/m³ (or 3.00 × 10³ kg/m³).
Marking note: 1 mark for correct calculation and unit conversion. Accept 3.00 × 10³ kg/m³.
15.
(a) Answer: Directly proportional (or linear relationship with zero intercept). [1]
Marking note: "Direct proportion" or "F ∝ x" acceptable.
(b) Answer: Spring constant (or force constant / stiffness of the spring). [1]
Marking note: Symbol k. Units: N/m.
(c) Answer: Beyond the elastic limit, the spring undergoes permanent deformation. The extension increases more for the same increase in force, so the graph curves upward (gradient increases) and no longer follows Hooke's Law. [1]
Marking note: Must mention non-linear / curved / gradient increases / permanent deformation.
16.
(a) Answer: 0.1°C [1]
Explanation: The resolution (smallest division) of a digital instrument is the smallest change it can display.
(b) Answer: ±0.05°C (or ±0.1°C) [1]
Explanation: For a digital instrument, the absolute uncertainty is typically ± half the smallest division (resolution). Half of 0.1°C = 0.05°C. Some conventions use ±1 in the last digit (±0.1°C). Both accepted with correct reasoning.
(c) Answer: ±0.05°C (or ±0.1°C) [1]
Working: Random uncertainty = (max − min) / 2 = (35.7 − 35.5) / 2 = 0.1°C for a single reading. Uncertainty in mean = random uncertainty / √n = 0.1 / √3 ≈ 0.06°C. Alternatively, half-range of mean values: readings are 35.6, 35.7, 35.5 → mean = 35.6. Deviations: 0, +0.1, −0.1. Mean deviation ≈ 0.07°C. Simplified school method: half-range / √n or just half-range. Accept ±0.05°C to ±0.1°C with valid method.
Marking note: At this level, often accepted as half-range = 0.1°C or half-range/√n ≈ 0.06°C. Award mark for correct method shown.
Section C: Data Analysis and Experimental Design (4 × 3 marks = 12 marks)
17.
(a) Answer:
| Height / cm | Time / s | Speed / m/s |
|---|---|---|
| 10 | 0.85 | 1.18 |
| 20 | 0.62 | 1.61 |
| 30 | 0.51 | 1.96 |
| 40 | 0.44 | 2.27 |
| 50 | 0.40 | 2.50 |
| Working: Speed = Distance / Time = 1.00 m / time. All speeds to 3 significant figures. |
(b) Graph requirements: [1]
- Axes labelled with quantities and units: x-axis "Height of ramp / cm", y-axis "Speed / m/s"
- Appropriate scales (using >50% of grid)
- All 5 points plotted accurately (± half a small square)
- Smooth curve of best fit (not straight line) — the relationship is not linear; speed ∝ √height
Marking note: 1 mark for all three: labels, plots, curve. Deduct for missing units, poor scale, straight line.
(c) Answer: As the height of the ramp increases, the speed of the trolley increases. The relationship is non-linear: speed increases with the square root of height (v ∝ √h), so the graph curves upward with a decreasing gradient. [1]
Marking note: Must mention non-linear / curved / decreasing gradient / square root relationship.
18.
(a) Answer: 15000 J (or 1.5 × 10⁴ J) [1]
Working: Energy = Power × Time = 50.0 W × 300 s = 15000 J.
(b) Answer: 25.0°C [1]
Working: Temperature rise = Final − Initial = 45.0°C − 20.0°C = 25.0°C.
(c) Answer: 1200 J/(kg·°C) (or 1200 J/kg·K) [1]
Working: Energy = m × c × Δθ → c = Energy / (m × Δθ) = 15000 J / (0.500 kg × 25.0°C) = 15000 / 12.5 = 1200 J/(kg·°C).
Marking note: Unit must be correct. Accept J/kg·K (equivalent).
19.
(a) Diagram: [1]
Expected features in image placeholder:
- Conical flask with magnesium ribbon and acid
- Delivery tube connecting flask to gas collection device
- Gas syringe (preferred) OR inverted measuring cylinder in water trough
- All apparatus labelled
- Airtight connections (bung in flask)
Marking note: 1 mark for correct labelled diagram showing gas collection method.
(b) Answer: Any two of: Wear safety goggles; Wear gloves; Handle acid with care / avoid skin contact; Do not inhale fumes; Work in a well-ventilated area; Dilute concentrated acid by adding acid to water (not water to acid); Clean up spills immediately. [1]
Marking note: Must be specific to acid handling.
(c) Answer: The volume of acid affects the number of acid particles available for reaction. If the volume varies, it becomes a second independent variable, making it impossible to determine whether changes in reaction rate are due to concentration or volume. Keeping volume constant ensures a fair test where only concentration affects the rate. [1]
Marking note: Key idea: volume is a control variable; changing it would introduce a confounding variable.
20.
(a) Answer:
| Length / cm | Current / A | Voltage / V | Resistance / Ω |
|---|---|---|---|
| 20 | 0.50 | 1.2 | 2.4 |
| 40 | 0.30 | 1.8 | 6.0 |
| 60 | 0.22 | 2.0 | 9.1 |
| 80 | 0.18 | 2.1 | 11.7 |
| 100 | 0.15 | 2.2 | 14.7 |
| Working: R = V / I for each row. Values to 2 significant figures (limited by current readings). |
(b) Graph requirements: [1]
- Axes labelled: x-axis "Length of wire / cm", y-axis "Resistance / Ω"
- Appropriate scales
- All 5 points plotted accurately
- Best-fit straight line (should pass near origin but may have small intercept)
Marking note: 1 mark for all three: labels, plots, best-fit line.
(c) Answer: Resistance is directly proportional to the length of the wire (R ∝ l). The graph is a straight line with positive gradient. It may not pass through the origin because of contact resistance at the crocodile clips, resistance of connecting wires, or a zero error in the meters. [1]
Marking note: Must state direct proportion and give a valid reason for non-zero intercept (contact resistance, lead resistance, zero error).
End of Answer Key
Free quiz and exam paper access
Enter your details to view this paper
Your access is remembered on this device.