From Real Exams Quiz
Secondary 2 Science Scientific Inquiry Quiz
Free Sec 2 Science Scientific Inquiry quiz, Nemo3 Exam version, with questions, answers, and syllabus-aligned practice for Singapore students.
These static practice materials are generated from the site's syllabus and paper-generation workflow, with source and model context shown so students and parents can evaluate the material before use.
Questions
Secondary 2 Science Quiz - Scientific Inquiry
Name: ___________________________
Class: ___________________________
Date: ___________________________
Score: _____ / 40
Duration: 45 minutes
Total Marks: 40
Instructions:
- Answer all questions.
- Write your answers in the spaces provided.
- For calculation questions, show your working clearly.
- The number of marks is given in brackets [ ] at the end of each question or part question.
Section A: Multiple Choice Questions (10 marks)
Questions 1 to 10 carry 1 mark each. Choose the correct answer and write the letter (A, B, C, or D) in the box provided.
-
A student measures the length of a metal rod three times using a ruler. The readings are 15.2 cm, 15.3 cm, and 15.2 cm. The actual length of the rod is 15.0 cm. Which statement best describes the measurements? [1]
☐ A. Accurate and precise
☐ B. Accurate but not precise
☐ C. Precise but not accurate
☐ D. Neither accurate nor precise -
In an experiment to investigate the effect of temperature on the rate of dissolving sugar, which variable is the independent variable? [1]
☐ A. Mass of sugar dissolved
☐ B. Temperature of water
☐ C. Volume of water used
☐ D. Time taken for sugar to dissolve -
A student uses a measuring cylinder to measure 25 cm³ of water. The bottom of the meniscus is at the 25 cm³ mark, but the student's eye is above the level of the meniscus. What type of error is this? [1]
☐ A. Zero error
☐ B. Parallax error
☐ C. Random error
☐ D. Systematic error -
Which of the following shows the correct number of significant figures for the measurement 0.00450 kg? [1]
☐ A. 2
☐ B. 3
☐ C. 4
☐ D. 5 -
A student calculates the density of a metal block. The mass is measured as 45.0 g (3 s.f.) and the volume is measured as 15.0 cm³ (3 s.f.). The calculated density is 3.00 g/cm³. How many significant figures should the final answer be given to? [1]
☐ A. 1
☐ B. 2
☐ C. 3
☐ D. 4 -
In a fair test investigating how the surface area of a parachute affects the time taken to fall, which variable must be kept constant? [1]
☐ A. Surface area of parachute
☐ B. Time taken to fall
☐ C. Mass of the parachute
☐ D. Height from which parachute is dropped -
A student records the temperature of water every minute as it cools. Which type of graph is most appropriate to display this data? [1]
☐ A. Bar chart
☐ B. Pie chart
☐ C. Line graph
☐ D. Histogram -
The diameter of a wire is measured using a micrometer screw gauge. The reading on the main scale is 2.5 mm and the thimble scale reads 0.38 mm. If there is a zero error of +0.02 mm, what is the correct diameter? [1]
☐ A. 2.86 mm
☐ B. 2.88 mm
☐ C. 2.90 mm
☐ D. 2.92 mm -
Which of the following is a hypothesis? [1]
☐ A. "I will measure the temperature every minute."
☐ B. "The temperature of water increases when heated."
☐ C. "If the concentration of acid increases, the rate of reaction will increase."
☐ D. "The experiment was repeated three times." -
A student concludes: "Heavier objects fall faster than lighter objects." Which of the following would be the best evidence to evaluate this conclusion? [1]
☐ A. A single experiment dropping a feather and a hammer
☐ B. Multiple experiments dropping objects of different masses in a vacuum
☐ C. A textbook statement about gravity
☐ D. An opinion from a scientist
Section B: Structured Questions (18 marks)
Answer all questions in the spaces provided.
-
A student uses a digital stopwatch to measure the time taken for a pendulum to complete 20 oscillations. The readings are: 28.4 s, 28.6 s, 28.5 s, 28.7 s, 28.4 s.
(a) Calculate the average time for 20 oscillations. [1]
(b) Calculate the period of the pendulum (time for one oscillation). [1]
(c) The student's reaction time introduces a random error of approximately ±0.2 s. Explain how taking the average of multiple readings reduces the effect of random error. [2]
-
In an experiment to investigate the effect of light intensity on the rate of photosynthesis, a student places a pondweed at different distances from a lamp and counts the number of bubbles produced per minute.
(a) Identify the independent variable and the dependent variable. [2]
Independent variable: ___________________________________________________________
Dependent variable: ____________________________________________________________
(b) State two variables that should be kept constant to ensure a fair test. [2]
(c) The student notices that the water temperature increases when the lamp is closer to the pondweed. Explain why this makes the experiment unfair. [2]
-
-
A student measures the mass of an empty beaker as 45.3 g. After adding some salt, the mass of the beaker and salt is 62.8 g. The student then adds 50.0 cm³ of water (measured using a measuring cylinder) to dissolve the salt.
(a) Calculate the mass of salt added. [1]
(b) The measuring cylinder has a smallest division of 1 cm³. What is the uncertainty in the volume measurement? [1]
(c) Calculate the density of the salt solution, given that the total volume of the solution is 52.0 cm³. Give your answer to 3 significant figures. [2]
-
The diagram below shows a micrometer screw gauge measuring the thickness of a coin.
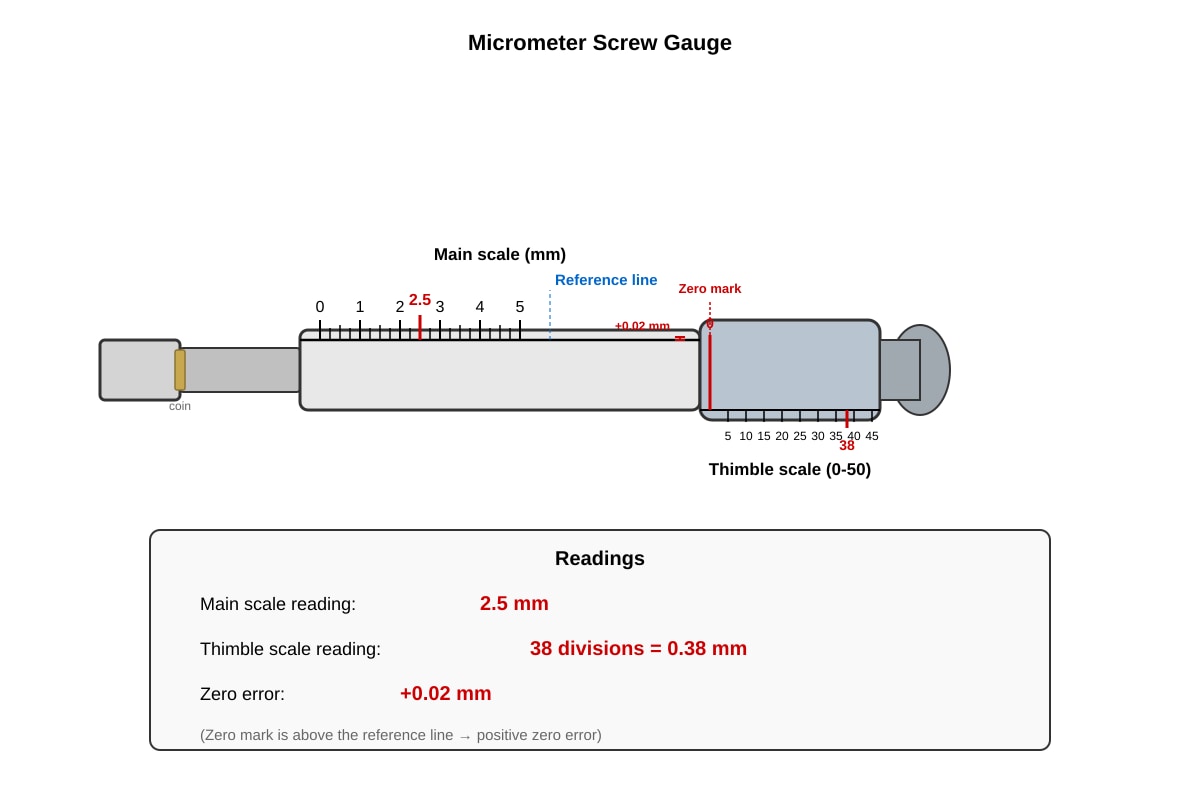
Generated diagram for Q14.
(a) State the main scale reading and the thimble scale reading. [1]

________________________________________________________________________________

(b) Calculate the observed reading. [1]

________________________________________________________________________________

(c) Determine the corrected reading, accounting for the zero error. [1]

________________________________________________________________________________
15. A student investigates how the length of a wire affects its resistance. The table below shows the results.
| Length of wire / cm | Resistance / Ω |
|---------------------|----------------|
| 10                  | 1.2            |
| 20                  | 2.4            |
| 30                  | 3.6            |
| 40                  | 4.8            |
| 50                  | 6.0            |

(a) Plot the points on the grid below and draw the best-fit line. [2]
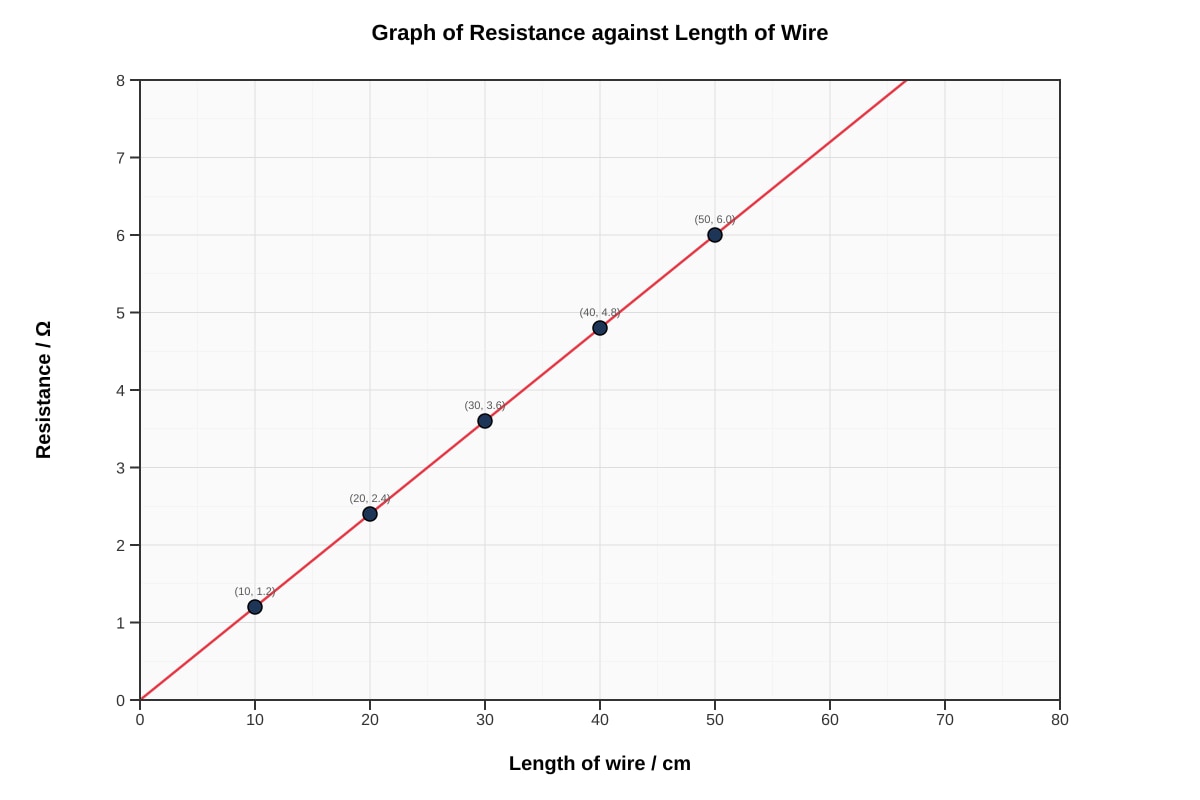
Generated graph for Q15.
(b) Describe the relationship between the length of the wire and its resistance. [1]

________________________________________________________________________________

(c) Use the graph to predict the resistance of a wire of length 65 cm. [1]

________________________________________________________________________________

(d) Suggest one reason why the resistance might not be exactly proportional to length in a real experiment. [1]

________________________________________________________________________________
Section C: Data Analysis and Experimental Design (12 marks)
Answer all questions in the spaces provided.
-
A student conducts an experiment to determine the density of an irregularly shaped stone. The student uses a measuring cylinder and a digital balance.
The following steps are carried out:
- Measure the mass of the stone.
- Fill the measuring cylinder with water and record the initial volume.
- Lower the stone into the water and record the final volume.
- Calculate the volume of the stone.
- Calculate the density of the stone.
(a) The mass of the stone is 48.5 g. The initial volume of water is 30 cm³ and the final volume is 48 cm³. Calculate the density of the stone. Give your answer to 2 significant figures. [2]
(b) The measuring cylinder has a smallest division of 1 cm³. State the uncertainty in the volume measurement. [1]
(c) The student repeats the experiment three times and obtains densities of 2.7 g/cm³, 2.8 g/cm³, and 2.6 g/cm³. Calculate the average density. [1]
(d) The accepted value for the density of the stone is 2.7 g/cm³. Calculate the percentage error of the student's average density. [2]
-
A group of students plans an investigation to find out how the angle of a ramp affects the speed of a toy car at the bottom of the ramp.
(a) Write a suitable hypothesis for this investigation. [1]
(b) Identify the independent variable, dependent variable, and one controlled variable. [3]
Independent variable: ___________________________________________________________
Dependent variable: ____________________________________________________________
Controlled variable: ____________________________________________________________
(c) Describe how the students should measure the speed of the toy car at the bottom of the ramp. Include the apparatus needed and the method. [3]
(d) State one safety precaution the students should take. [1]
-
The table below shows the results of an experiment investigating the cooling of hot water in two different containers.
Time / min Temperature of water in metal container / °C Temperature of water in plastic container / °C 0 80 80 2 68 72 4 58 65 6 50 59 8 44 54 10 39 50 (a) On the grid below, plot the cooling curves for both containers on the same axes. Use a solid line for the metal container and a dashed line for the plastic container. [3]
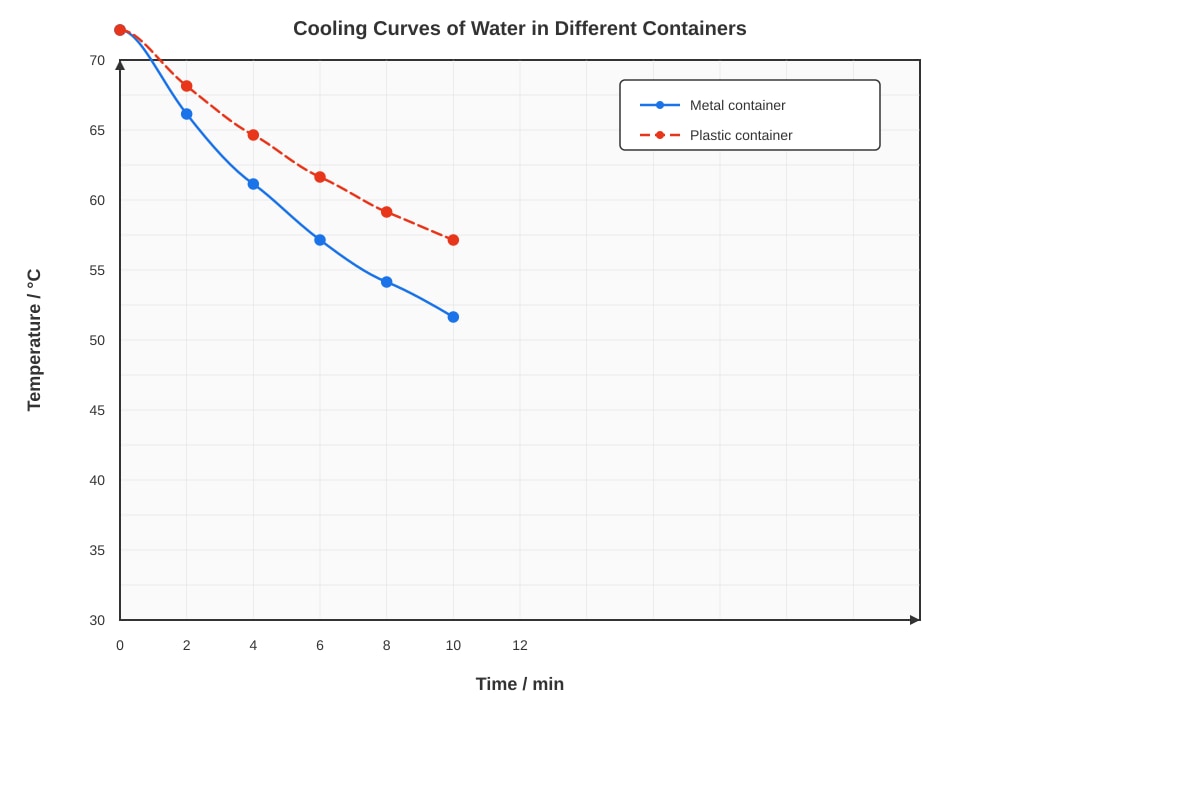
Generated graph for Q18.
(b) Using the graph, determine the time taken for the water in the metal container to cool from 70°C to 50°C. [1]

________________________________________________________________________________

(c) Explain why the water in the metal container cools faster than in the plastic container. [2]

________________________________________________________________________________
________________________________________________________________________________
19. A student measures the diameter of a ball bearing using a vernier caliper. The main scale reads 1.2 cm and the vernier scale reads 0.04 cm. The vernier caliper has a zero error of -0.02 cm.
(a) Calculate the corrected diameter of the ball bearing. [2]

________________________________________________________________________________
________________________________________________________________________________

(b) The student uses this diameter to calculate the volume of the ball bearing using the formula $V = \frac{4}{3}\pi r^3$. If the diameter is measured to 3 significant figures, to how many significant figures should the volume be given? Explain your answer. [2]

________________________________________________________________________________
________________________________________________________________________________
20. In an experiment to test the effectiveness of different insulating materials, a student wraps identical beakers of hot water with different materials and measures the temperature drop after 10 minutes.
The results are shown below:

| Insulating material | Initial temperature / °C | Final temperature / °C | Temperature drop / °C |
|---------------------|--------------------------|------------------------|----------------------|
| Cotton wool         | 80                       | 62                     | 18                   |
| Bubble wrap         | 80                       | 65                     | 15                   |
| Aluminium foil      | 80                       | 58                     | 22                   |
| No insulation       | 80                       | 50                     | 30                   |

(a) Which material is the best insulator? Explain your choice using the data. [2]

________________________________________________________________________________
________________________________________________________________________________

(b) The student concludes: "Aluminium foil is a poor insulator because it is a metal." Evaluate this conclusion. [2]

________________________________________________________________________________
________________________________________________________________________________

(c) Suggest two improvements to the experimental design to obtain more reliable results. [2]

________________________________________________________________________________
________________________________________________________________________________
End of Quiz
Answers
Secondary 2 Science Quiz - Scientific Inquiry (Answer Key)
Total Marks: 40
Section A: Multiple Choice Questions (10 marks)
-
C — Precise but not accurate
Explanation: The readings (15.2, 15.3, 15.2) are close to each other (precise) but far from the true value of 15.0 cm (not accurate).
Marking: 1 mark for correct choice. -
B — Temperature of water
Explanation: The independent variable is the one deliberately changed by the experimenter. Here, temperature is being changed to see its effect on dissolving rate.
Marking: 1 mark for correct choice. -
B — Parallax error
Explanation: Parallax error occurs when the eye is not perpendicular to the scale reading. Viewing from above the meniscus causes the reading to appear lower than the true value.
Marking: 1 mark for correct choice. -
B — 3
Explanation: In 0.00450 kg, the leading zeros are not significant. The digits 4, 5, and the trailing zero after the decimal are significant (3 s.f.).
Marking: 1 mark for correct choice. -
C — 3
Explanation: For multiplication/division, the result should have the same number of significant figures as the measurement with the fewest significant figures. Both mass (45.0 g) and volume (15.0 cm³) have 3 s.f., so density = 3.00 g/cm³ (3 s.f.).
Marking: 1 mark for correct choice. -
D — Height from which parachute is dropped
Explanation: In a fair test, only the independent variable (surface area) and dependent variable (time to fall) change. All other variables (mass, drop height, shape, etc.) must be controlled.
Marking: 1 mark for correct choice. -
C — Line graph
Explanation: Line graphs are used for continuous data showing how one variable changes over time or against another continuous variable. Temperature vs. time is continuous.
Marking: 1 mark for correct choice. -
A — 2.86 mm
Explanation: Observed reading = main scale + thimble scale = 2.5 mm + 0.38 mm = 2.88 mm. Corrected reading = observed reading − zero error = 2.88 mm − (+0.02 mm) = 2.86 mm.
Marking: 1 mark for correct choice. -
C — "If the concentration of acid increases, the rate of reaction will increase."
Explanation: A hypothesis is a testable prediction stating a relationship between variables, often in "If... then..." form. Option C predicts how changing the independent variable (acid concentration) affects the dependent variable (reaction rate).
Marking: 1 mark for correct choice. -
B — Multiple experiments dropping objects of different masses in a vacuum
Explanation: To test the conclusion scientifically, controlled experiments are needed. A vacuum removes air resistance (a confounding variable), and testing multiple masses provides reliable evidence.
Marking: 1 mark for correct choice.
Section B: Structured Questions (18 marks)
-
(a) Average time = 28.5 s
Working: (28.4 + 28.6 + 28.5 + 28.7 + 28.4) / 5 = 142.6 / 5 = 28.52 s ≈ 28.5 s (to 1 d.p. or 3 s.f.)
Marking: 1 mark for correct calculation and answer.(b) Period = 1.43 s (or 1.425 s)
Working: Period = Average time for 20 oscillations / 20 = 28.52 s / 20 = 1.426 s ≈ 1.43 s (3 s.f.)
Marking: 1 mark for correct calculation using answer from (a).(c) Random errors fluctuate randomly above and below the true value. Taking multiple readings and averaging them causes positive and negative errors to cancel out, bringing the average closer to the true value.
Marking: 1 mark for mentioning random errors fluctuate/cancel out; 1 mark for explaining average reduces effect. -
(a) Independent variable: Distance of lamp from pondweed (or light intensity)
Dependent variable: Number of bubbles produced per minute (rate of photosynthesis)
Marking: 1 mark each for correct identification.(b) Any two of:
- Type/species of pondweed
- Length/mass of pondweed
- Volume of water
- Temperature of water (initially)
- Concentration of CO₂ (e.g., NaHCO₃ concentration)
- Time allowed for equilibration
Marking: 1 mark each for any two valid controlled variables.
(c) When the lamp is closer, it emits more heat, raising the water temperature. Temperature also affects the rate of photosynthesis (enzyme activity). Since temperature changes with distance, it becomes a confounding variable — the student cannot tell if changes in bubble rate are due to light intensity or temperature.
Marking: 1 mark for identifying temperature increases; 1 mark for explaining it acts as a confounding variable/unfair test. -
(a) Mass of salt = 17.5 g
Working: 62.8 g − 45.3 g = 17.5 g
Marking: 1 mark for correct subtraction and answer with unit.(b) Uncertainty = ±0.5 cm³
Explanation: For an analogue measuring instrument, the uncertainty is typically half the smallest division. Smallest division = 1 cm³, so uncertainty = ±0.5 cm³.
Marking: 1 mark for correct value with unit.(c) Density = 1.54 g/cm³ (3 s.f.)
Working: Total mass = 62.8 g (beaker + salt + water). Wait — the question says "total volume of the solution is 52.0 cm³". The mass of the solution = mass of salt + mass of water. Mass of water = 50.0 g (assuming density 1 g/cm³). Mass of solution = 17.5 g + 50.0 g = 67.5 g. Density = 67.5 g / 52.0 cm³ = 1.298... g/cm³ ≈ 1.30 g/cm³ (3 s.f.).
Correction: Let me recalculate carefully.
Mass of salt = 17.5 g. Volume of water = 50.0 cm³ → mass of water ≈ 50.0 g. Total mass of solution = 67.5 g. Total volume = 52.0 cm³. Density = 67.5 / 52.0 = 1.298... = 1.30 g/cm³ (3 s.f.).
Marking: 1 mark for correct mass of solution; 1 mark for correct density calculation to 3 s.f. with unit. -
(a) Main scale reading = 2.5 mm; Thimble scale reading = 0.38 mm
Marking: 1 mark for both correct.(b) Observed reading = 2.88 mm
Working: 2.5 mm + 0.38 mm = 2.88 mm
Marking: 1 mark for correct addition.(c) Corrected reading = 2.86 mm
Working: Corrected = Observed − Zero error = 2.88 mm − (+0.02 mm) = 2.86 mm
Marking: 1 mark for correct subtraction of zero error. -
(a) Graph requirements:
- Axes labelled with units: "Length of wire / cm" and "Resistance / Ω"
- Appropriate scales (e.g., 1 cm = 5 cm on x-axis, 1 cm = 1 Ω on y-axis)
- All 5 points plotted correctly
- Best-fit straight line passing through origin (0,0) and points
Marking: 1 mark for correct axes, scales, and points; 1 mark for best-fit line through origin.
(b) Resistance is directly proportional to the length of the wire. (Or: As length increases, resistance increases linearly/proportionally.)
Marking: 1 mark for "directly proportional" or equivalent description.(c) Resistance at 65 cm = 7.8 Ω
Working: From graph, gradient = 0.12 Ω/cm. At 65 cm, R = 0.12 × 65 = 7.8 Ω. Or by extrapolation of best-fit line.
Marking: 1 mark for correct value from graph (accept 7.7–7.9 Ω).(d) Any one of:
- Temperature of wire changes due to heating (resistance increases with temperature)
- Wire not uniform in thickness/material
- Contact resistance at connections
- Measurement errors in length or resistance
Marking: 1 mark for any valid reason.
Section C: Data Analysis and Experimental Design (12 marks)
-
(a) Density = 2.7 g/cm³ (2 s.f.)
Working: Volume of stone = Final volume − Initial volume = 48 cm³ − 30 cm³ = 18 cm³. Density = Mass / Volume = 48.5 g / 18 cm³ = 2.694... g/cm³ ≈ 2.7 g/cm³ (2 s.f.)
Marking: 1 mark for correct volume; 1 mark for correct density to 2 s.f. with unit.(b) Uncertainty = ±0.5 cm³
Explanation: Half the smallest division (1 cm³).
Marking: 1 mark for correct value with unit.(c) Average density = 2.7 g/cm³
Working: (2.7 + 2.8 + 2.6) / 3 = 8.1 / 3 = 2.7 g/cm³
Marking: 1 mark for correct calculation.(d) Percentage error = 0%
Working: % error = |(Experimental − Accepted) / Accepted| × 100% = |(2.7 − 2.7) / 2.7| × 100% = 0%
Marking: 1 mark for correct formula/substitution; 1 mark for correct answer with % sign. -
(a) Hypothesis: "As the angle of the ramp increases, the speed of the toy car at the bottom increases." (Or equivalent testable prediction linking angle and speed.)
Marking: 1 mark for a clear, testable hypothesis mentioning both variables and direction of effect.(b) Independent variable: Angle of ramp
Dependent variable: Speed of toy car at bottom of ramp
Controlled variable: Mass of car / height of ramp / surface of ramp / length of ramp / starting position (any one)
Marking: 1 mark each for correct identification.(c) Apparatus: Metre rule, stopwatch, ramp, protractor, toy car.
Method:- Set up ramp at chosen angle (measure with protractor).
- Mark a fixed distance (e.g., last 50 cm) at the bottom of the ramp.
- Release car from rest at top of ramp.
- Use stopwatch to measure time taken to travel the marked distance at the bottom.
- Speed = Distance / Time.
- Repeat 3 times and average.
Alternative: Use light gates and data logger for more accurate speed measurement.
Marking: 1 mark for apparatus; 1 mark for method (distance/time); 1 mark for repetition/averaging or use of light gates.
(d) Any one of:
- Ensure ramp is stable and won't slip
- Keep fingers away from moving car
- Use a barrier at the end to stop the car safely
- Wear safety goggles if car might fly off
Marking: 1 mark for any valid safety precaution.
-
(a) Graph requirements:
- Axes labelled: "Time / min" (x-axis, 0–12) and "Temperature / °C" (y-axis, 30–85)
- Appropriate scales
- Points for metal container plotted and joined with smooth solid curve
- Points for plastic container plotted and joined with smooth dashed curve
- Key/legend identifying which line is which
Marking: 1 mark for axes and scales; 1 mark for both sets of points plotted correctly; 1 mark for smooth curves with key.
(b) Time ≈ 3.5–4.0 minutes (accept range based on graph reading)
Working: From graph, find time at 70°C (~1.5 min) and 50°C (~5.5 min). Difference = 4.0 min. Or read directly: cooling from 70 to 50 takes about 4 minutes.
Marking: 1 mark for correct reading from graph (accept 3.5–4.5 min).(c) Metal is a good thermal conductor, so heat transfers quickly from the hot water through the container walls to the surroundings. Plastic is a poor thermal conductor (insulator), so heat transfer is slower.
Marking: 1 mark for identifying metal as good conductor/plastic as poor conductor; 1 mark for linking to faster heat loss. -
(a) Corrected diameter = 1.26 cm
Working: Observed reading = Main scale + Vernier scale = 1.2 cm + 0.04 cm = 1.24 cm. Zero error = −0.02 cm (negative zero error means the reading is smaller than true value). Corrected = Observed − Zero error = 1.24 cm − (−0.02 cm) = 1.24 cm + 0.02 cm = 1.26 cm.
Marking: 1 mark for observed reading; 1 mark for correct zero error correction.(b) Volume should be given to 3 significant figures.
Explanation: The diameter is measured to 3 s.f. (1.26 cm). The radius is half the diameter, so also 3 s.f. In the formula V=34πr3, the radius is cubed. For multiplication/powers, the result should have the same number of significant figures as the least precise measurement. Since radius has 3 s.f., volume should be given to 3 s.f. Constants like 34 and π are exact and do not limit significant figures.
Marking: 1 mark for stating 3 s.f.; 1 mark for correct explanation linking to radius cubed and rules for significant figures in multiplication/powers. -
(a) Bubble wrap is the best insulator.
Explanation: It has the smallest temperature drop (15°C) among the insulating materials tested, meaning it reduces heat loss most effectively. (Note: "No insulation" has the largest drop, 30°C.)
Marking: 1 mark for identifying bubble wrap; 1 mark for using data (smallest temperature drop) to justify.(b) The conclusion is not fully supported. While aluminium foil is a metal and metals are generally good thermal conductors, the foil may trap air (a good insulator) if wrapped loosely, or reflect radiant heat back. The experiment only tests one configuration. Also, the foil might be in direct contact with the beaker, conducting heat well. A better conclusion would reference the specific experimental setup.
Marking: 1 mark for evaluating the conclusion (not fully supported/oversimplified); 1 mark for explaining why (trapped air, radiation reflection, contact conduction).(c) Any two of:
- Repeat the experiment multiple times and average the results
- Use a lid on the beakers to reduce heat loss by convection/evaporation
- Ensure the same thickness of each insulating material
- Use a digital thermometer/data logger for more accurate temperature readings
- Control initial temperature more precisely
- Use more beakers per material to account for variations
Marking: 1 mark each for any two valid improvements.
End of Answer Key
Free quiz and exam paper access
Enter your details to view this paper
Your access is remembered on this device.