From Real Exams Quiz
Secondary 2 Mathematics Statistics Probability Quiz
Free Sec 2 Maths Statistics quiz, Nemo3 Exam version, with questions, answers, and syllabus-aligned practice for Singapore students.
These static practice materials are generated from the site's syllabus and paper-generation workflow, with source and model context shown so students and parents can evaluate the material before use.
Questions
Free quiz and exam paper access
Enter your details to view this paper
Your access is remembered on this device.
Answers
Secondary 2 Mathematics Quiz - Statistics Probability (Answer Key)
Total Marks: 40
Section A: Short Answer Questions (Questions 1–10, 2 marks each)
1. [2 marks]
Mean = Σ(fx) / Σf
= (0×3 + 1×7 + 2×8 + 3×6 + 4×4 + 5×2) / 30
= (0 + 7 + 16 + 18 + 16 + 10) / 30
= 67 / 30
= 2.233... ≈ 2.23 books (or 67/30)
Marking:
- 1 mark for correct Σ(fx) = 67
- 1 mark for correct division by 30 and final answer
Common mistake: Forgetting to multiply by frequency, or dividing by 6 (number of categories) instead of 30 (total frequency).
2. [2 marks]
Total marbles = 5 + 3 + 2 = 10
P(not blue) = 1 – P(blue) = 1 – 3/10 = 7/10 or 0.7
Alternative: P(red or green) = (5+2)/10 = 7/10
Marking:
- 1 mark for correct total or P(blue) = 3/10
- 1 mark for correct final answer
3. [2 marks]
Data in order: 152, 154, 156, 158, 160, 161, 163, 165, 167, 169, 172, 174, 176
There are 15 values. Median is the 8th value = 165 cm
Marking:
- 1 mark for identifying 8th position (or correct ordered list)
- 1 mark for correct median = 165 cm
Common mistake: Taking the middle of the stem values instead of counting individual data points.
4. [2 marks]
P(R ∪ C) = P(R) + P(C) – P(R ∩ C)
= 0.3 + 3 + 0.6 – 0.2
= 0.7
Marking:
- 1 mark for correct formula or Venn diagram reasoning
- 1 mark for correct calculation and answer
Teaching note: This is the addition rule for probability. The intersection is subtracted once because it's counted twice when adding P(R) and P(C).
5. [2 marks]
Sample space: {1, 2, 3, 4, 5, 6}
A (even) = {2, 4, 6}
B (prime) = {2, 3, 5}
A ∩ B = {2} ≠ ∅
Answer: No, they are not mutually exclusive because the number 2 is both even and prime, so P(A ∩ B) ≠ 0.
Marking:
- 1 mark for correct identification of sets or intersection
- 1 mark for correct conclusion with justification
Teaching note: Mutually exclusive means the events cannot happen together (intersection is empty). Here, rolling a 2 satisfies both events.
6. [2 marks]
Use midpoints: 2.5, 7.5, 12.5, 17.5, 22.5
Estimated mean = Σ(f × midpoint) / Σf
= (2×2.5 + 5×7.5 + 7×12.5 + 4×17.5 + 2×22.5) / 20
= (5 + 37.5 + 87.5 + 70 + 45) / 20
= 245 / 20
= 12.25 minutes
Marking:
- 1 mark for correct midpoints and Σ(f × midpoint) = 245
- 1 mark for correct division by 20 and final answer
Teaching note: For grouped data, we use class midpoints as estimates. This gives an estimated mean, not the exact mean.
7. [2 marks]
Multiples of 3 from 1 to 8: {3, 6} → 2 favourable outcomes
Total outcomes = 8
P(multiple of 3) = 2/8 = 1/4 or 0.25
Marking:
- 1 mark for identifying favourable outcomes {3, 6}
- 1 mark for correct probability
8. [2 marks]
Count dots: 0 siblings: 5, 1 sibling: 7, 2 siblings: 6, 3 siblings: 4, 4 siblings: 2, 5 siblings: 1
Highest frequency = 7 (for 1 sibling)
Mode = 1 sibling
Marking:
- 1 mark for correct frequency count or identification of tallest column
- 1 mark for correct mode
9. [2 marks]
Use inclusion-exclusion:
n(B ∪ F) = n(B) + n(F) – n(B ∩ F) = 25 + 20 – 10 = 35
n(neither) = 40 – 35 = 5
P(neither) = 5/40 = 1/8 or 0.125
Marking:
- 1 mark for correct number playing neither (5)
- 1 mark for correct probability
Alternative: Venn diagram approach.
10. [2 marks]
From histogram: Frequency = Frequency density × Class width
Class width = 2 kg for all classes.
Mass > 6 kg means classes 6–8 and 8–10.
Frequency (6–8) = 7 × 2 = 14
Frequency (8–10) = 3 × 2 = 6
Total = 14 + 6 = 20 parcels
Marking:
- 1 mark for correct method (frequency = density × width)
- 1 mark for correct total = 20
Teaching note: In histograms with equal class widths, frequency density = frequency / class width. Here class width = 2, so frequency = density × 2.
Section B: Structured Questions (Questions 11–15, 3 marks each)
11. [3 marks]
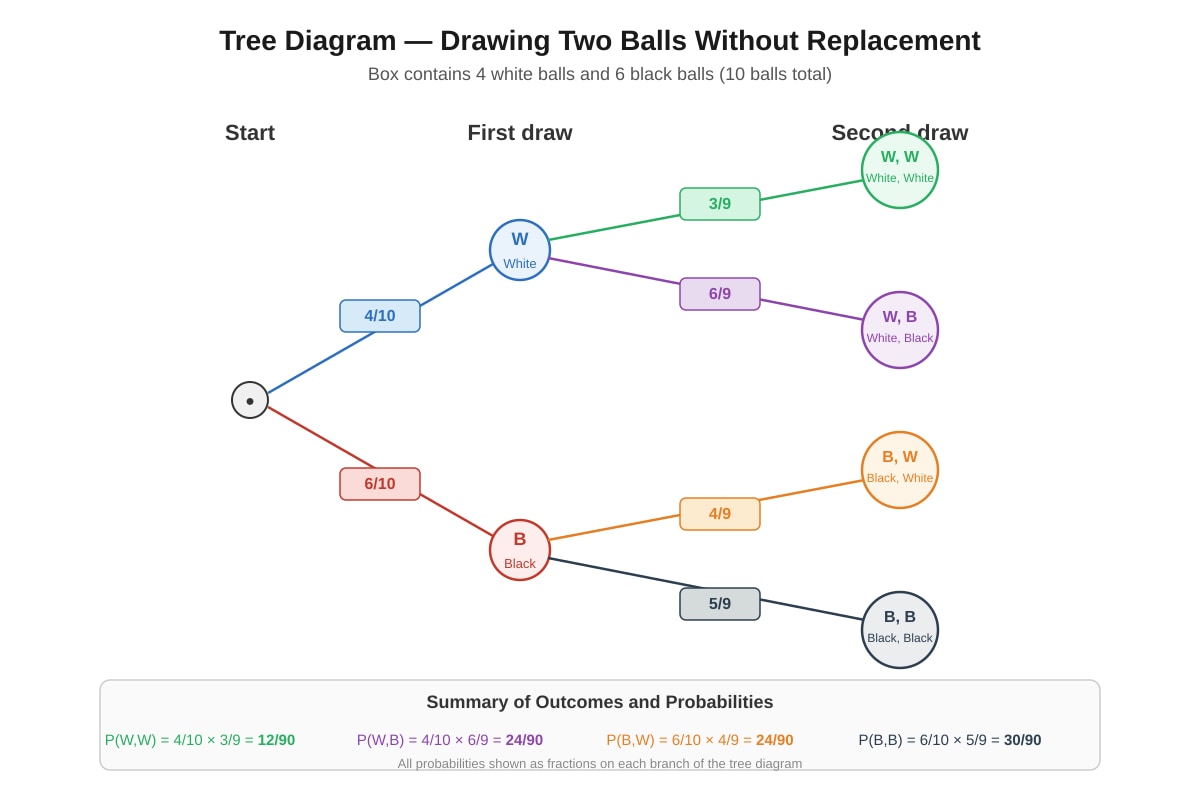
(a) Tree Diagram:
First Draw          Second Draw         Probability
W (4/10)            W (3/9)             4/10 × 3/9 = 12/90
                    B (6/9)             4/10 × 6/9 = 24/90
B (6/10)            W (4/9)             6/10 × 4/9 = 24/90
                    B (5/9)             6/10 × 5/9 = 30/90
(b) P(same colour) = P(WW) + P(BB)
= 12/90 + 30/90
= 42/90
= 7/15
Marking:
- (a) 1 mark for correct first-branch probabilities (4/10, 6/10)
- (a) 1 mark for correct second-branch conditional probabilities
- (b) 1 mark for correct calculation of P(WW) + P(BB) = 7/15
Teaching note: Without replacement means the denominator decreases by 1 for the second draw, and the numerator decreases if the same colour was drawn first.
12. [3 marks]
Reading from cumulative frequency curve (ogive):
(a) Median = value at cumulative frequency 40 (half of 80)
From curve: at CF = 40, marks ≈ 37 (accept 36–38)
(b) Interquartile Range (IQR) = Q3 – Q1
Q1 at CF = 20 → marks ≈ 24 (accept 23–25)
Q3 at CF = 60 → marks ≈ 48 (accept 47–49)
IQR = 48 – 24 = 24 (accept 22–26)
(c) Students scoring > 55 marks:
At marks = 55, CF ≈ 74 (from curve)
Number > 55 = 80 – 74 = 6 students (accept 5–7)
Marking:
- (a) 1 mark for correct reading at CF = 40
- (b) 1 mark for correct Q1 and Q3 readings, 1 mark for correct IQR
- (c) 1 mark for correct method (80 – CF at 55) and answer
Teaching note: Always read from the cumulative frequency axis to the curve, then down to the marks axis. IQR measures spread of middle 50% of data.
13. [3 marks]
(a) P(A ∪ B) = P(A) + P(B) – P(A ∩ B)
0.7 = 0.4 + 0.5 – P(A ∩ B)
P(A ∩ B) = 0.9 – 0.7 = 0.2
(b) For independence: P(A ∩ B) = P(A) × P(B)
P(A) × P(B) = 0.4 × 0.5 = 0.2
Since P(A ∩ B) = 0.2 = P(A) × P(B), A and B are independent.
**(c) P(A | B) = P(A ∩ B) / P(B) = 0.2 / 0.5 = 0.4
Marking:
- (a) 1 mark for correct formula and answer 0.2
- (b) 1 mark for checking P(A)×P(B), 1 mark for correct conclusion with justification
- (c) 1 mark for correct formula and answer 0.4
Teaching note: Independence means knowing B occurred doesn't change the probability of A. Here P(A|B) = 0.4 = P(A), confirming independence.
14. [3 marks]
(a) Modal class = class with highest frequency = 15–20 (frequency 15)
(b) Estimated mean:
Midpoints: 7.5, 12.5, 17.5, 22.5, 27.5
Σ(fx) = 8×7.5 + 12×12.5 + 15×17.5 + 10×22.5 + 5×27.5
= 60 + 150 + 262.5 + 225 + 137.5 = 835
Mean = 835 / 50 = $16.70
**(c) P(> $20) = (10 + 5) / 50 = 15/50 = 3/10 or 0.3
Marking:
- (a) 1 mark for correct modal class
- (b) 1 mark for correct midpoints and Σ(fx) = 835, 1 mark for correct mean
- (c) 1 mark for correct probability
15. [3 marks]
(a) Sample space (8 outcomes):
HHH, HHT, HTH, HTT, THH, THT, TTH, TTT
(b) Exactly 2 heads: HHT, HTH, THH → 3 outcomes
P(exactly 2 heads) = 3/8
(c) At least 1 tail: Complement of no tails (HHH)
P(at least 1 tail) = 1 – P(HHH) = 1 – 1/8 = 7/8
Marking:
- (a) 1 mark for complete correct list (order matters)
- (b) 1 mark for correct favourable outcomes and probability
- (c) 1 mark for correct method (complement or listing) and answer
Teaching note: For "at least one" questions, using the complement (1 – P(none)) is often faster than listing all cases.
Section C: Application Questions (Questions 16–20, 4 marks each)
16. [4 marks]
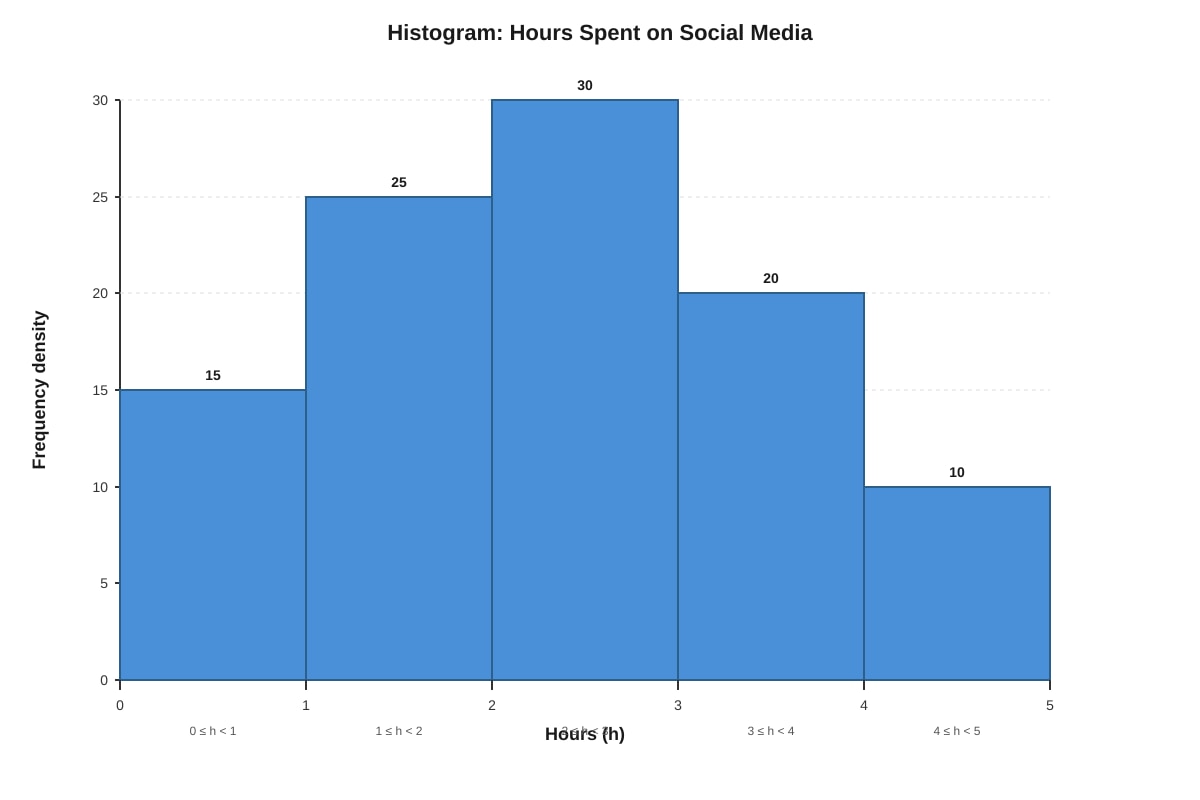
(a) Histogram:
Class widths all = 1 hour, so frequency density = frequency.
Bars: 0–1 (height 15), 1–2 (height 25), 2–3 (height 30), 3–4 (height 20), 4–5 (height 10)
(b) Estimated mean:
Midpoints: 0.5, 1.5, 2.5, 3.5, 4.5
Σ(fx) = 15×0.5 + 25×1.5 + 30×2.5 + 20×3.5 + 10×4.5
= 7.5 + 37.5 + 75 + 70 + 45 = 235
Mean = 235 / 100 = 2.35 hours
(c) Conditional probability:
Given: spends ≥ 2 hours → students in classes 2–3, 3–4, 4–5
Total = 30 + 20 + 10 = 60 students
Favourable: spends < 4 hours (i.e., 2–3 or 3–4) = 30 + 20 = 50 students
P(< 4 | ≥ 2) = 50/60 = 5/6 ≈ 0.833
Marking:
- (a) 1 mark for correct histogram (bars with correct heights, labelled axes)
- (b) 1 mark for correct midpoints and Σ(fx) = 235, 1 mark for correct mean
- (c) 1 mark for correct conditional probability method and answer 5/6
Teaching note: Conditional probability P(A|B) = P(A∩B)/P(B). Here "given ≥ 2 hours" restricts the sample space to 60 students.
17. [4 marks]
Numbers 1–10. Multiples of 2: {2,4,6,8,10}. Multiples of 3: {3,6,9}.
Union (2 or 3): {2,3,4,6,8,9,10} → 7 numbers.
**(a) P(win) = 7/10 = 0.7
(b) Two spins, win exactly once:
P(W) = 0.7, P(L) = 0.3
P(exactly 1 win) = P(WL) + P(LW) = 0.7×0.3 + 0.3×0.7 = 0.42
**(c) Expected winners = 50 × P(win) = 50 × 0.7 = 35
Marking:
- (a) 1 mark for correct favourable outcomes (7) and probability
- (b) 1 mark for identifying binomial situation, 1 mark for correct calculation 0.42
- (c) 1 mark for correct expected value calculation
Teaching note: "Exactly once in two trials" is a binomial probability: 2 × p × (1-p). Expected value = n × p.
18. [4 marks]
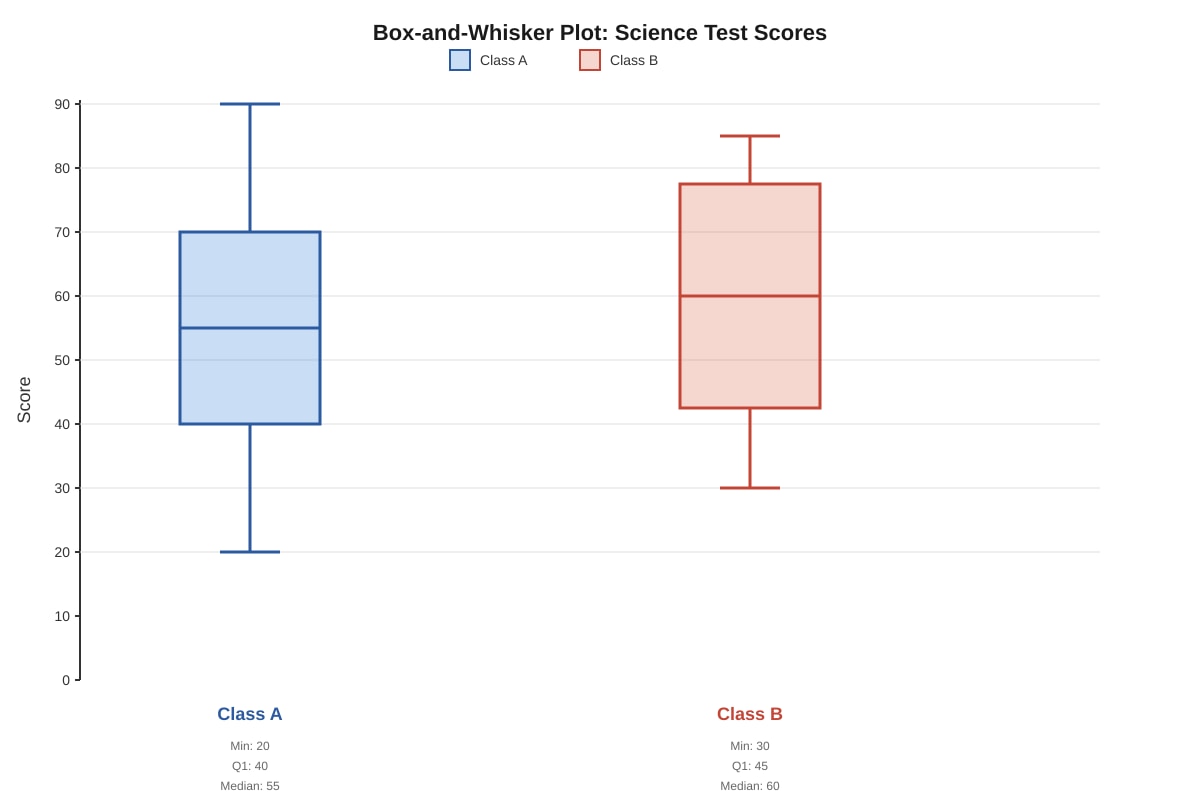
(a) Comparison (any two valid points):
- Class B has a higher median (60 vs 55), indicating better central performance.
- Class B has a smaller range (85–30=55 vs 90–20=70) and smaller IQR (75–45=30 vs 70–40=30 — actually same IQR here, but range differs), so Class B's scores are less spread out / more consistent.
- Class A has a lower minimum (20 vs 30), indicating at least one very low score.
**(b) Class A: Median = 55, Q3 = 70.
Students above median = 50% of class.
Students above 70 = 25% of class (above Q3).
P(>70 | >55) = 25% / 50% = 1/2 or 0.5
(c) The box-and-whisker plot only shows the five-number summary (min, Q1, median, Q3, max). It does not show individual data values or frequencies within each quartile, so the mean (which requires all data values) cannot be calculated.
Marking:
- (a) 2 marks for any two correct comparisons with statistical measures (1 mark each)
- (b) 1 mark for correct reasoning (25%/50%) and answer 0.5
- (c) 1 mark for correct explanation
Teaching note: Box plots show distribution shape and spread but lose information about individual data points. Mean requires sum of all values.
19. [4 marks]
Total balls = 12. Draw 3 without replacement.
Total ways = ¹²C₃ = 220
(a) All different colours: Choose 1 red, 1 blue, 1 green
Ways = ³C₁ × ⁴C₁ × ⁵C₁ = 3 × 4 × 5 = 60
P(all different) = 60/220 = 3/11
(b) At least two same colour = complement of all different
P(at least 2 same) = 1 – P(all different) = 1 – 3/11 = 8/11
Alternative for (b): Direct count:
- 2 same, 1 different: (³C₂×⁴C₁ + ³C₂×⁵C₁ + ⁴C₂׳C₁ + ⁴C₂×⁵C₁ + ⁵C₂׳C₁ + ⁵C₂×⁴C₁) = (3×4 + 3×5 + 6×3 + 6×5 + 10×3 + 10×4) = 12+15+18+30+30+40 = 145
- 3 same: ³C₃ + ⁴C₃ + ⁵C₃ = 1 + 4 + 10 = 15
Total = 145 + 15 = 160 → 160/220 = 8/11 ✓
Marking:
- (a) 2 marks for correct combination method and answer 3/11 (1 mark for method, 1 for answer)
- (b) 1 mark for correct complement method or direct count, 1 mark for answer 8/11
Teaching note: "At least" questions are often easier using the complement. Combinations (nCr) are used because order of drawing doesn't matter for the final set of balls.
20. [4 marks]
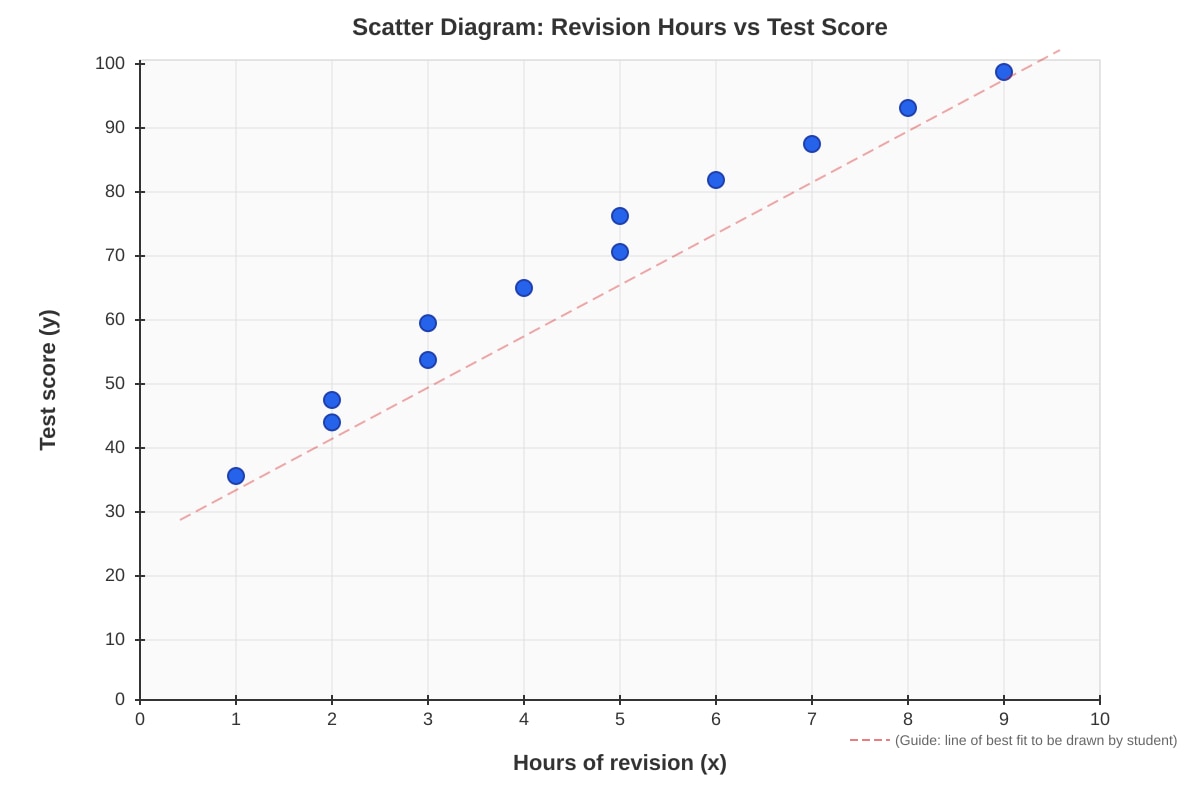
(a) Positive correlation. As hours of revision increase, test scores tend to increase. The points lie close to a straight line, indicating a strong positive linear correlation.
(b) Line of best fit: Should pass through the mean point (x̄, ȳ) and follow the trend of the points.
Mean x = (1+2+2+3+3+4+5+5+6+7+8+9)/12 = 55/12 ≈ 4.58
Mean y = (35+42+45+50+55+60+65+70+75+80+85+90)/12 = 752/12 ≈ 62.67
Line should pass near (4.58, 62.67) with positive gradient.
(c) Using line of best fit: At x = 4.5, estimated y ≈ 63–65 (accept reasonable estimate from drawn line)
(d) Extrapolation: 12 hours is outside the range of the data (max x = 9). The linear trend may not continue beyond the observed data. The relationship might curve, plateau, or change, so estimates outside the data range are unreliable.
Marking:
- (a) 1 mark for "positive correlation", 1 mark for "strong" or "linear" description
- (b) 1 mark for line drawn reasonably through points, passing near mean point
- (c) 1 mark for reasonable estimate from their line
- (d) 1 mark for mentioning extrapolation / outside data range / trend may not continue
Teaching note: Interpolation (within data range) is reliable; extrapolation (outside data range) is not. The line of best fit models the observed trend only.
End of Answer Key