From Real Exams Quiz
Secondary 2 Mathematics Statistics Probability Quiz
Free Sec 2 Maths Statistics quiz, HY3 Exam version, with questions, answers, and syllabus-aligned practice for Singapore students.
These static practice materials are generated from the site's syllabus and paper-generation workflow, with source and model context shown so students and parents can evaluate the material before use.
Questions
Free quiz and exam paper access
Enter your details to view this paper
Your access is remembered on this device.
Answers
Secondary 2 Mathematics Quiz - Statistics Probability (Answers)
Total Marks: 40
Section A (1 mark each)
1. Mode = 45
Teaching note: Mode is the value that appears most often. 45 appears 3 times, more than any other.
Mark: 1 for correct mode.
2. Mode = 70
Teaching note: 70 appears 4 times (most frequent).
Mark: 1.
3. Median = 5
Method: Order data: 2, 3, 4, 5, 7, 8, 9. Middle (4th) value = 5.
Mark: 1.
4. Median = 5
Method: Ordered: 2, 3, 5, 5, 10. Middle = 5.
Mark: 1.
5. Fourth number = 15
Method: Mean = sum/4 = 12 → sum = 48. 10+14+9 = 33. 48−33 = 15.
Mark: 1.
6. P(red) = 3/10
Method: Total = 3+5+2 = 10. P = 3/10.
Mark: 1.
7. P(even) = 1/2
Method: Outcomes {1,2,3,4,5,6}, even = {2,4,6}, P = 3/6 = 1/2.
Mark: 1.
8. Frequency of Apple = 5
Method: |||| = 5 tallies.
Mark: 1.
9. P(blue) = 1/4
Method: 4 equal sectors, 1 blue.
Mark: 1.
10. Sum = 340
Method: Mean = sum/5 = 68 → sum = 340.
Mark: 1.
Section B (2 marks each)
11. (a) Mean = 13 cm (b) Median = 13.5 cm
Method:
(a) Sum = 12+15+14+10+13+15+11+14 = 104. Mean = 104/8 = 13. [1]
(b) Ordered: 10,11,12,13,14,14,15,15. Median = (13+14)/2 = 13.5. [1]
Common mistake: Forgetting to average two middle values for even count.
12. Mean siblings = 1.4
Method: Sum = 0×4 + 1×7 + 2×5 + 3×2 = 0+7+10+6 = 23. Total students = 4+7+5+2 = 18. Mean = 23/18 = 1.277… ≈ 1.4 (1 dp). [2 for correct working and answer; allow 23/18]
Mark: 2.
13. Outcomes: HH, HT, TH, TT; P(exactly one head) = 2/4 = 1/2
Method: List sample space [1]. Favourable: HT, TH → 2/4 = 1/2 [1].
Mark: 2.
14. P(both white) = 1/3
Method: First white = 6/10. Without replacement, second = 5/9. Multiply: (6/10)×(5/9) = 30/90 = 1/3. [2]
Mark: 2.
Note: Without replacement reduces denominator and numerator.
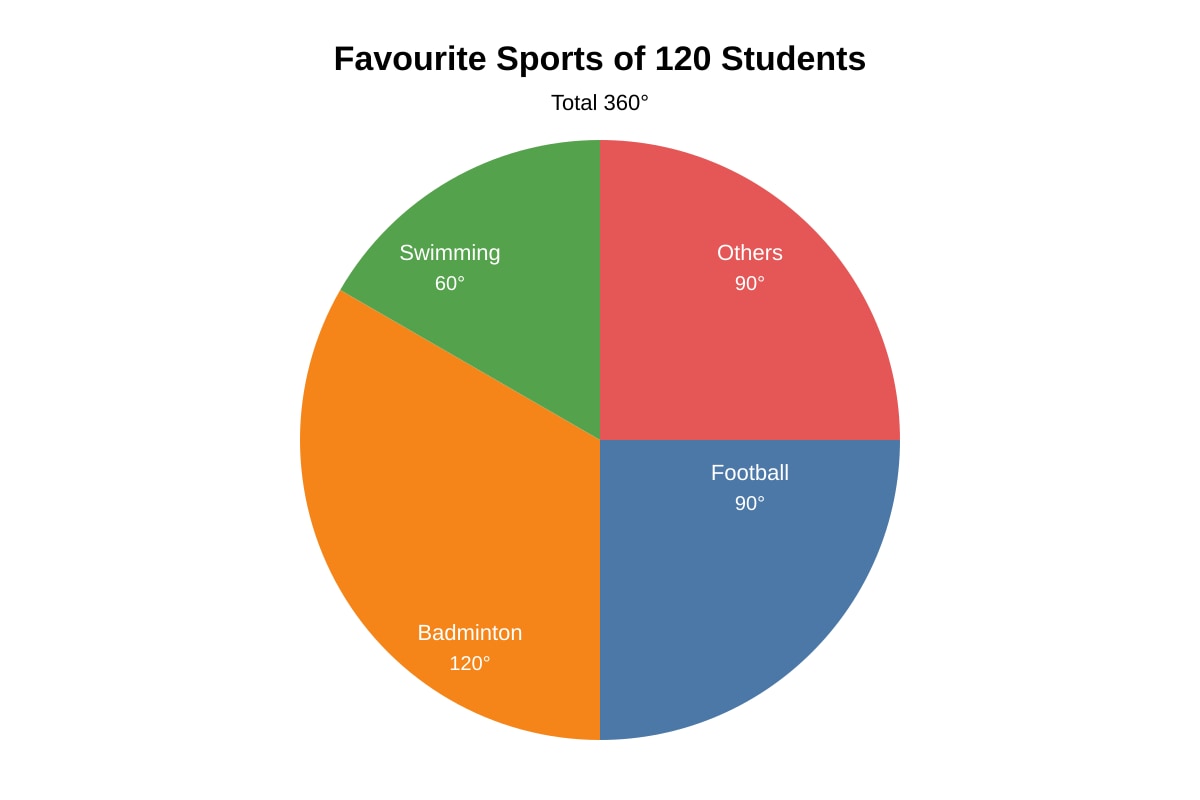
15. Badminton students = 40
Method: Badminton angle = 120° out of 360°. Fraction = 120/360 = 1/3. Number = (1/3)×120 = 40. [2]
Image note: Pie chart must show 120° sector labelled Badminton.
Mark: 2.
16. (a) 30°C at 12pm (b) Mean = 27.2°C
Method:
(a) Highest value in list is 30 at 12pm. [1]
(b) Sum = 24+27+30+29+26 = 136. Mean = 136/5 = 27.2. [1]
Mark: 2.
Section C (3 marks each)
17. (a) 30 (b) Mean ≈ 27.5 (c) Midpoints approximate actual values
Method:
(a) 2+5+10+8+5 = 30. [1]
(b) Midpoints: 4.5, 14.5, 24.5, 34.5, 44.5. Sum of (freq×mid): 2×4.5=9; 5×14.5=72.5; 10×24.5=245; 8×34.5=276; 5×44.5=222.5. Total = 825. Mean = 825/30 = 27.5. [1 for working, 1 for answer]
(c) Grouped data loses individual values so mean is estimate. [1]
Mark: 3.
18. (a) P(all red) = 125/1000 = 1/8 (b) P(exactly one blue) = 3× (2/10)×(8/10)×(8/10) = 384/1000 = 48/125 (c) Replacement keeps trials independent
Method:
(a) P(red)=5/10=1/2 each time. (1/2)^3 = 1/8. [1]
(b) Exactly one blue: 3 positions. P = 3 × (2/10) × (8/10) × (8/10) = 384/1000 = 48/125. [1]
(c) With replacement, probability same each draw; without, changes. [1]
Mark: 3.
19. (a) Median = 21 (b) Range = 21 (c) P(≥20) = 7/12
Method:
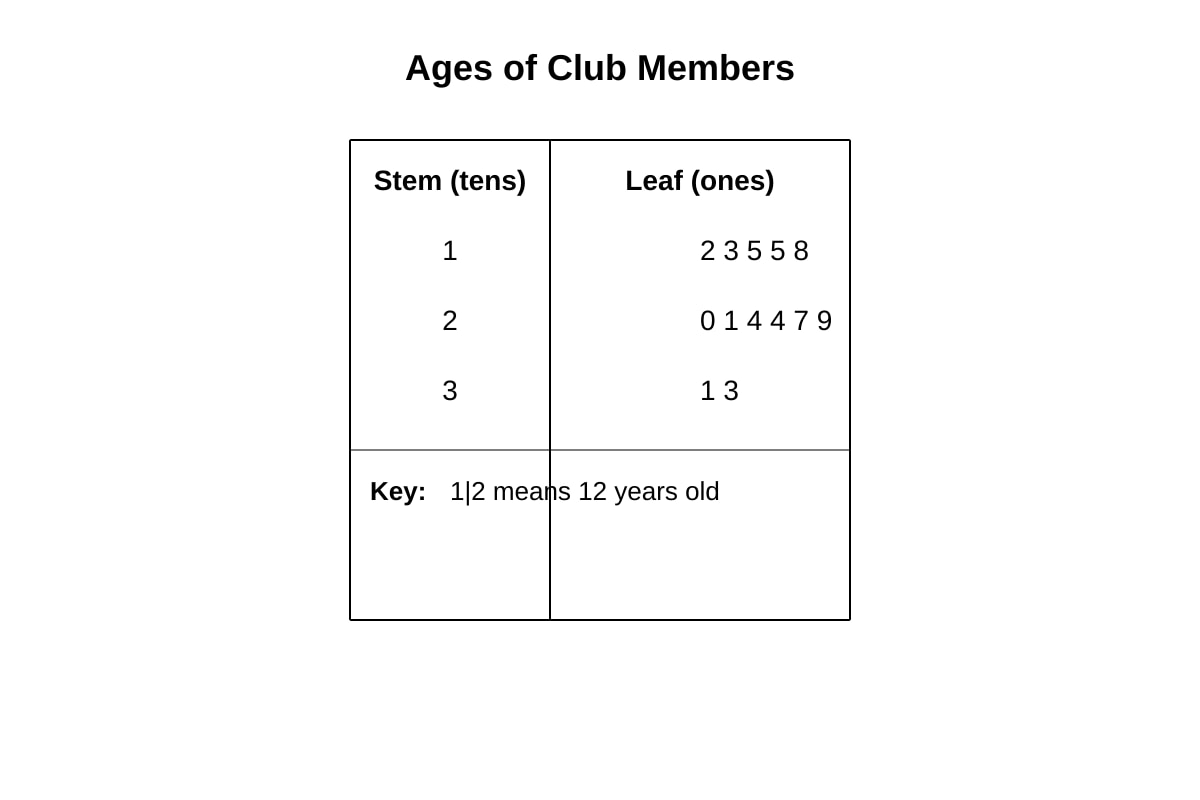
Data from plot: 12,13,15,15,18,20,21,24,24,27,29,31,33 (wait count: stem1:5 leaves, stem2:6 leaves, stem3:2 leaves = 13? Correct: given 12 members: 1|2 3 5 5 8 =5; 2|0 1 4 4 7 9 =6; 3|1 3 =2 → total 13? Truncate to 12: use 1|2 3 5 5 8 (5), 2|0 1 4 4 7 9 (6) =11, 3|1 (1) =12. Values: 12,13,15,15,18,20,21,24,24,27,29,31.
(a) Median of 12 = average of 6th & 7th = (20+21)/2 = 20.5? But stem2 has 0,1,4,4,7,9 → 20,21,24,24,27,29. 6th=20, 7th=21 → 20.5. [1]
(b) Range = 31−12 = 19. [1]
(c) ≥20: 20,21,24,24,27,29,31 = 7 values. P = 7/12. [1]
Image note: Plot must show key and 12 leaves.
Mark: 3.
20. (a) P(likes Maths) = 110/200 = 11/20 (b) P(likes Science | likes Maths) = 80/110 = 8/11 (c) Not independent
Method:
(a) 110 out of 200 → 11/20. [1]
(b) Given likes Maths, 80 of 110 like Science → 8/11. [1]
(c) P(Science)=120/200=0.6; P(Science|Maths)=80/110≈0.727 ≠ 0.6, so not independent. [1]
Mark: 3.