AI Generated Quiz
Secondary 2 Geography Resources Sustainability Quiz
Free Sec 2 Geography Resources Sustainability quiz, HY3 AI version, with questions, answers, and syllabus-aligned practice for Singapore students.
These static practice materials are generated from the site's syllabus and paper-generation workflow, with source and model context shown so students and parents can evaluate the material before use.
Questions
Free quiz and exam paper access
Enter your details to view this paper
Your access is remembered on this device.
Answers
Secondary 2 Geography Quiz - Resources Sustainability (Answer Key)
Total Marks: 40
Topic: Resources Sustainability
Note: Syllabus-first content from LLM-inferred templates; not past-year derived.
Section A Answers
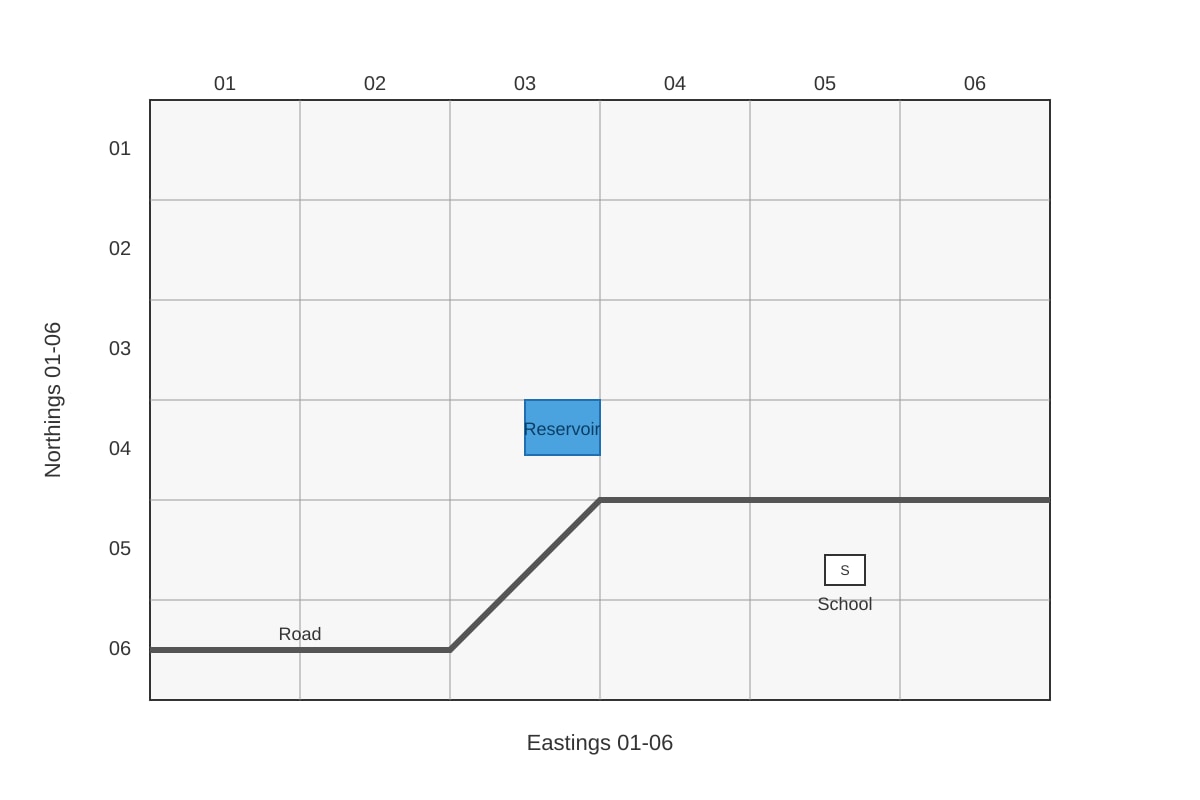
Q1 [1 mark]
Answer: 0304 (or 0340 if using easting-northing as 03 easting, 04 northing → four-figure 0304).
Teaching note: Four-figure grid reference is read as easting first (horizontal, left-to-right), then northing (vertical, bottom-to-top). The reservoir is in square easting 03–04, northing 04–05, so reference is 0304. Common mistake: reversing to northing-first (0403).
Q2 [2 marks]
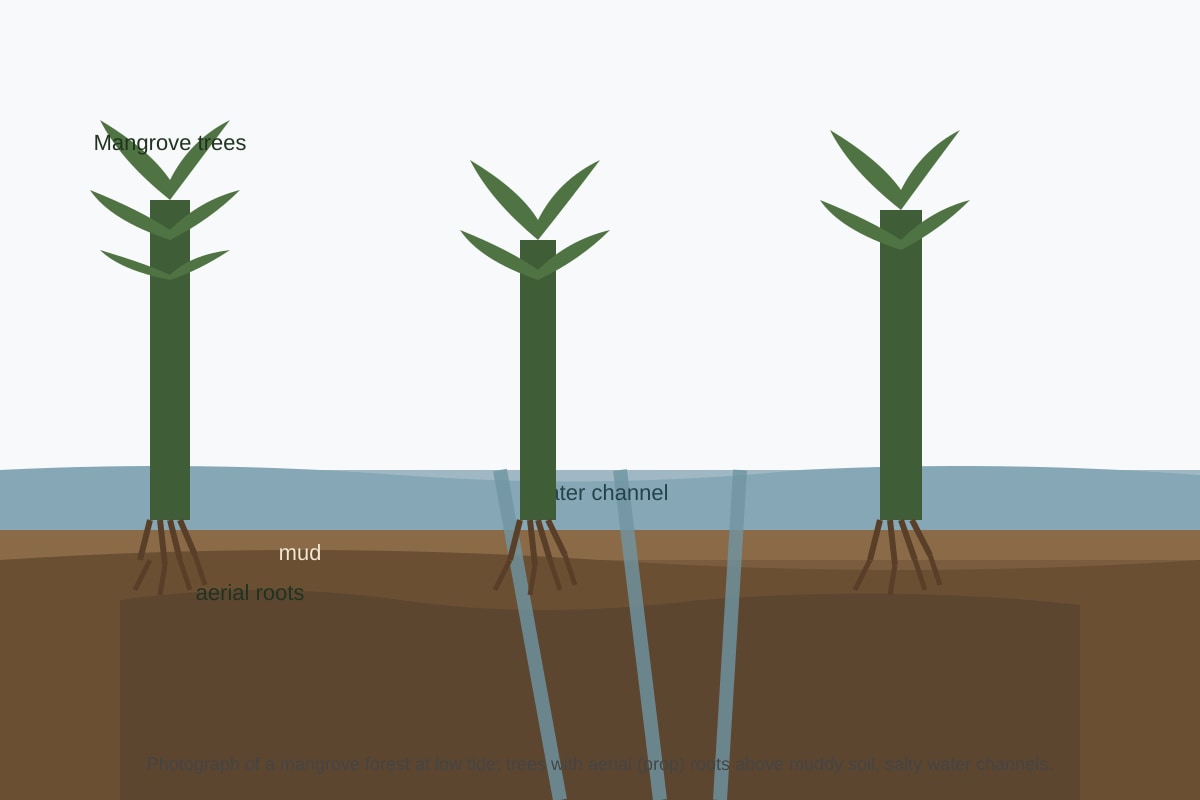
(a) [1] Mangrove forest (or mangroves).
(b) [1] Aerial roots (prop roots) that support tree in soft mud and allow gas exchange.
Teaching note: Mangroves are coastal ecosystems; aerial roots are a visible adaptation to waterlogged, low-oxygen soil.
Q3 [3 marks]
Working: February rainfall = 80 mm, evapotranspiration = 100 mm.
Water balance = Rainfall − Evapotranspiration = 80 − 100 = −20 mm.
Answer: Deficit of 20 mm. This means more water is lost than gained, so storage in reservoirs/soil drops; could lead to water shortage if repeated.
Mark breakdown: 1 for correct subtraction, 1 for deficit sign/label, 1 for interpretation.
Q4 [2 marks]
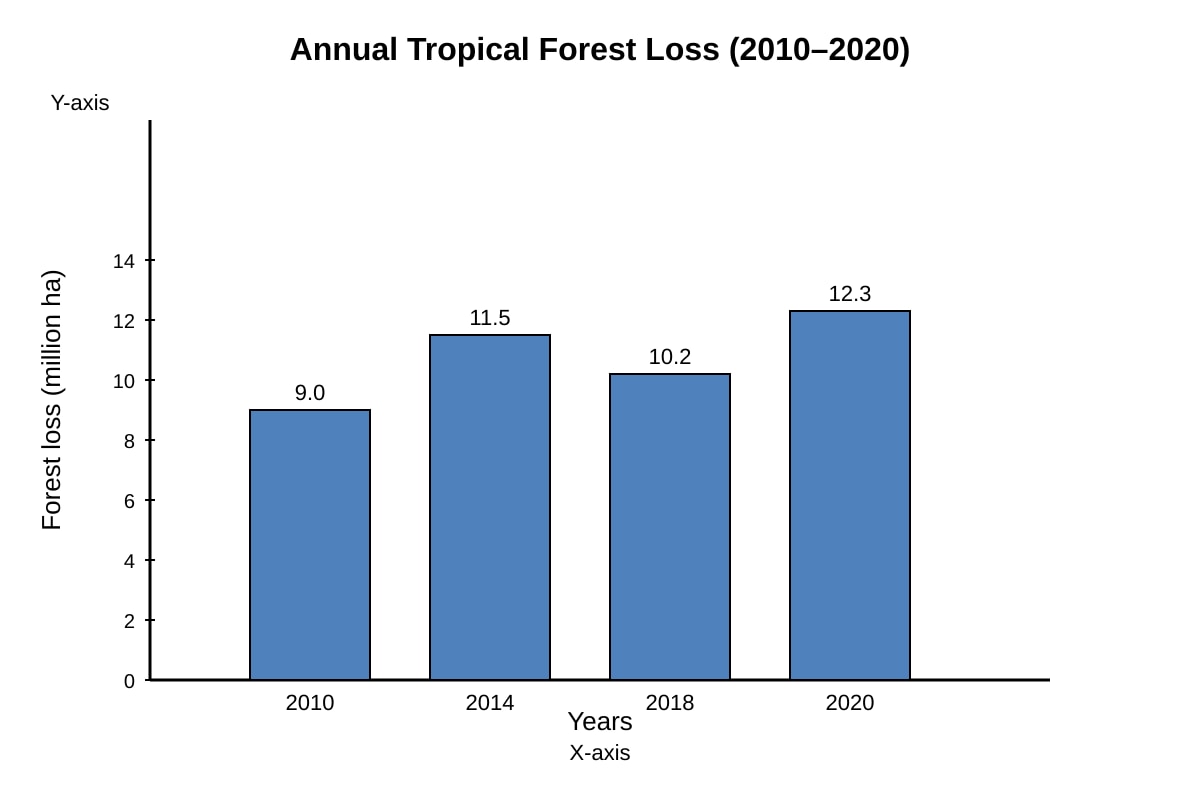
Answer: Tropical forest loss generally increased from 9.0 million ha in 2010 to 12.3 million ha in 2020, with a dip in 2018 (10.2) then rise. Overall upward trend.
Teaching note: Use data points; describe overall trend and mention anomaly.
Q5 [1 mark]
Answer: D) River water from Malaysia.
Teaching note: Four National Taps: local catchment, imported water, NEWater, desalination. Imported water is from Johor, not “river water from Malaysia” as a separate tap.
Q6 [2 marks]
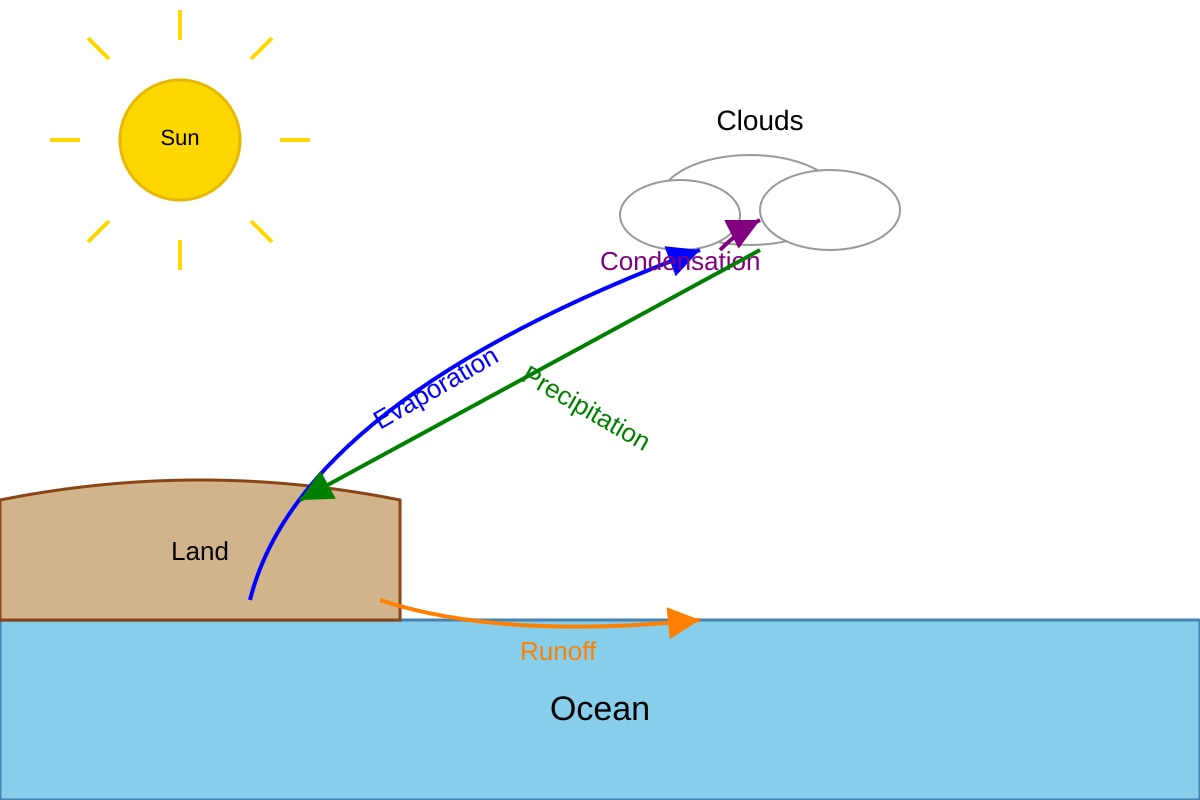
(1) Evaporation (2) Transpiration (if shown) or condensation returns vapour to clouds but not atmosphere directly; correct from diagram: Evaporation and Transpiration (if present). In given diagram: Evaporation only labelled; also condensation is atmosphere process. Accept: Evaporation and (any other atmospheric return like evapotranspiration). Per diagram: Evaporation and (if arrow from land to air) transpiration. Mark: 1 each.
Teaching note: Processes returning water to atmosphere: evaporation (ocean/land), transpiration (plants).
Q7 [3 marks]
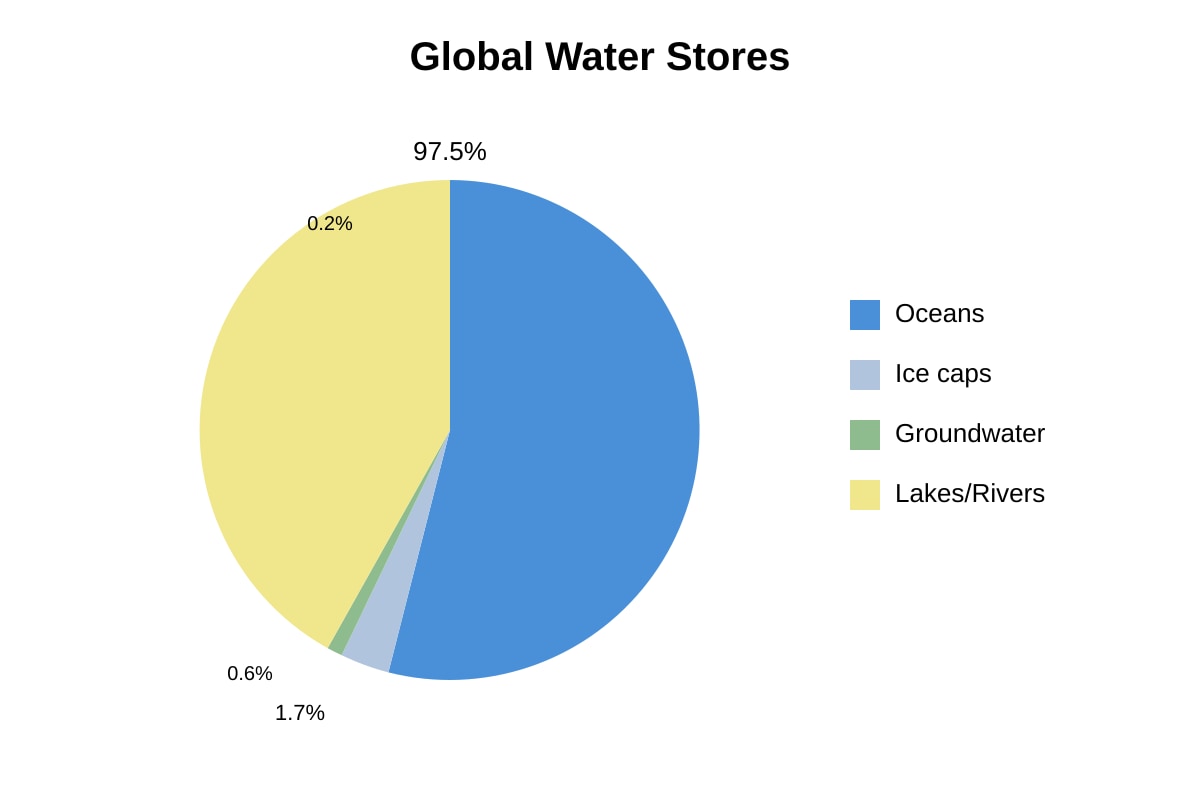
(a) [1] 0.2% + 0.6% = 0.8% (usable freshwater stores).
(b) [2] Most water is salty ocean (97.5%) or locked in ice (1.7%); only 0.8% is accessible freshwater, and much is unevenly distributed or polluted, causing scarcity.
Marking: 1 for sum, 2 for explanation with reference to percentages.
Q8 [2 marks]
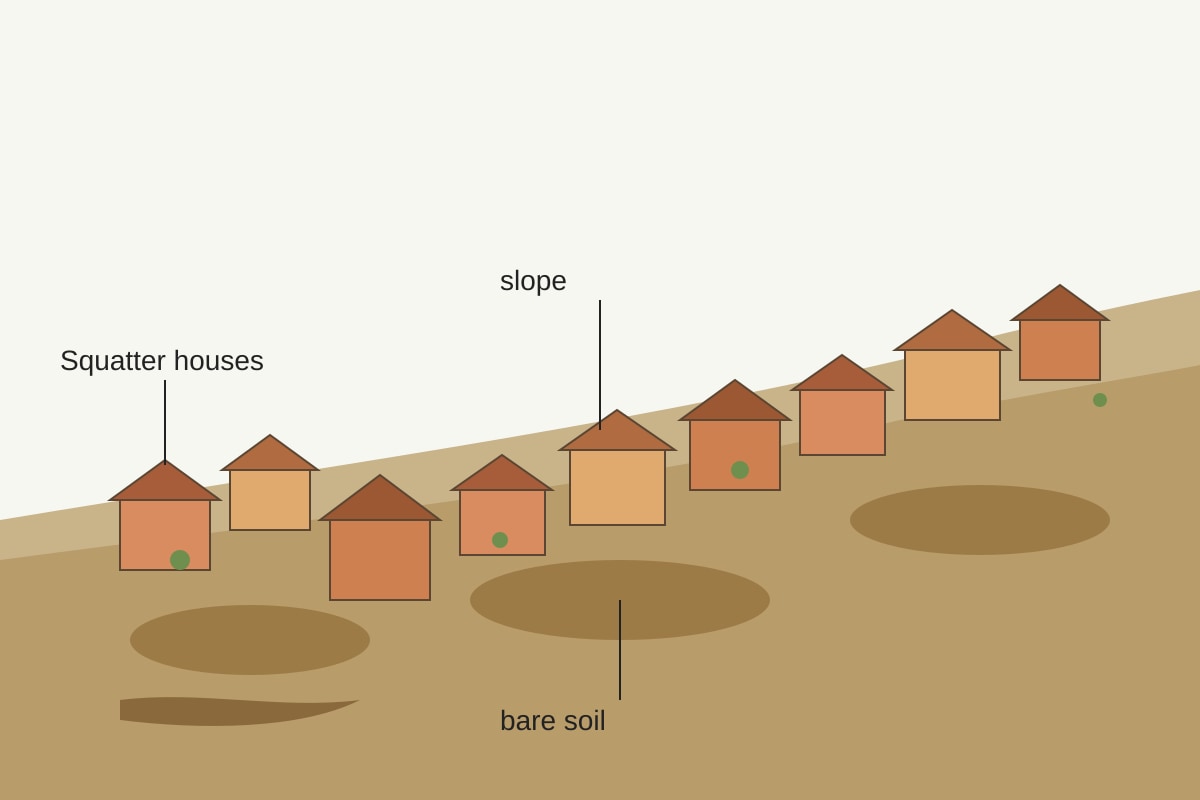
Answer: Soil erosion / landslides due to removal of vegetation on slope; or pollution from lack of sanitation.
Teaching note: Informal housing often clears vegetation, exposing soil to rain, causing erosion.
Section B Answers
Q9 [3 marks]
Answer: Evaporation from oceans/heated by sun forms water vapour → cools, condenses into clouds → precipitates over Singapore’s catchment → fills reservoirs (local tap). Without evaporation, no rain, no catchment supply.
Marking: 1 process, 1 link to catchment, 1 importance.
Q10 [3 marks]
(1) Aerial roots: allow oxygen intake in waterlogged soil. (2) Salt-secreting leaves: remove excess salt.
Marking: 1 adaptation + 1 explanation each = 3 total (1+1, 1+1, but capped at 3; allocate 1.5 each).
Q11 [4 marks]
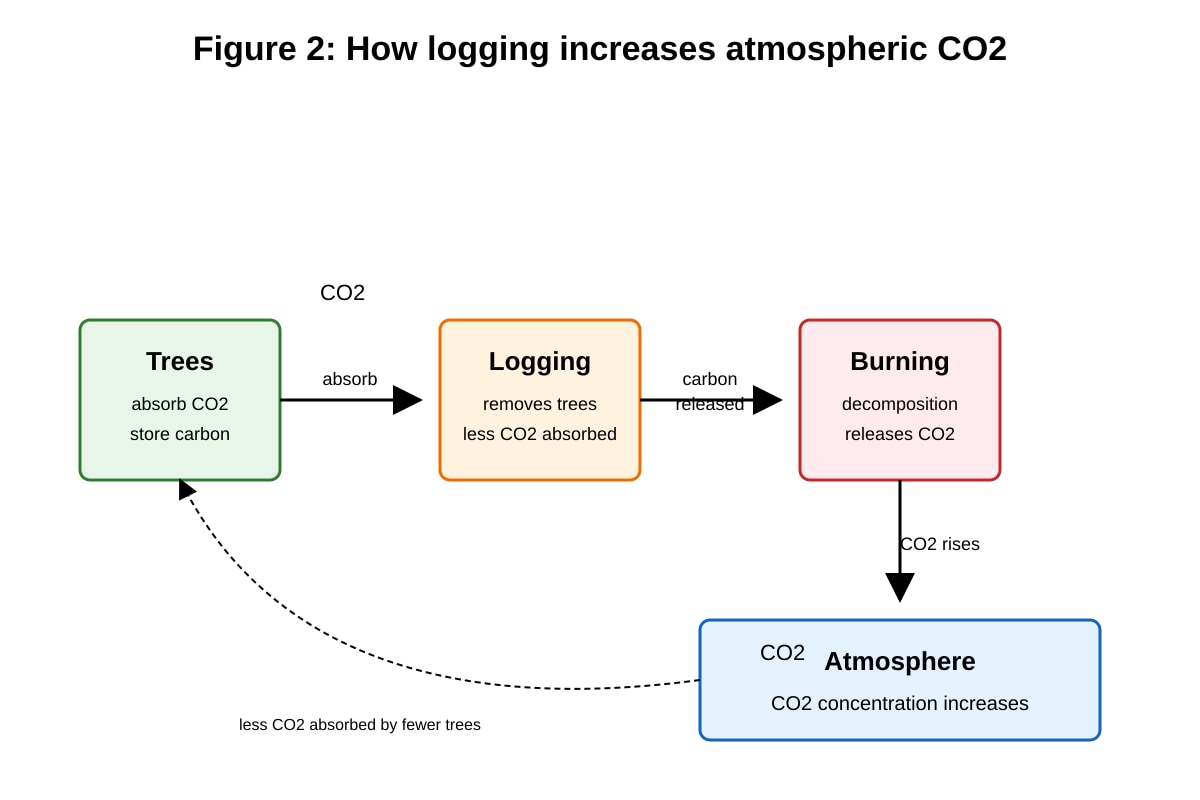
Chain: Trees absorb CO2 → logging stops absorption and releases stored carbon via burning/decomp → less CO2 taken up → atmospheric CO2 rises → enhanced greenhouse effect.
Marking: 1 each step (max 4). Teaching: Deforestation reduces carbon sink, increases GHG.
Q12 [3 marks]
Desalination removes salt from seawater using reverse osmosis/membranes. It provides weather-independent supply, reducing reliance on rain/imports → sustainable.
Marking: 1 process, 1 independence, 1 sustainability link.
Q13 [2 marks]
(1) Store carbon (reduce warming) (2) Produce oxygen / regulate rainfall.
1 mark each.
Q14 [3 marks]
Proper housing reduces illegal clearing, sanitation prevents river pollution, improves health and reduces environmental degradation.
Marking: 1 each for housing, sanitation, overall sustainability.
Q15 [3 marks]
Less demand on supply, delays reservoir depletion, lowers energy for treatment, frees water for ecosystems.
Marking: 1 each for demand, storage, environment.
Section C Answers
Q16 [3 marks]
Mangrove loss → less nursery habitat for fish → fewer adult fish → lower catches. Also, farm pollution reduces water quality.
Marking: 1 link habitat, 1 fish decline, 1 fisher impact.
Q17 [4 marks]
(a) [2] City B: lower rainfall (200 vs 500), higher pop (5 vs 2) → more stress.
(b) [2] Desalination supplies 40% from sea, offsetting low rain, ensures supply.
Marking: 2 + 2.
Q18 [4 marks]
Effective: restores habitat, absorbs CO2, prevents erosion. Limited: takes time, may not match original biodiversity. Evaluate both.
Marking: 2 for two points, 2 for evaluation.
Q19 [3 marks]
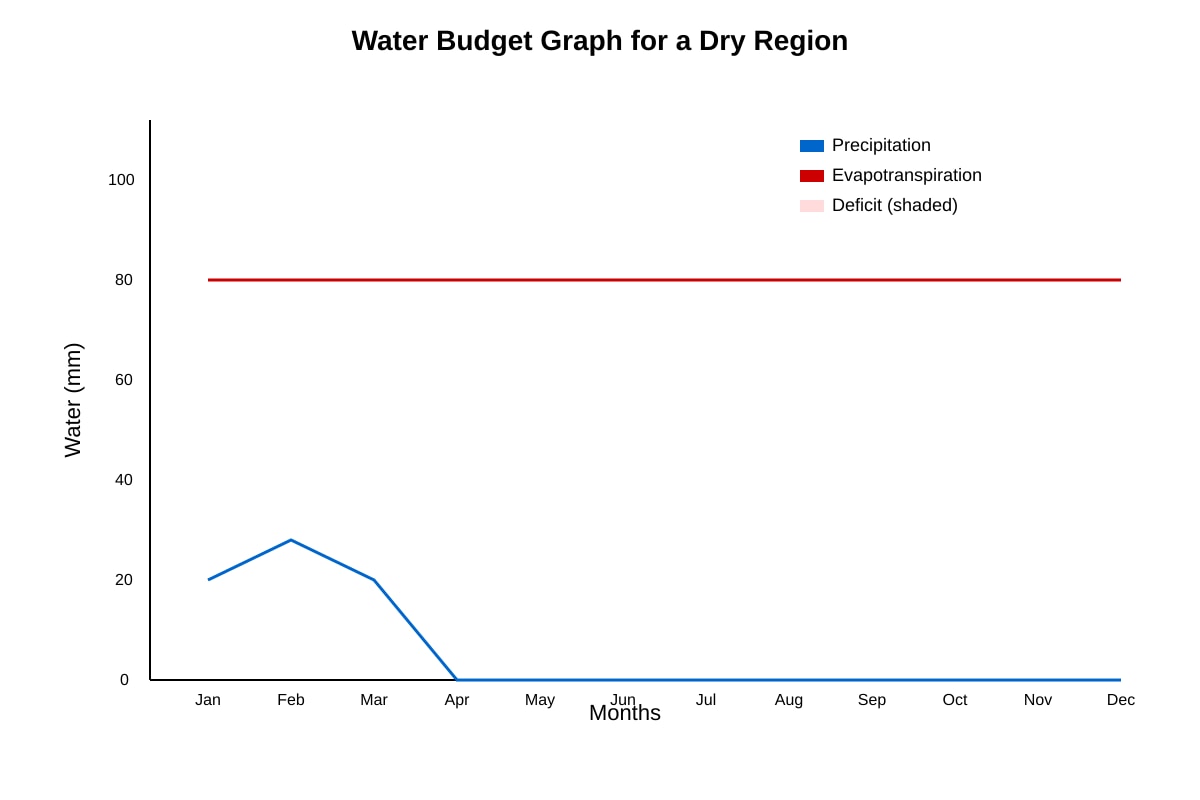
Problem: Long deficit (8 months) → drought risk. Strategy: Build reservoirs / import / desalinate.
Marking: 1 describe, 2 strategy.
Q20 [4 marks]
Agree: Tech (NEWater, desalination) + behaviour (less use, protect forests). Examples show combined need.
Marking: 1 stance, 1 water eg, 1 forest eg, 1 synthesis.