AI Generated Quiz
Secondary 2 Geography Map Graph Data Skills Quiz
Free Sec 2 Geography Map Graph Data Skills quiz, HY3 AI version, with questions, answers, and syllabus-aligned practice for Singapore students.
These static practice materials are generated from the site's syllabus and paper-generation workflow, with source and model context shown so students and parents can evaluate the material before use.
Questions
Secondary 2 Geography Quiz - Map Graph Data Skills
Name: ___________________________
Class: ______________
Date: ______________
Score: _______ / 40
Duration: 50 minutes
Total Marks: 40
Instructions:
- This quiz has 20 questions across three sections.
- Answer all questions in the spaces provided.
- For map and graph questions, read the labels and axes carefully.
- Use geographical terms where possible.
- Section A: 10 short data/map questions (1 mark each). Section B: 6 structured questions (2–3 marks each). Section C: 4 extended data questions (3–5 marks each).
Section A: Map & Basic Data Skills (Questions 1–10, 1 mark each)
1. On a map with grid lines numbered 10–20 eastings and 30–40 northings, a school is located between easting 12 and 13, and northing 34 and 35. State its four-figure grid reference.
2. A six-figure grid reference is 184 372. What is the easting value to the nearest full grid line?
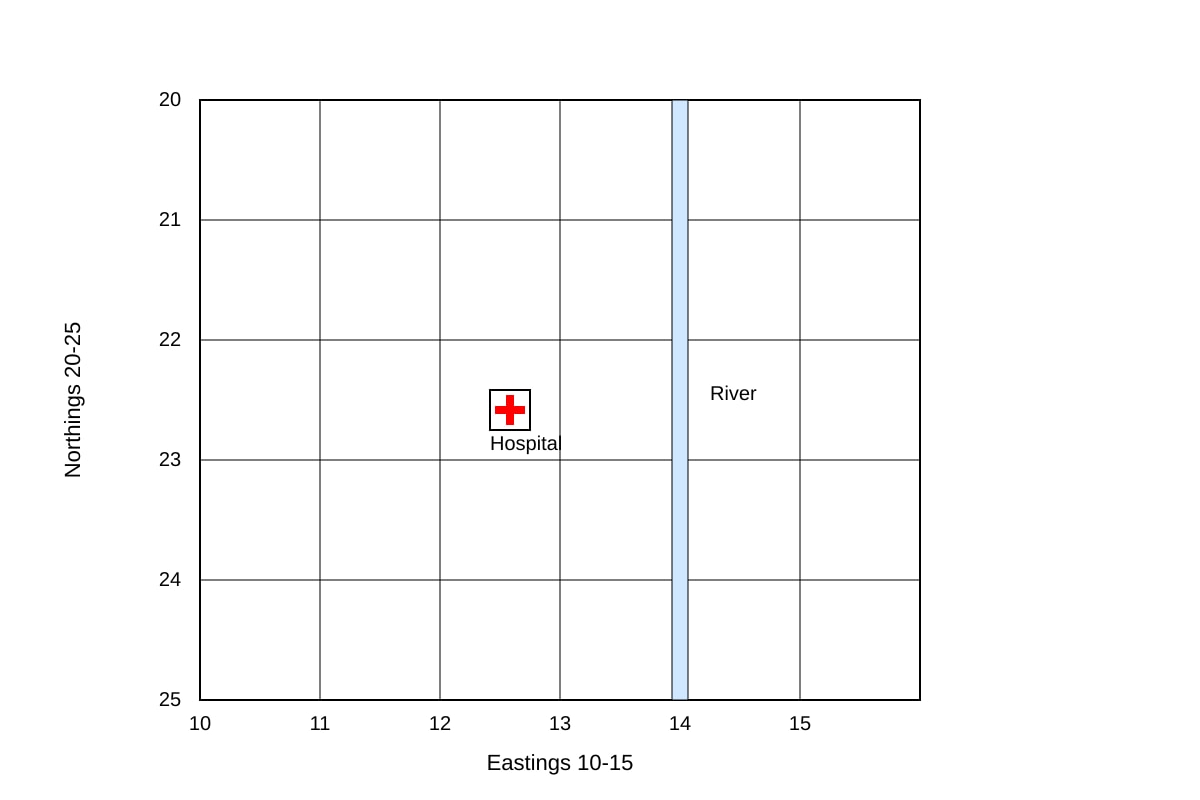
3. Study the map extract below.
Image pending generation: map for Q3.
State the four-figure grid reference of the hospital.
4. A bar graph shows rainfall (mm) per month. The y-axis is labelled "Rainfall (mm)" from 0 to 200. The bar for January reaches the 120 mark. What is January's rainfall?
___________________________ mm
5. A line graph has x-axis "Year" (2010 to 2020) and y-axis "Urban population (%)". In 2015 the line is at 55%. What does the y-value represent?
6. A table shows: Country A forest area 40%, Country B forest area 25%. Which country has a higher percentage of forest area?
7. A pie chart is divided into: Housing 50%, Transport 30%, Industry 20%. What fraction of the pie is Transport?
8. On a photograph, you see dense low-rise self-built shelters without formal roads. What term describes this type of settlement?
9. A map scale is 1 cm = 2 km. Two points are 5 cm apart on the map. What is the actual distance?
___________________________ km
10. A graph axis uses the code "Pop." for the vertical axis. What word does this code most likely stand for?
Section B: Structured Interpretation (Questions 11–16)
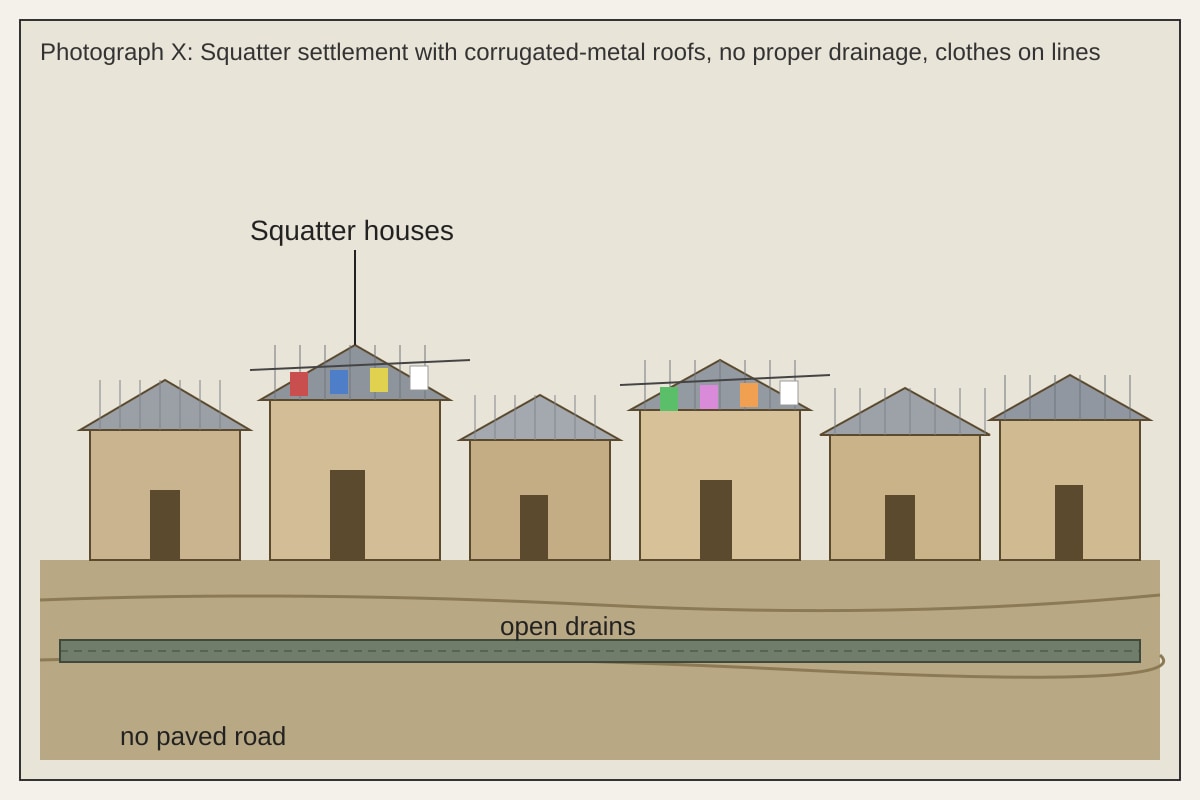
11. Study Photograph X below.
Image pending generation: source_image for Q11.
(a) Describe one visible characteristic of the settlement. (1 mark)
(b) Explain one problem this creates for the environment. (1 mark)
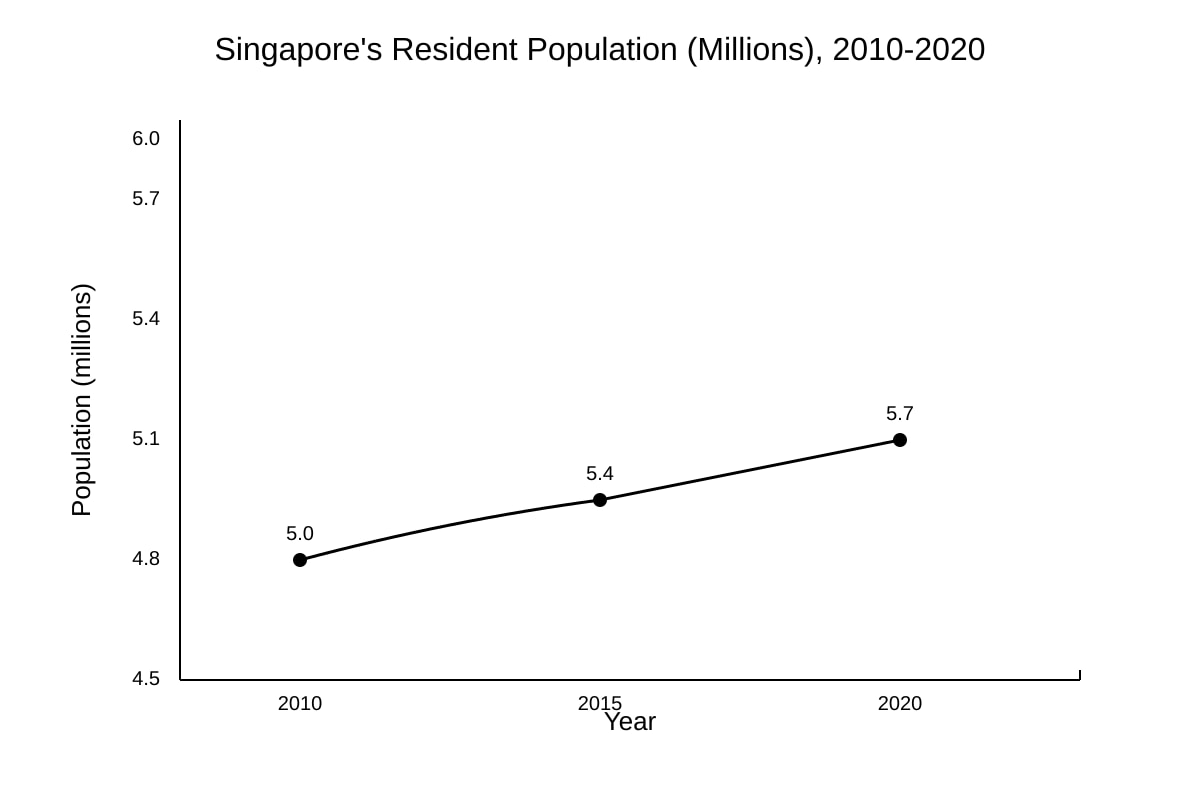
12. Fig. 2 shows a line graph of Singapore's resident population (millions) from 2010 (5.0) to 2020 (5.7).
Image pending generation: graph for Q12.
Describe the trend in Singapore's resident population from 2010 to 2020. Use figures. (2 marks)
13. A bar chart compares water use in litres per person per day: Domestic 140, Industry 90, Agriculture 50.
(a) Which sector uses the most water? (1 mark)
(b) Suggest one reason why this sector uses the most. (1 mark)
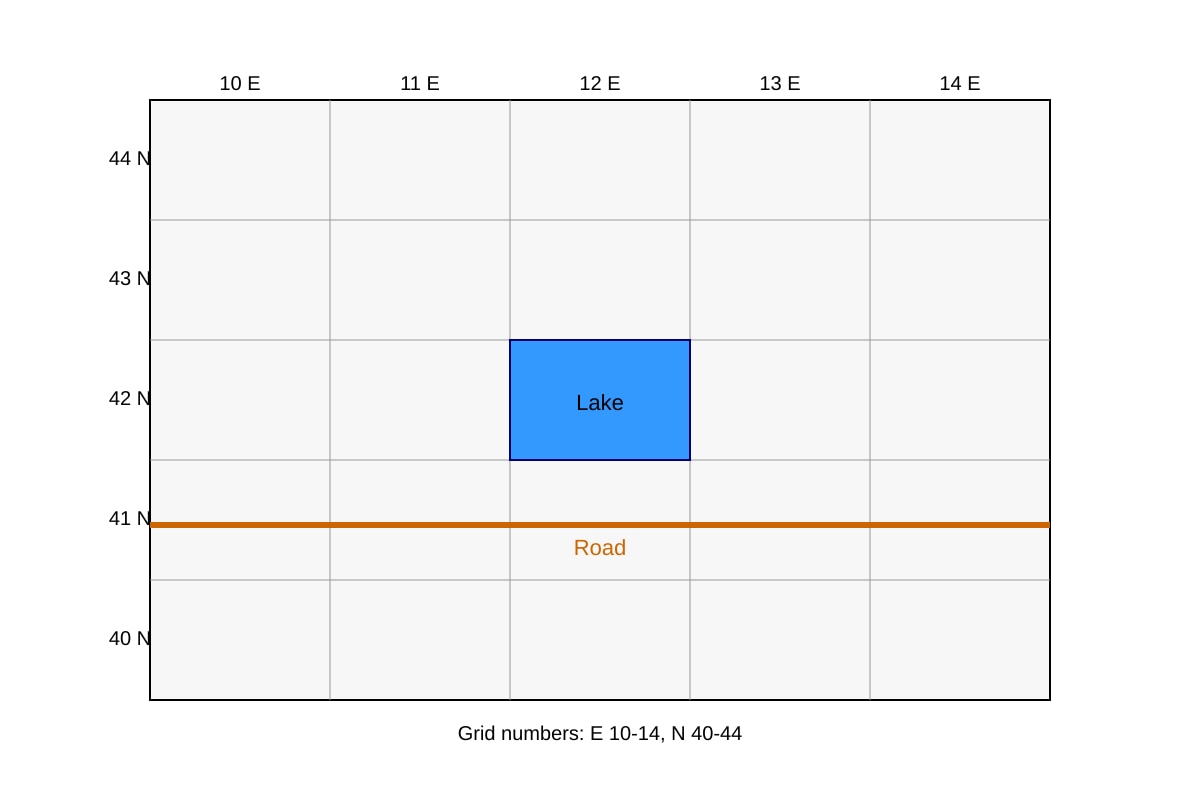
14. Study the map below.
Image pending generation: map for Q14.
Give the four-figure grid reference of the lake. (1 mark)
State one way the road helps people living near the lake. (1 mark)
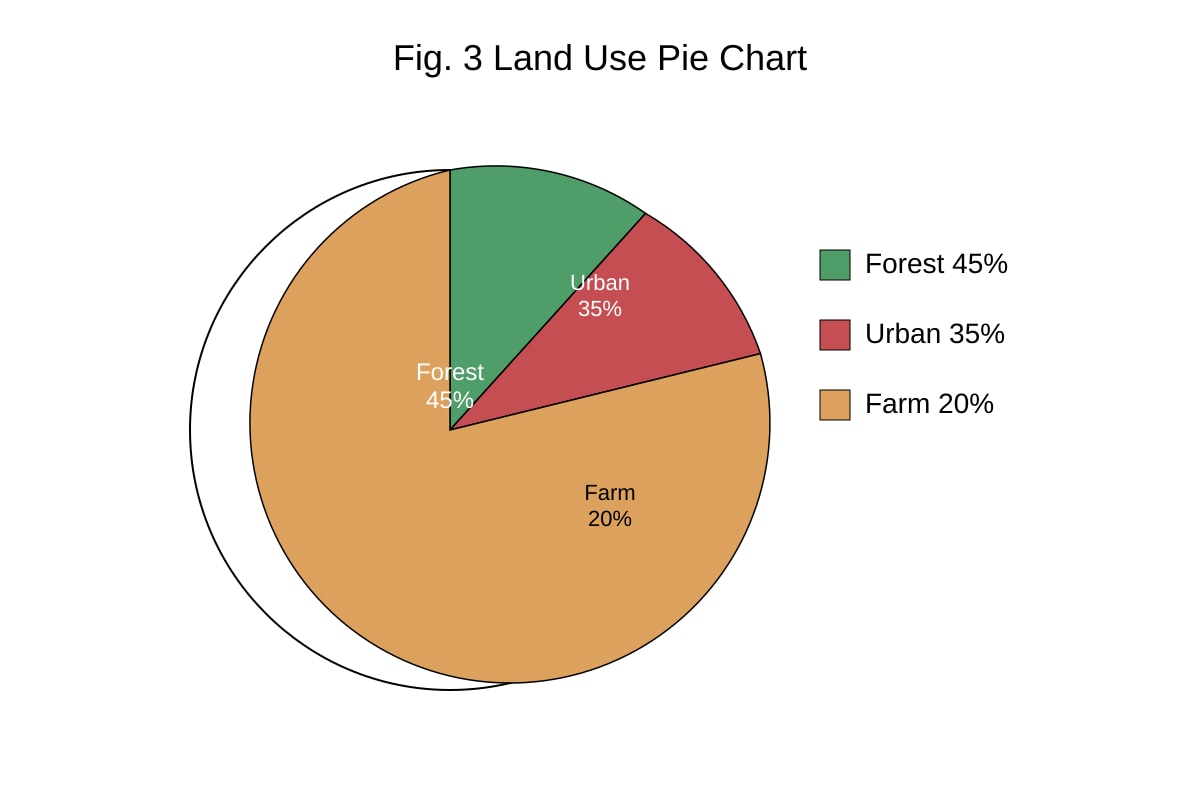
15. Fig. 3 is a pie chart of land use: Forest 45%, Urban 35%, Farm 20%.
Image pending generation: chart for Q15.
What percentage of land is not urban? (1 mark)
Name one environmental benefit of the forest slice. (1 mark)
16. A student measured river width at two sites: Site 1 = 4 m, Site 2 = 9 m.
(a) Calculate the difference in width. (1 mark)
________________________________________________________ m
(b) State one reason the river may be wider at Site 2. (1 mark)
Section C: Extended Data Questions (Questions 17–20)
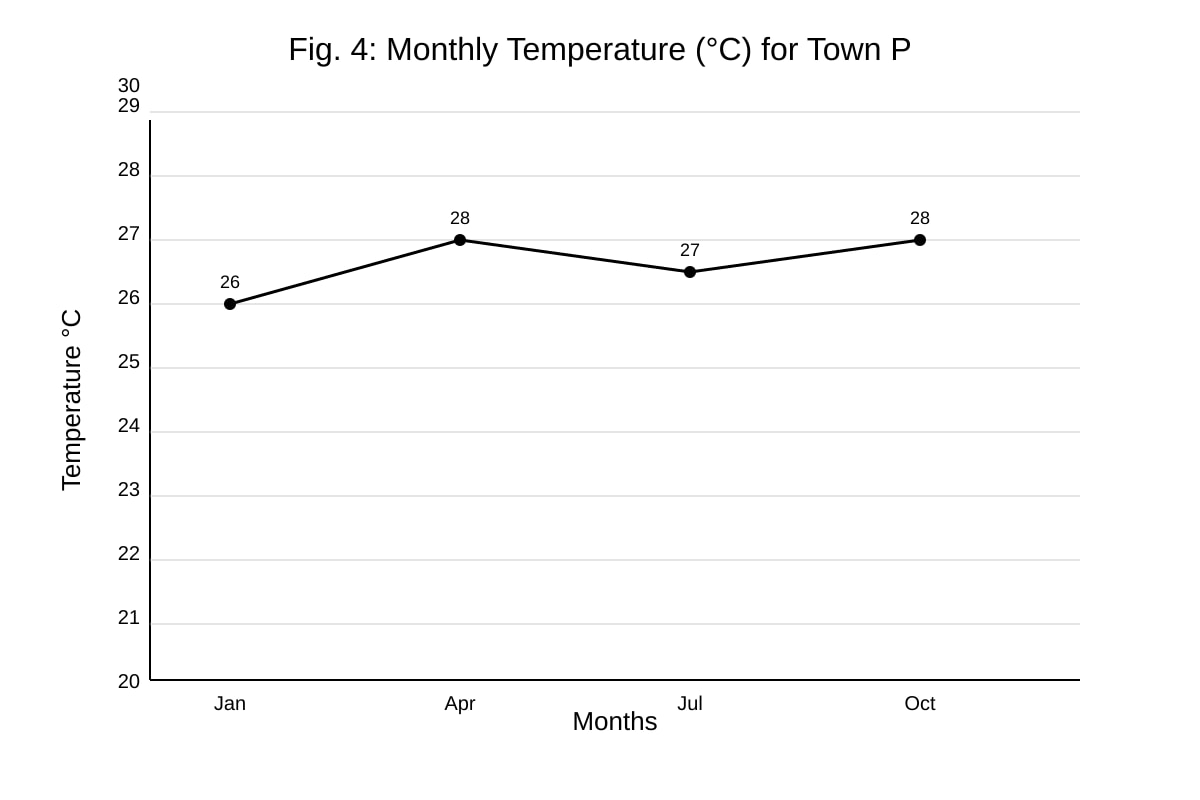
17. Fig. 4 shows monthly temperature (°C) for Town P: Jan 26, Apr 28, Jul 27, Oct 28.
Image pending generation: graph for Q17.
Describe the temperature trend and calculate the range. (3 marks)
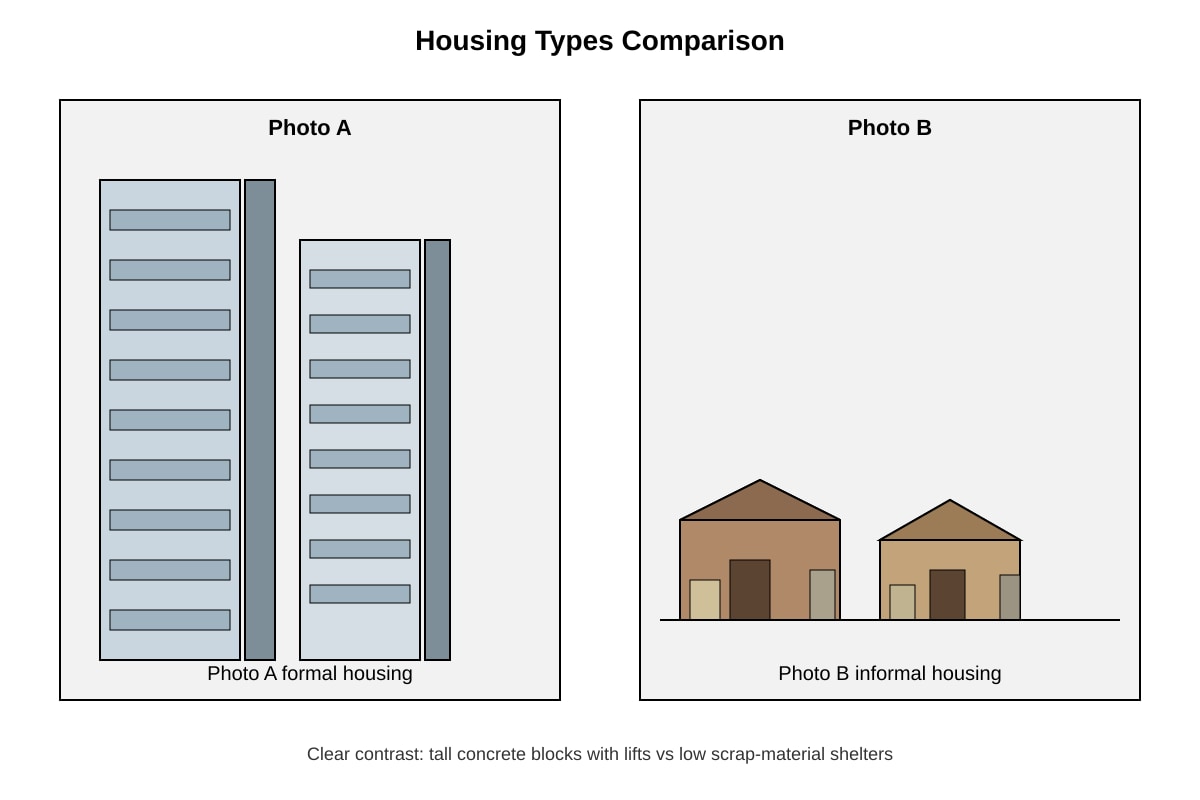
18. Two photographs show Housing Type A (high-rise public flats with lifts) and Housing Type B (squatter shelters).
Image pending generation: source_image for Q18.
Compare the two housing types using two differences. (4 marks)
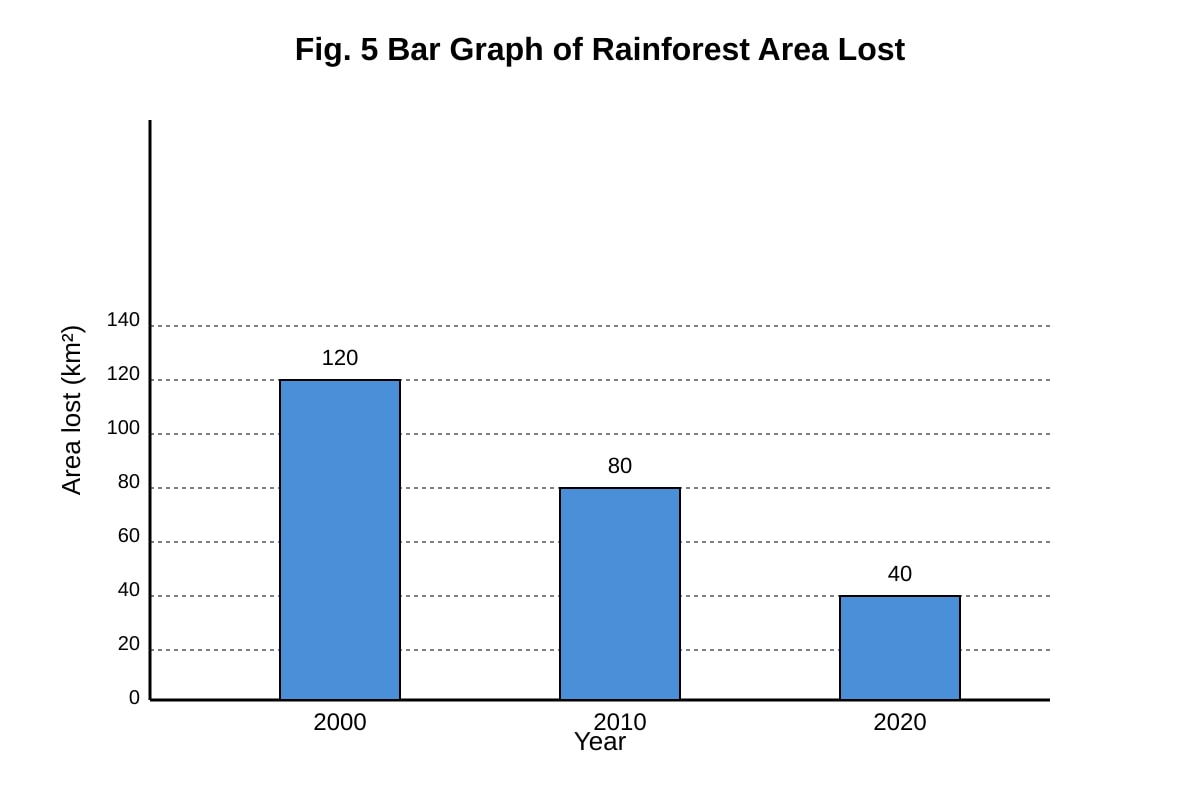
19. Fig. 5 shows a bar graph of rainforest area (km²) lost per year: 2000 = 120, 2010 = 80, 2020 = 40.
Image pending generation: graph for Q19.
(a) Describe the trend. (2 marks)
(b) Calculate the percentage decrease from 2000 to 2020. (2 marks)
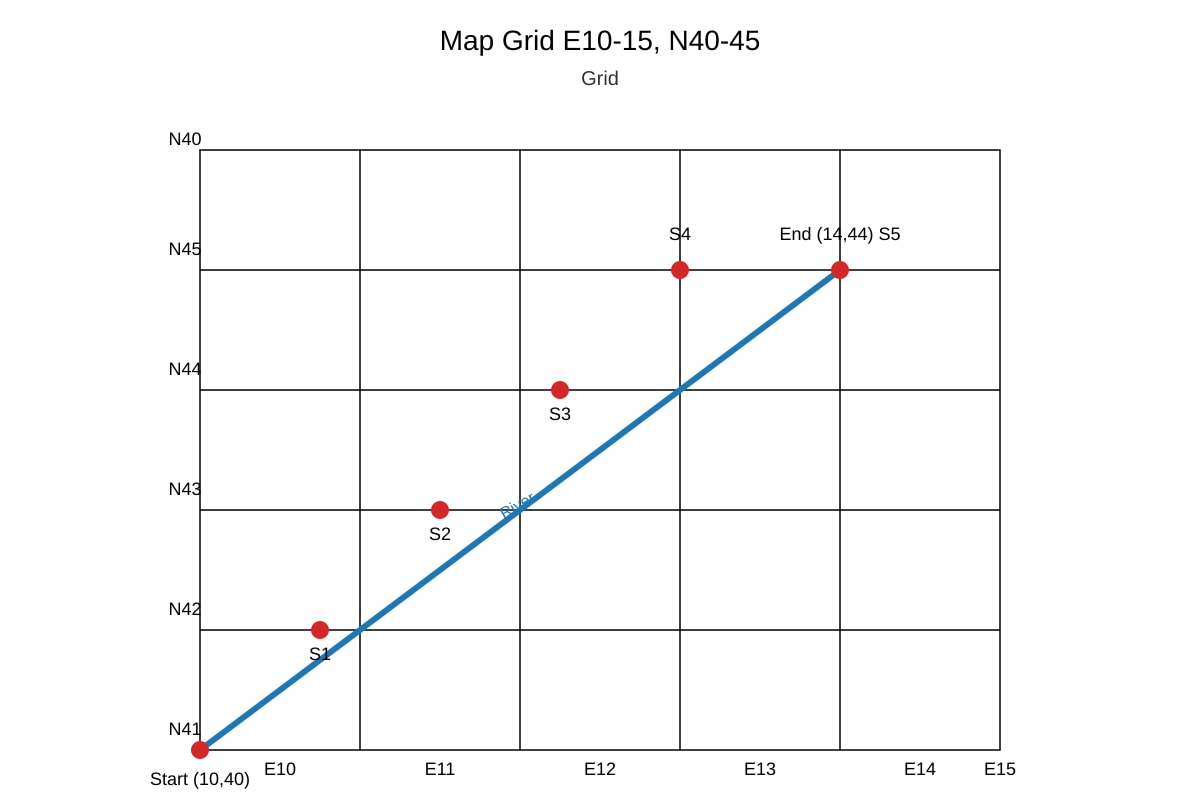
20. A map extract shows a proposed fieldwork survey route along a river: Start at grid 10 40, End at grid 14 44, with 5 sample points evenly spaced.
Image pending generation: map for Q20.
(a) Give the four-figure grid reference of the end point. (1 mark)
(b) Explain why sampling at 5 points along the river is useful for fieldwork. (2 marks)
(c) Name one safety precaution for students doing this survey. (1 mark)
Answers
Secondary 2 Geography Quiz - Answer Key (Map Graph Data Skills)
Total Marks: 40
Level: Secondary 2
Topic: Map, Graph & Data Skills
Section A Answers (1 mark each)
Q1. 1234
Teaching note: Four-figure grid reference = easting first (12, between 12–13) then northing (34, between 34–35). Common mistake: writing northing first (3412).
Q2. 18
Teaching note: Six-figure 184 372 → first three digits (184) are easting; nearest full line is 18. The 4 means 4/10 inside the square.
Q3. 1222
Teaching note: From image, hospital is in square 12–13 E / 22–23 N → easting 12, northing 22. Read image_placeholder Q3-fig1: hospital inside 12-13 E / 22-23 N.
Q4. 120 mm
Teaching note: Bar height touches 120 on y-axis labelled Rainfall (mm). Read the value directly.
Q5. Urban population (%)
Teaching note: Y-axis labelled "Urban population (%)" means the value shows percentage of people living in urban areas.
Q6. Country A
Teaching note: 40% > 25%; higher percentage = more forest area.
Q7. 30% (or 3/10)
Teaching note: Transport = 30% of pie. Fraction = 30/100 = 3/10.
Q8. Squatter settlement / informal housing
Teaching note: Dense self-built shelters without formal planning are called squatter settlements (informal housing).
Q9. 10 km
Teaching note: Scale 1 cm = 2 km. Distance = 5 cm × 2 km/cm = 10 km.
Q10. Population
Teaching note: "Pop." is standard abbreviation for Population on graphs.
Section B Answers
Q11. (a) 1 mark: Dense cluster of small corrugated-metal houses / no proper roads.
(b) 1 mark: Open drains and lack of sewage cause water pollution / flooding.
Teaching note: Describe what is seen, then link to environmental harm (e.g., polluted river).
Q12. 2 marks: Population rose steadily from 5.0 million in 2010 to 5.7 million in 2020 (1 mark). Increase of 0.7 million over 10 years (1 mark).
Marking: 1 for trend+start/end figures, 1 for specific figures or mention of rise amount.
Q13. (a) 1 mark: Domestic.
(b) 1 mark: People use water for bathing, cooking, cleaning daily / higher daily need.
Teaching note: Domestic use includes all household needs, usually largest in cities.
Q14. 1 mark: 1142.
1 mark: Road gives access for transport / brings people to lake for recreation or water use.
Teaching note: Lake in 11–12 E / 42–43 N → 1142.
Q15. 1 mark: 65% (45+20).
1 mark: Forest stores carbon / provides habitat / prevents erosion.
Teaching note: Not urban = forest + farm = 65%.
Q16. (a) 1 mark: 5 m (9 − 4).
(b) 1 mark: River erodes more downstream / joins tributaries.
Teaching note: Subtraction gives difference; width increases due to erosion/confluence.
Section C Answers
Q17. 3 marks
- Trend: temperatures stayed between 26°C and 28°C, small fluctuation, no big change (1 mark).
- Range = highest − lowest = 28 − 26 = 2°C (1 mark for method, 1 mark for answer).
Marking descriptors: 1 trend, 1 calc method, 1 final range.
Q18. 4 marks (2 differences × 2 marks each)
Difference 1: Height — A is high-rise with lifts; B is low single-storey (1 mark desc, 1 mark compare).
Difference 2: Materials — A uses concrete/formal; B uses scrap/improvised (1 mark desc, 1 mark compare).
Teaching note: Use photo labels from Q18-fig1. Each clear contrast = 2 marks.
Q19. 4 marks
(a) 2 marks: Area lost decreased from 120 km² (2000) to 40 km² (2020); steady decline every decade.
(b) 2 marks: % decrease = (120 − 40) / 120 × 100 = 80/120 × 100 = 66.7% (1 method, 1 answer).
Teaching note: Show working; common mistake is using wrong base (40 not 120).
Q20. 4 marks
(a) 1 mark: 1444 (end at 14 E / 44 N).
(b) 2 marks: Sampling at 5 points shows changes along river (1); gives representative data, not just one spot (1).
(c) 1 mark: Wear boots / stay away from deep water / go with teacher.
Teaching note: From Q20-fig1, end point grid 14 44; safety = standard fieldwork precaution.
Free quiz and exam paper access
Enter your details to view this paper
Your access is remembered on this device.